An Analysis of Domestic Water Demand Structure and Water Recycling in Beijing
Bạn đang xem bản rút gọn của tài liệu. Xem và tải ngay bản đầy đủ của tài liệu tại đây (416.18 KB, 12 trang )
Journal of Water and Environment Technology, Vol. 9, No.2, 2011
An Analysis of Domestic Water Demand Structure and
Water Recycling in Beijing
Ryuichi TACHIBANA*, Hirokazu KURAHASHI**, Rong QI***, Wei AN***, Min
YANG***, Koichi FUJIE****
*Faculty of Regional Environment Science, Tokyo University of Agriculture, Tokyo 156-8502,
Japan
**Depertment of Ecological Engineering, Toyohashi University of Technology, Aichi
441-8580, Japan
***Research Center for Eco-Environmental Sciences, Chinese Academy of Sciences, Beijing,
100085, People’s Republic of China
****Graduate School of Environment and Information Sciences, Yokohama National University,
Yokohama, Kanagawa 240-850, Japan
ABSTRACT
This study aims to obtain the knowledge necessary for constructing an urban water recycling
system in Beijing City. A macro-scale water balance model was constructed for Beijing City
according to statistical data, and domestic water demand structure in the city was analyzed
through a survey of 124 families living in the Haidian district in 2006. Annual per capita water
use in Beijing City was 220 L, and about 75% of it was used for cooking, washing, showering,
and toilet flushing. The use of reclaimed wastewater for toilet flushing and room cleaning, which
was estimated as 22% of domestic water demand, was deemed acceptable by most of households
questioned. Finally, we estimated the effect of supplying reclaimed wastewater for municipal use
by macro-scale water balance estimation based on the structure of municipal water demand.
Assuming that 60% of treated sewage is reclaimed from 41% of the current total, this would
result in a saving of 122 million m3 of the groundwater required. Moreover, with the useful ratio
of reclaimed wastewater set to 80% and 100%, 250 million m3 and 377 million m3 of
groundwater, respectively, can be saved.
Keywords: reclaimed wastewater, water demand and supply, water resource
INTRODUCTION
China has various critical problems including the increase in population and lifestyle
changes following a period of economic growth. It is generally known that China must
feed and take care of the needs of 1.3 billion inhabitants, or 22% of the world
population, with only 7% of the world’s arable land and 6% of its freshwater resources
(Fischer et al., 1998).
North China has only about 20% of the country’s water resources but supports more
than half of the total population (Guan and Hubacek, 2008). In this area, per capita
water availability is a little more than half of the national level and 1/10 of the world
average (Yang et al., 2005; Guan and Hubacek, 2008). An increasing demand for water,
including agricultural, industrial, and municipal purposes uses across the country, has
been forecasted. The provinces in eastern and north-eastern China, including Beijing
and Tianjin, are likely to face increasingly serious water shortage problems by 2050
(Kaneko et al., 1998). In Beijing, per capita water availability is a little more than 1/3 of
the national level (Yang et al., 2005).
Address correspondence to Ryuichi Tachibana, Faculty of Regional Environment Science,
Tokyo University of Agriculture, Email:
Received July 1, 2010, Accepted March 25, 2011.
- 129 -
Journal of Water and Environment Technology, Vol. 9, No.2, 2011
The city has taken steps to conserve water resources by improving water supply
efficiency, adopting water-saving equipment, and other measures. Furthermore, reusing
reclaimed wastewater is another option to ensure a stable supply of water. Until now,
reclaimed wastewater has been mainly used for industrial cooling and landscaping.
However, it is important that reclaimed water can be supplied to households since
residential water consumption generally constitutes more than half of the total
municipal water use and consumption (Howe and Linaweaver, 1967; Grima, 1972). In
order to estimate how much residential water can be substituted by reclaimed
wastewater, it is important to understand the structure of residential water consumption
(Shan et al., 2007). Very few studies on residential water use in Beijing City have been
carried out. Zhang and Brown (2005) focused on household behaviors and perceptions
that affect water use and consumption in Beijing and Tianjin. However, they did not
consider seasonal changes. Furthermore, family water use was calculated on the basis of
monthly data.
This study aims to obtain knowledge for constructing an urban water recycling system
in Beijing City. Initially, we made macro-scale water balance estimates for Beijing City
based on statistical data. Next, we analyzed domestic water demand structure in Beijing
through a survey on 124 families living in Haidian District in 2006. Finally, we
estimated the effect of recycling water supply on the municipal use by macro-scale
water balance modeling based on the structure of municipal water demand.
MATERIALSAND METHODS
Macro-scale water balance estimation for Beijing City
We constructed a macro-scale water balance model for Beijing City according to
statistics from the 2005 Statistical Yearbook (National Bureau of Statistics of China,
2005), the Beijing administrative area (Beijing Municipal Bureau of Statistics, 2005a)
and Beijing (Beijing Municipal Bureau of Statistics, 2005b), and from reports on
sewerage works in the city. We used the 2005 Statistical Yearbook as the basic data for
this study. As discussed later, we conducted a survey of water demand in Beijing City in
2006. Therefore, the 2005 Statistical Yearbook is the latest we could use for the results
of this survey.
Calculating household water use
We conducted a survey using two questionnaires to calculate residential water demand
in Beijing City. The participants of this survey, which was conducted from 19 to 27
October 2006, were 124 families living in the Haidian District of Beijing City. The
Haidian District is located in the southern area of the city, northwest of downtown
Beijing (Fig. 1). The Haidian District with a population of 2.8 million people accounts
for a quarter of Beijing City’s population (Beijing Municipal Bureau of Statistics,
2005a). It is assumed that households comprise three people, and that the average age in
the Haidian District is around 40. These features are characteristics common to Beijing
City. So, the results obtained here can be thought of as being typical of Beijing City.
By the end of 2003, the registered population of the district was 2.4 million, 3.4% more
than in 2002. It has been predicted that this number will increase (Beijing Municipal
Bureau of Statistics, 2005b). This district is also a cultural, scientific, and educational
- 130 -
Journal of Water and Environment Technology, Vol. 9, No.2, 2011
Beijing City
Haidian District
China
The center of Beijing
Fig. 1 - Location map of Beijing city and Haidian District
center, and has many places of interest and famous shopping areas (Beijing Municipal
Bureau of Statistics, 2005b). One of the questionnaires was answered by a target
household immediately after the visit. Target households were asked to provide the
following information: number of members, age of members, monthly income, monthly
tap water cost, frequency of water use for tooth-brushing, washing among others, as
well as the awareness and behavior for water saving, and environmental attitude for
reclaimed water use. An average figure for monthly frequency of water use was required
for showering and washing, and this had to be estimated separately for summer and
winter, because the frequency of water use was clearly different in these seasons.
The other questionnaire was answered by the household at the end of the six-day survey
for each day of the study period. The questions were read before and after each period
of water use, and the frequency and head count of water use were provided by the
household. Target water uses were food washing, cooking, dish washing, boiling water,
face washing, tooth-brushing, using washing machine, showering, foot washing, toilet
flushing, and cleaning.
According to Murakawa et al. (1999), water use patterns differ according to the purpose
of use. Proper water use practices are determined by cultural characteristics. Some
specific water use practices have been observed in Beijing. As regards the practice of
boiling water, less than 5% of household members in the city drink tap water. Most of
them traditionally drink only boiled water (Zhang and Brown, 2005). To cite another
example, the Chinese people generally perform “foot washing” instead of showering.
Zhang and Brown (2005) reported that housing typology does not significantly affect
household water use and consumption. Therefore, housing typology is not considered in
this study.
We can determine water use by the following equations:
Per capita water use based on household size d in spring and fall (L/man/day):
10
AAWU d
2
WU d ,u+ AWU d ,w
u 1
w 1
N d NS d
- 131 -
(1)
Journal of Water and Environment Technology, Vol. 9, No.2, 2011
where
AAWUd: per capita water use based on household size d in spring and fall (L/man/day)
WUd,u: water use u with no seasonal change in all households of size d for a day (L/all
households/day)
AWUd,w: seasonal water use w in all households of size d for a day in spring and fall
(L/all households/day)
Nd: number of households of size d (number)
NSd: number of people per household in size d (man/household)
d: household size class (6 classes)
u: water use with no seasonal change (10 water uses)
w: seasonal water use (2 water uses)
Per capita water use based on household size d in summer (L/man/day):
10
2
WU d ,u+ 1 SWU d ,w
u 1
w
SAWU d
N d NS d
(2)
where
SAWUd: per capita water use based on household size d in summer (L/man/day)
SWUd,w: seasonal water use w in all households of size d for a day in summer (L/all
households/day)
Per capita water use based on household size d in winter (L/man/day):
10
2
WU d ,u+ 1WWU d ,w
u 1
w
WAWU d
N d NS d
(3)
where
WAWUd: per capita water use based on household size d in winter (L/man/day)
WWUd,w: seasonal water use w in all households of size d for a day in winter (L/all
households/day)
Per capita annual water use based on household size d (L/man/day):
(AAWUd × (3 + 2)+SAWUd × 3+WAWUd × 4)
CAWUd =
12
(4)
where
CAWUd: per capita annual water use based on household size d (L/man/day)
It is assumed that spring and summer were three months (90 days) each, and fall and
winter two months (60 days) and four months (120 days), respectively.
Annual water use of all households in Beijing City (L/year):
- 132 -
Journal of Water and Environment Technology, Vol. 9, No.2, 2011
6
AWUB = (CAWU d × NS d × NBd )
∑
(5)
d =1
where
AWUBd: annual water use of all households in Beijing City (L/year)
NBd: number of households of size d in Beijing City (number)
The composition of households in Beijing City was based on a statistical yearbook
(Beijing Municipal Bureau of Statistics, 2005b).
RESULTSAND DISCUSSION
Macro-scale water balance in Beijing City
Yang and Abbaspour (2007) showed changes in water use in different sectors, as well as
wastewater discharge and treatment capacity in Beijing since the 1990s. Total water use
has remained stable, and even declined, in recent years. However, the continued
over-withdrawal of water resources since the 1980s has led to the depletion of aquifers,
reducing water availability on the one hand and increasing cost of water supply on the
other (Yang and Abbaspour, 2007). As a result, water scarcity has increased over the
years (Beijing Water Management Bureau Information, 2001).
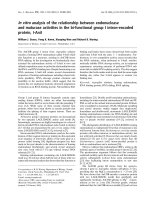
Macro-scale water balance in Beijing City appears in Fig. 2. Beijing City has two
sources of water supply: surface water and groundwater. The amount of surface water
supplied and ground water available are 824 and 1,236 million m3, respectively. Surface
Evaporation
Total water supply
2,060 (100%)
307
Municipal use
Surface water
824 (40%)
680
(Not including
reclaimed wastewater)
610
* Reclaimed
wastewater 260
Groundwater
(Including
well water)
1,236 (60%)
Recycling
6,205
144
626
470
1,290
513
Sewage works
377
637
Discharge
849
124
Industrial use
6,775
million m3yr-1
(Not including
reclaimed wastewater)
2
* It is not clear using distribution of reclaimed wastewater.
All reclaimed wastewater is assumed to have evaporated after use.
Fig. 2 - Macro-scale water balance in Beijing City, assuming that reclaimed wastewater
from sewerage works is supplied for municipal use and industrial use
- 133 -
Journal of Water and Environment Technology, Vol. 9, No.2, 2011
water is supplied for municipal and industrial use. The amount of groundwater supplied
is 1,994 million m3 per year for municipal and industrial use. Beijing City depends on
groundwater for 60% of its total water requirements. Of the total amount supplied,
about 60% is for municipal use, and about 40% for industrial use. Municipal water use
includes domestic use and public use. A large volume of water is required for industrial
use. However, diversion of water resources for industrial use has decreased because
90% of industrial water is recycled.
Source: Statistical Yearbook of China (National Bureau of Statistics of China, 2005) and
Beijing (Beijing Municipal Bureau of Statistics, 2005b), and data from sewerage plants.
In 2005, wastewater treated in sewerage works amounted to 637 million m3, 41% of
which (260 million m3) was reclaimed and supplied for municipal and industrial uses.
However, the figures for distribution of reclaimed wastewater were unclear. All
reclaimed wastewater is assumed to have evaporated after use. The remaining 59% (377
million m3) is discharged. Consequently, to lower the load of wastewater directly
discharged to the environment and raise the reclaimed water supply, wastewater
treatment should be increased and treatment techniques improved.
Household socioeconomic characteristics
Size of households sampled for the survey appears in Fig. 3. As shown, 64% of the
sampled households comprise three people (parents and a child), 19% include two
people, 9% four people, 7% five people, and 1% one person. There is no great
difference in household size among urban households because of, in part, the
government’s “one child” policy (Zhang and Brown, 2005).
Ages of the sampled household members appears in Fig. 4. As shown in the figure, 34%
of household members were 40 to 49 years old, 17% were 30 to 39 years old, 14% of
the members were 50 to 59 years old, 12% were 0 to 14 years old, 12% were 19 to 29
years old, and 3% of the members were 60 to 69 years old.
Household monthly income appears in Fig. 5. Most of the households (63% of the
sample) earned 1,000 to 2,999 yuan, 12% earned 3,000 to 3,999 yuan, 12% earned
Persons of household
One
N=124
1(1%)
Two
24(19%)
Three
79(64%)
Four
11(9%)
Five
5(4%)
Six
4(3%)
0
20
40
60
80
Number of household
Fig. 3 - Household size of sampled households
- 134 -
100
Journal of Water and Environment Technology, Vol. 9, No.2, 2011
15-18
Age (years old)
N=352
42(12%)
0-14
30(8%)
42(12%)
19-29
30-39
59(17%)
40-49
119(34%)
51(14%)
50-59
60-69
9(3%)
0
30
60
90
120
150
Number of person
Fig. 4 - Age of sampled household members
<1,000
N=124
3(2%)
Monthly income (yuan)
1,000-1,999
38(31%)
2,000-2,999
39(32%)
3,000-3,999
15(12%)
4,000-4,999
10(8%)
5,000-5,999
15(12%)
6,000≦
4(3%)
0
10
20
30
40
50
Number of household
Fig. 5 - Monthly income of sampled households
5,000 to 5,999 yuan, 8% earned 4,000 to 4,999 yuan, 3% earned 6,000 yuan or more,
and 2% earned less than 1,000 yuan.
The household water rate for each income range appears in Fig. 6. The monthly water
rate for households with monthly income of less than 1,000 yuan was about 16 yuan,
while that for households with a monthly income of over 1,000 yuan was 20 to 30 yuan.
Previous investigations had shown that household income was proportional to the
amount of water use (Murakawa et al., 1999; Zhang and Brown, 2005). In this study,
the impact of income to water consumption could also be observed, although it was not
so significant. Chinese society is drastically changing, so in addition to household
income, the age, origin, number and educational background of a household could also
possibly affect its level of water consumption.
Household water uses and behavior
The annual amount of per capita water use for different water use facilities, by
household size, appears in Table 1. The single-person household data of water use for
- 135 -
Journal of Water and Environment Technology, Vol. 9, No.2, 2011
showering, toilet flushing and cleaning were not available. Structure of annual and
seasonal per capita water demand in Beijing City appears in Fig. 7. This contrasts with
the structure of annual per capita water demand in Tokyo City, shown in Fig. 8. Of the
per capita water use, 31% was employed in the kitchen for food washing, cooking, dish
washing, and boiling water, 27% for showering and foot washing, 18% for toilet
flushing, and 14% for the washing machine. Water use in washing and showering
increased from 12 to 17% and from 16 to 25%from summer to winter, respectively. Per
capita water use in each water use activity was very low in households with five or six
people. Generally, the Chinese bathe in groups (Murakawa et al., 1999). It is quite likely
that this factor causes the dispersal of water use for showering and foot washing.
In the next survey, the domestic water demand structure of Beijing City was compared
to that of Tokyo City. As reports on domestic water demand structure are rarely
completed in cities around the world, we decided that it would be useful to compare
these two similar Asian metropolises.
Water use for cooking in Beijing (31%) is 1.3 times that of Tokyo (23%). It is assumed
that water use for cooking in Beijing includes food washing, cooking, dish washing, and
boiling water. The use of water for bathing and showering accounts for 24% in Tokyo
and 27% in Beijing, with little difference between the cities. However, regarding toilet
Monthly income (yuan)
<1,000
1,000-1,999
2,000-2,999
3,000-3,999
4,000-4,999
5,000-5,999
6,000≦
0
10
20
30
40
50
Water rate (yuan / month)
Fig. 6 - Water rate for different household income ranges
The bars indicate S. D.
Table 1 - Annual per capita domestic water use by household size
for different water use facilities [L/man/day]
Household
(Persons)
Number of
household
Food
washing
1
2
3
4
5
6
1
24
79
11
5
4
9.0
24.0
24.6
20.1
19.6
2.5
11.5
17.6
13.1
11.6
15.3
2.9
6.8
23.2
17.7
22.0
17.2
3.3
5.5
13.8
15.0
8.9
14.7
1.3
6.3
13.2
9.7
6.9
6.3
1.3
3.8
5.5
4.2
2.9
3.1
1.2
71.9
25.4
33.0
30.9
34.6
13.2
0.0
60.0
34.5
54.4
8.9
20.9
6.3
14.4
16.8
23.1
15.9
3.9
0.0
36.3
45.5
52.6
8.9
3.6
0.0
8.8
10.8
6.4
6.4
0.6
Average
124
23.1
13.6
18.6
13.7
9.7
4.2
31.1
39.5
16.4
41.2
9.4
Cooking
Dish
washing
Boiling
water
Face
washing
- 136 -
Toothbrushing
Washing
Showering
machine
Foot
washing
Flushing
toilet
Cleaning
Journal of Water and Environment Technology, Vol. 9, No.2, 2011
Spring
6.4
10.5
Summer
10.5
Winter
10.8
Annual
6.1
5.4 7.6 5.1
8.8
Fall
9.1
10.1
0
6.4
9.1
6.6
6.2
8.7
17.0
6.1
9.4
12.5
6.3
5.8
13.6
17.8
19.2
19.7
11.8
Cooking
Dish washing
Boiling water
Washing machine
80
Flushing toilet
8.2 4.6 4.2
2.0
19.4
60
Food washing
7.9 4.4 4.1
1.9
16.4
18.4
40
7.9 4.4 4.1
1.9
3.4
6.6 3.7
1.6
24.9
16.0
12.5
20
17.8
19.2
Foot washing
7.6 4.3 4.0
1.8
100
Showering
Face washing
Tooth-brushing
Cleaning
Amount of residential water use (%)
Fig. 7 - Annual and seasonal per capita domestic water demand structure in Beijing
City
Annual
23
0
17
20
28
40
24
60
80
8
100
Cooking
Washing machine
Flushing toilet
Bathing and showering
Face washing and others
Amount of residential water use (%)
Fig. 8 - Annual per capita domestic water demand structure in Tokyo City
(Bureau of Waterworks, Tokyo Metropolitan Government, 2002)
flushing, the figures were 28% in Tokyo and 18% in Beijing. Water use for face
washing and other purposes accounted for 8% in Tokyo and 10% in Beijing. Thus, there
seems to be a little difference between the water demand structures of the two cities.
Per capita water use in different seasons, by household size, is shown in Table 2. Per
capita water use in Tokyo is given in Table 3. Annual per capita water use in the city
exhibitslittle difference between one- and two-person households. Therefore, from the
calculated average, we can assume that the data for one- and two-person households are
similar. The annual per capita water use in Beijing is 220L——53L, 63L, and 51L in
spring and fall, summer, and winter, respectively. Thus, water demand in summer is 1.2
times that of the winter demand. This seasonal tendency is consistent with the published
data in, for example, Suzhou, China (Murakawa et al., 1999). The annual per capita
water use in Tokyo is 232 L, similar to that in Beijing. In Tokyo, the decrease in per
capita water use is associated with an increase in the number of household members
(Table 3). However, the figures for Beijing do not show a clear relationship between the
number of household members and the amount of water use. Thus, the annual
household water use in Beijing is estimated at 980 million m3. This is about 10% higher
than the published statistics for household water use.
- 137 -
Journal of Water and Environment Technology, Vol. 9, No.2, 2011
Recycling water for domestic use and effects of recycling water supply
Attitudes toward the different uses of reclaimed wastewater are shown in Fig. 9. Of the
sampled households, 98% answered positively for cleaning, 86% for toilet flushing, and
44% for watering plants. On the other hand, over 80% households were not in favor of
using reclaimed wastewater for washing machines, cleaning of pets, dish washing,
showering and cooking. Lu et al. (1992) also reported that over 80% of the Chinese
Table 2 - Per capita water use by household size in different seasons
Household
(Persons)
Number of
Household
1
2
3
4
5
6
Average
1
24
79
11
5
4
124
Average amount of water use (L/man/day)
Spring
Summer
Autumn
Winter
Annual
109.8
238.3
217.7
220.1
153.6
45.2
212.9
170.5
277.2
255.7
290.8
160.4
67.3
252.4
109.8
238.3
217.7
220.1
153.6
45.2
212.9
97.6
220.1
211.4
226.4
140.4
57.6
205.7
120.9
241.9
225.1
239.9
150.9
54.8
220.3
Table 3 - Per capita water use by household size in Tokyo city
(Bureau of Waterworks, Tokyo Metropolitan Government, 2006)
Household
(Persons)
Amount of water use
(L/man/day)
1
2
3
4
5
6≦
260
270
240
219
204
198
Ave.
232
2
Cleaning
98
Flushing toilet
86
Watering plant
14
44
Washing machine
Available
56
16
Unavailable
84
Cleaning a pet
9
91
Dish washing
9
n=124
(Multiple answers)
91
Showering
1
99
Cooking
100
0
20
40
60
80
100
Number of answers (%)
Fig. 9 - Attitudes toward reclaimed wastewater use for different activities
- 138 -
Journal of Water and Environment Technology, Vol. 9, No.2, 2011
population was in favor of using reclaimed wastewater for toilet flushing, gardening and
car washing. Therefore, it would be possible to use reclaimed wastewater to flush toilets
and clean rooms, which would fulfill 20% of the annual demand of water for domestic
use.
We have recalculated the figures by using the results shown in Fig.2 for water balance
in Beijing City, assuming that all treated sewerage is reclaimed and provided for
municipal use and industrial use. It is true that the amount of flow of municipal water
into sewage works is increasing, but this has not been taken into consideration here
Assuming that 60% of treated sewage is currently reclaimed from 41% of the current
total volume, this would result in a saving of 122 million m3 of the groundwater
required. Moreover, with the useful ratio of reclaimed wastewater set to 80% and 100%,
250 million m3 and 377 million m3 of groundwater, respectively, can be saved.
CONCLUSIONS
This study aims to find ways to conserve water in urban areas. Initially, we carried out
macro-scale water balance estimations on usage in Beijing City. We found that most of
the water supply systems depend on groundwater, and that part of the municipal water is
directly discharged into the environment.
The next task consisted of calculating, the per capita residential water use, categorized
by purpose and household size, in order to obtain a clear picture of the structure of
residential water demand in the city.
It was found that the annual per capita water use in Beijing City was 220L, 75% of
which was used for cooking, washing, showering, and toilet flushing. Generally, the
annual per capita water use data are not accurate, because the calculated amount of
municipal water use, including commercial use, has to be divided by the numbers of the
population. In comparison with these data, we obtained results that are more accurate.
Annual household water use in Beijing City is 980 million m3.
Household water use and patterns of behavior, such as frequency of showering and
washing, were different in each season: 53L, 63L, and 51L in spring and fall, summer,
and winter, respectively. Thus, the demand for water in summer was 1.2 times that of
winter. The people of Beijing City did not object to the use of reclaimed wastewater use
for flushing toilets and room cleaning. These demands are estimated to account for
about 22% of domestic water demand.
Finally, we estimated the effect of supplying reclaimed wastewater for municipal use
using macro-scale water balance estimation, based on the structure of municipal water
demand. Consequently, with the respective useful ratio of reclaimed wastewater set to
60%, 80%, and 100%, 122 million m3, 250 million m3, and 377 million m3 of
groundwater, respectively, can be saved.
Further studies will be needed to investigate the demand structure of industrial and
agricultural water and to clearly explain the water balance of Beijing City. This
information will contribute to sustainable urban development in Beijing City.
- 139 -
Journal of Water and Environment Technology, Vol. 9, No.2, 2011
REFERENCES
Beijing Municipal Bureau of Statistics (2005a). Beijing administrative area statistical
yearbook 2005, Tongxin press, Beijing, China. (in Chinese)
Beijing Municipal Bureau of Statistics (2005b). Beijing statistical yearbook 2005, China
statistics press, Beijing, China. (in Chinese)
Beijing Water Management Bureau Information (2001). Compilation of planning for
sustainable use of water resources in the early 21 century in Beijing, Geological
press, Beijing, China.
Bureau of Waterworks, Tokyo Metropolitan Government (2002). Survey about use
application of domestic water in Tokyo 2002, ro.
tokyo.jp/life/g_jouzu.htm, Tokyo, Japan. (in Japanese)
Bureau of Waterworks, Tokyo Metropolitan Government (2006). Survey about use
application of domestic water in Tokyo 2006, ro.
tokyo.jp/life/g_jouzu.htm, Tokyo, Japan. (in Japanese)
Fischer G., Chen Y. and Sun L. (1998). The balance of cultivated land in China during
1988-95., International Institute for Applied Systems Analysis, Interim Report
IR-98-047, Laxenburg, Austria.
Grima A. P. (1972). Residential water demand: Alternative choices for management.
Toronto: The University of Toronto press.
Guan D. and Hubacek K. (2008). A new and integrated hydro-economic accounting and
analytical framework for water resources: A case study for North China, J. of
Environ.Manage., 88, 1300-1313.
Howe C. W. and Linaweaver F. P. (1967). The impact of price on residential water
demand and its relation to system design and price structure, Water Resources
Research, 13(1), 13-32.
Kaneko S., Mieda Y., Matsumoto T. and Imura H. (1998). Long-term forecasts of water
resource demand in China, Proc. of the Sympo. on Global Environ., 6, 315-322. (in
Japanese with English summary)
Lu J., Zhang B. and Harima M. (1992). Study and circumstance of reclaimed water
system in China, Making Water Technol., 18(1), 49-51. (in Japanese)
Murakawa S., Nishina D. and Wang L. (1999). Analysis on the structure of water
demands in dwelling houses of Suzhou, China, J. Archit. Plann. Environ. Eng., AIJ,
522, 83-90. (in Japanese with English summary)
National Bureau of Statistics of China (2005). China statistical yearbook 2005, China
statistics press, Beijing, China. (in Chinese)
Shan D., He S., Yang N., Ishibashi K. and Oya K. (2007). Urban residential water use
and citizens’ assessment of water supply services: A case study of Jining,
Wulanchabu, Inner Mongolia, China, J. of Nagoya Sangyo Univ., 10, 45-61.
Yang F., Liu Z., Cheng Y., Kawashima H. and Furukawa K. (2005).Water environmental
problems and its countermeasures in urban area of north China, Japanese J.of Water
Treat. biol., 41(1), 41-50. (in Japanese with English summary)
Yang H. and Abbaspour K. C. (2007). Analysis of wastewater reuse potential in Beijing,
Desalination, 212, 238-250.
Zhang H. H. and Brown D. F. (2005).Understanding urban residential water use in
Beijing and Tianjin, China, Habitat International, 29, 469-491.
- 140 -