Market Outlook 2012 - 2013: BOM GLOBAL ASSET MANAGEMENT docx
Bạn đang xem bản rút gọn của tài liệu. Xem và tải ngay bản đầy đủ của tài liệu tại đây (1.35 MB, 12 trang )
Some might argue that the past is best
forgotten. But in the world of nancial
forecasting, the past can provide important
perspective on the present and valuable
insights into what lies ahead. In this year’s
piece, we’ve taken a step back to examine
the journey from the prior cycle peak in 2007
through the Great Recession of 2008-2009,
up to today. From that vantage point, we
gain a clearer view on where we stand now
and what the future may hold. And, perhaps
more important, we present actionable ideas
for positioning portfolios in the New Year.
Separate Accounts
Mutual Funds
Collective Investment Trusts
Pooled Funds
UCITS
Alternative Investments
Market Outlook
2012 - 2013
JANUARY 2012
INSIGHT SERIES
1
Peak, Trough, Now and Next
The peak of the last economic cycle occurred in June 2007. GDP was strong
in many nations of the world and interest rates were much higher than today.
Consumers and businesses were spending — and banks were lending to them.
As with many economic recessions through history, the decline from the top
was swift and widespread, with the trough occurring near the middle of 2009.
Businesses began paring down expenses, consumers pulled back spending,
and banks tightened the lending reins.
The results were positive. By many measures, the U.S. economy is now at or above
those prior-peak highs. However, today’s economy is also facing unique challenges
that appear to threaten global growth. So, what’s next?
In this publication, we look at the decline from 2007 to 2009, and then the events
that drove the turnaround, comparing where we stand now to where we were
then. We also discuss the markets’ responses to government policy shifts and see
that, for the most part, they have produced encouraging results. Then, we examine
the factors that appear to be causing a slowdown in growth, and review
the
actions taken — and still needed — to sustain the recovery. Specically
, we examine
whether the economy has simply paused or is heading for a double-dip recession,
as well as what it could mean if the world’s major economies show little growth
in 2012.
Finally, we give you our thoughts on what’s next for the economy and
stock market, and how you might position your portfolio for the coming year.
Has the post-recession
rebound simply paused,
or are we heading for
a double-dip?
What if the world’s
major economies show
little or no growth
in 2012?
Market Outlook 2012 - 2013
2
THAT WAS THEN, BUT THIS IS NOW
From the peak to the trough of the recession, the major regional economies
of the world contracted, in some cases quite significantly. In the case of China,
growth slowed substantially, but barely dipped in local currency terms (Exhibit
1), while the European Union and United States both contracted considerably.
Today, we’re seeing retracement of lost ground in the United States and China,
where GDP is now above the prior peak levels. The European Union has been
slower to catch up, with GDP now just slightly higher than its prior peak.
Exhibit 1: Nominal GDP Trends in Local Currency
PEAK TROUGH NOW
U.S.
Dollars $14.4 tril 2Q08 $13.9 tril 2Q09 $15.2 tril 3Q11
EU (27) Euros €9.2 tril 2Q08 €8.8 tril 2Q09 €9.3 tril 3Q11
China RMB ¥32.1 tril 3Q08 ¥31.6 tril 2Q09 ¥48.1 tril 3Q11
Source: Bureau of Economic Analysis, Eurostat, National Bureau of Statistics: China
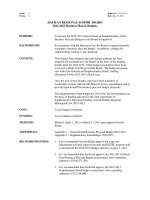
What’s behind the rebound? Very simply, this economic recovery has been orchestrated by two tools of government
worldwide — monetary and fiscal policy.
n
Monetary policy shifts. At the peak of the last business cycle in June 2007, interest rates in the U.S. were
at 5.25%. Today, they’re at 0.25%. Likewise, LIBOR (London Interbank Offered Rate) has shrunk from 5.36%
to 0.58%, while the European Central Bank (ECB) has slashed its lending rate from 4% to 1% (Exhibit 2).
A reduction in interest rates is a common way governments attempt to stem an economic decline. The goal
is to make capital affordable enough to entice businesses and consumers to invest and spend. This will only
happen when they are confident that capital is cheap, and will remain cheap. Major governments in the
U.S., Europe, and globally have sent that message — loud and clear.
Exhibit 2: Monetary Policy Shifts Interest Rates
Source: Bloomberg
Market Outlook 2012 - 2013
U.S. LIBOR (3 mo.) ECB China
0.00
1.00
2.00
3.00
4.00
5.00
6.00
5.25
5.36
4.00
1.78
0.25
1.19
1.5
0.80
0.25
0.58
1.00
3.41
n Peak 06/30/07
n Trough 03/31/09
n Now 12/31/11
OUTLOOK 2012
Our forecast is for slow economic
growth globally, including a likely
recession in Europe, modest growth
in the U.S., and continued growth
in emerging markets. We see upside
potential in U.S. equities and income
opportunities in select fixed income
segments. Our key assumptions for
the U.S. in 2012 include:
n
Slow but steady economic growth
n
Strong corporate performance,
albeit a bit weaker than present
n
Steady results from consumers
n
Major government issues are
deferred until 2013-2014
n
Range-bound inflation and
interest rates
For investors, success will hinge on
finding the best balance of asset
classes, sectors, and securities in a
slow-growth environment.
Market Outlook 2012 - 2013
3
n
Fiscal policy actions. Governments worldwide also stepped up spending to
stimulate economic growth (Exhibit 3). The U.S. led the charge, committing
more than $800 billion, of which $527.5 billion was spent from 2009 to 2010.
That represented 3.7% of GDP.
Exhibit 3: Crisis-Related Discretionary Fiscal Stimulus Packages
Country 2009-2010 Total (% GDP) 2009-2010 Total ($ bill)
U.S. 3.7% $527.5
China 5.8% $284.7
Japan 5.0% $253.4
Germany 3.6% $120.7
Russia 7. 3% $89.7
Australia 4.6% $45.9
Source: International Monetary Fund, Strategas Research Partners
POLICY SHIFTS DID THEIR JOB
How well did these tools work? Below we take a look at some key measures of
economic health.
n
Global industrial production. Global industrial production has rebounded from
its trough in 2009 (Exhibit 4). The recovery occurred across developed countries,
such as the U.S. and Germany, as well as in emerging markets.
Exhibit 4: Global Industrial Production – Annual Percent Change
Source: Bloomberg
In the United States,
sales, earnings, and
operating margins have
remained strong…
U.S. China Germany India
Jan 07
2500
2000
1500
1000
500
0
-500
-1000
-1500
-2000
-2500
Jul 07
Apr 07
Oct 07
Jan 08
Apr 08
Jul 08
Oct 08
Jan 09
Apr 09
Jul 09
Oct 09
Jan 10
Apr 10
Jul 10
Oct 10
Jan 11
Apr 11
Jul 11
Oct 11
Market Outlook 2012 - 2013
4
Exhibit 5: U.S. Corporate Performance — S&P 500 Index
Peak
June 2007
Trough
March 2009
Now
November 2011
Earnings Per Share $89.84 $49.64 $95.12
Sales Per Share $1,011 $886 $1,021
Trailing P/E 17.6x 10.1x 13.2x
Source: Bloomberg
n
U.S. corporate sector (Exhibit 5). In the United States, sales and earnings have roared back, and are
now higher than the 2007 peak. After two years of substantial progress, some slowdown in corporate
results seems probable in 2012. At the same time, the trailing price/earnings ratio is very reasonable at
13.2x, compared with 17.6x in June 2007, and 10.1x at the trough in 2009.
n
European corporate sector. Through 2010, corporations in Germany, France, UK, and the EU showed
solid profit margins and higher earnings and sales. However, the pace of growth is now clearly slowing,
and both earnings and sales are expected to close 2011 below the levels recorded in the first half. Still,
the numbers are positive.
n
European consumer sector. Consumer spending as a percent of GDP has remained relatively stable in
all four representative regions from 2007 through the third quarter of 2011. This is a healthy sign and a
show of steadiness from a key component of the global economy.
n
U.S. consumer sector. Consumer spending in the United States has held up well through the recession
and recovery at about 70% of GDP (Exhibit 6). Lower mortgage rates sparked a flurry of refinancings,
and lower gasoline prices helped consumers redirect that spending elsewhere. As a result, retail
sales growth is strong at nearly 7%. Credit card delinquencies have also come down as have financial
obligations as a percent of disposable income.
Exhibit 6: U.S. Consumer Performance
PEAK TROUGH NOW
Consumer Spending as % of GDP 70.5% 69.7% 70.8%
Mortgage Rates (30 Year) 6.7% 4.0% 3.9%
Retail Sales Growth 8.9% -11.5% 6.7%
Change in Consumer Credit 5.9% -4.5% 2.4%
Gasoline Price $4.11 $1.61 $3.26
Source: Bloomberg.
Consumer Spending as % of GDP as of 9/30/11, Mortgage Rates as of 12/31/11, Retail Sales Growth as of 12/31/11,
Change in Consumer Credit as of 12/31/11, Gasoline Prices as of 12/26/11.
Market Outlook 2012 - 2013
5
n
Bank lending. One of the most serious effects of the Great Recession was the
tighter lending standards that banks implemented. According to the Senior Loan
Survey (Exhibit 7), in sharp contrast to 2008 and 2009, we now see early signs
of credit standards easing.
Exhibit 7: Senior Loan Survey
Source: Bloomberg
n
Inflation. Although there has been a pickup in some prices since the trough
of the recession, the core inflation rate is nearly a full percentage lower than it
was in June 2007. Key products, including wheat, copper, gasoline, and oil, are
more affordable today than they were four years ago. While lower prices are
good for corporate profits and for the consumer, some pricing pickup is good
too as it indicates demand.
n
The financial markets. From the start of 2009 through 2011, the compound
annualized rate of return for U.S. Stocks (S&P 500) was 14.1%, 10-year U.S.
Treasury bonds was 4.5%, a broad bond index (Barclays Aggregate) was 6.8%,
non-U.S. stocks in developed countries was 8.2% and emerging market stocks
was 20.2%.
However, in 2011, stock returns eased while bond returns stayed positive.
The Dow Jones Industrial Average was up 8.3% while the S&P 500 Index was
up 2.1% for the year.
What’s the hangup?
In a word, debt.
2Q07 4Q07 2Q08 4Q08 2Q09 4Q09 2Q10 4Q10 2Q11 4Q113Q07 1Q08 3Q08 1Q09 3Q09 1Q10 3Q10 1Q11 3Q11
80
70
60
50
40
30
20
10
0
n Tightening
n Easing
Market Outlook 2012 - 2013
6
ARE WE STALLING…OR WORSE?
At this point, there’s mounting evidence that the pickup in growth since 2009 is slowing. Quarterly GDP
growth is barely positive to slightly negative in many regions of the developed world, including the EU,
UK, France, Germany and Spain. Compared with those nations, the United States grew at 1.8% in the
third quarter of 2011 and is expected to grow more than 2.5% in the fourth quarter.
What’s the hangup? In a word, debt. Specifically, accumulated deficits in Greece, Ireland, Italy, Portugal and
Spain (GIIPS) are close to or above 100% of GDP (Exhibit 8). As debt levels rise, so does the risk of default,
which drives the cost of debt (interest rates) higher. It’s a dangerous cycle threatening financial stability in
these countries. In turn, several European banks that lend to these countries are also under pressure.
The markets have responded accordingly, with the European SXXP Financial 50 Index down close to 30%
and the S&P 500 financials sector down 18.4%. Our guess is that once financial stocks show persistent
improvement, it will be a signal that the worst may be behind us.
Exhibit 8: Deficits in GIIPS – General Government Gross Debt, % of GDP
Source: International Monetary Fund
EUROPE: POSITIVE STEPS TAKEN BUT MORE HELP NEEDED
There have been stepped up efforts to stem the slowdown. So far we’ve seen more than
€1 trillion of capital commitments — short of what’s needed but an encouraging series of
actions to help provide liquidity to the region.
These efforts illustrate the global commitment to support Europe and the EU. Importantly,
these steps enjoin not only European countries and related authorities, but also the
International Monetary Fund (IMF), the U.S. Federal Reserve & Treasury, Bank of Japan,
Bank of England, National Bank of Switzerland, the ECB, and others. Structures such as
the Emergency Stability Mechanism (ESM) and the European Financial Stability Facility (EFSF),
low interest multi-year loans to EU banks, dollar liquidity access, and more represent
very much of an all-hands-on-deck approach.
n Tightening
n Easing
160
2011e
Total Debt ($bil):
140
120
100
80
60
40
20
0
Greece
$473
Ireland
$243
Italy
$2,623
Portugal
$214
Spain
$949
% of GDP
n 2000
n 2011e
Market Outlook 2012 - 2013
7
As positive as these steps are, additional work is needed. Today, countries in the
eurozone share a single currency, but each nation has fiscal autonomy. In our view,
fiscal integration among these countries is necessary. That will require changes to
the existing treaties, which might result in a greater range of policy options for the
ECB. In a fiscally integrated Europe, the ECB might feel freer to act, and to consider
additional actions and alternatives.
THE U.S.: HOLDING UP WELL
While economic growth in some European countries appears to be stalling,
the United States is holding up generally well (Exhibit 9). The index of Leading
Economic Indicators (LEI) has been on the rise for eight months in a row and, at
118.0 as of November 30, 2011, it’s now well above the trough level of 97.4 and the
prior cycle peak level of 104.7. Year-over-year growth rates in industrial production
and advance retail sales are solidly on the plus side. Even initial jobless claims are
in better shape now than they have been for some time.
Exhibit 9: 2011 Trend in U.S. Economic Indicators
LEI Index
Industrial
Production (YoY)
Advance Retail
Sales (YoY)
Initial Jobless
Claims (000’s)
12/31/10 112.3 12/31/10 6.74% 12/31/10 7.6% 12/31/10 418
3/31/11 114.3 3/31/11 5.31% 3/31/11 7. 5% 3/31/11 392
4/30/11 114.3 4/30/11 4.51% 4/30/11 7. 2% 4/30/11 478
5/31/11 114.8 5/31/11 3.44% 5/31/11 7.9% 5/31/11 426
6/30/11 115.2 6/30/11 3.46% 6/30/11 8.2% 6/30/11 432
7/31/11 115.8 7/31/11 3.72% 7/31/11 8.5% 7/31/11 402
8/31/11 116.2 8/31/11 3.77% 8/31/11 7. 5% 8/31/11 412
9/30/11 116.4 9/30/11 3.48% 9/30/11 8.1% 9/30/11 405
10/31/11 117.4 10/31/11 4.28% 10/31/11 7. 5% 10/31/11 400
11/30/11 118.0 11/30/11 3.74% 11/30/11 6.7% 12/31/11 381
Source: Bloomberg
Year-over-year growth
rates in industrial
production and advance
retail sales are solidly
on the plus side.
Market Outlook 2012 - 2013
8
WHAT’S NEXT? OUR BEST GUESS IS SLOW GROWTH
In the beginning of 2011, the IMF issued growth forecasts for various regions of the world for 2012.
Together, they resulted in average growth of 4.51%. The EU represents about 20% of world GDP. If you
multiply that by the IMF’s projected growth rate for the EU of 2.08%, the EU would have contributed 0.42%
to GDP in 2012. Although the IMF numbers are no longer a viable forecast, they can provide a framework
for a more plausible outcome.
For example, assume the EU grows at only half the IMF’s projected rate. Its contribution would drop to
0.21% but the combined world growth would still be in excess of 4%. Further, what if growth in all the key
regions of the world came in at half the IMF’s forecasted rate? Under that scenario, the hypothetical world
growth rate would still amount to 2.25% (Exhibit 10, Scenario A). Not great but far from recession territory.
To assume an even worse scenario, what if Europe enters recession and GDP there contracts by -2%, while
growth in the other regions is only moderate? Even in that case, economic growth would remain positive
(Exhibit 10, Scenario B). In our view, slow growth is the likely glide path for 2012.
Exhibit 10: Two Scenarios of Potential GDP Growth in 2012
Hypothetical
Alternative
Scenario A
Major Regions/
Countries
Share of
World*
Projected
2012 Growth
2012
Contribution
What if
50% Redution
EU ($17.4 tril) 20.0% 2.08%
=
0.42% 0.21%
U.S. ($15.2 tril) 19.4% 2.87%
=
0.56% 0.28%
EM ($20.0 tril) 40.0% 6.15%
=
2.50% 1.25%
Japan ($5.8 tril) 5.7% 2.07%
=
0.12% 0.06%
World ($68.6 tril) 100.0% 4.51%
=
4.51% 2.25%
Hypothetical
Alternative
Scenario B
Hypothetical
Alternative
Scenario B
Major Regions/
Countries
Share of
World*
Projected
2012 Growth
2012
Contribution
EU ($17.4 tril) 20.0% -2.00%
=
-0.40%
U.S. ($15.2 tril) 19.4% 2.00%
=
0.40%
EM ($20.0 tril) 40.0% 5.00%
=
2.00%
Japan ($5.8 tril) 5.7% 1.00%
=
0.06%
85.1%
of World Total
2.06%
Source: International Monetary Fund
* Based on Purchasing Power Parity (PPP) weight.
Past performance shown is not a guarantee of future results. Information is subject to change.
We do not undertake to advise the reader as to changes of our views in the future.
Market Outlook 2012 - 2013
9
IMPLICATIONS FOR THE FINANCIAL MARKETS
What does slow growth imply for the financial markets? Again, the past can
offer us important context (Exhibit 11). From 1970 through June 2011, there have
been 166 total quarters. Of those, 40 were marked by slow economic growth of
2.5% or less. During those slow-growth quarters, the average return from the
S&P 500 Index was 3.2%. Of the 40 quarters, the S&P return was positive in 31 of
them, with an average return of 6.3%. Only nine quarters were negative, and the
average return for those was -7.5%.
Recessions are a different story. The economy has contracted during six periods
from 1970 through 2010. The average decline for the S&P 500, from peak to trough,
was 34.3%. That compares with an 11% gain from 7- to 10-year U.S. Treasury bonds.
Clearly, the markets draw a big distinction between slow growth and recession.
Exhibit 11: Summary of Slow Growth (0-2.5%)
Total Quarters (1970-6/30/11) 166
# Strong Growth (>2.5%) 96
# Recession 30
# Slow Growth 40
Average Return in Slow Growth 3.2%
# Qtrs Positive S&P Perf. 31
Average Positive Return 6.3%
#Qtrs Negative S&P Perf. 9
Average Negative Return -7. 5%
Source: Bloomberg
Past performance shown is not a guarantee of future results. Information is subject to change.
Even in this slow-growth environment, we see upside potential in U.S. equities.
Final 2011 full-year profits for the S&P 500 are not yet tallied. As of December 31,
2011, the S&P 500 stood at 1258, and estimated 2011 earnings per share for S&P
500 companies was $95. In Exhibit 12 we illustrate two hypothetical S&P return
scenarios. Scenario A uses the consensus earnings growth estimate from Bloom-
berg for 2012 of 10%. That would take earnings from $95/share to roughly $105/
share. We then multiply the $105 by the current (2011) price paid per dollar of
profit (P/E ratio) for stocks in the S&P 500, which is approximately 13. The result
($105 x 13) is 1359. This illustrates one possible 2012 year-end value for the S&P.
Scenario B assumes the same growth rate but increases the P/E ratio to 14.
These are not predictions but rather a means by which to frame expectations.
The past can offer us
important context.
Clearly, the markets draw
a big distinction between
slow growth and recession.
Market Outlook 2012 - 2013
10
Exhibit 12: S&P 500 Index — 2012 Hypothetical Return Calculations
Scenario A Scenario B
Consensus* EPS for 2012: $105 $105
Current P/E for 2011: x 13x x 14x
Est. 2012 Year-End Level: 1,359 1,463
2011 Year-End Level: - 1,258 - 1,258
Est. 2012 Level Increase: 101 205
Est. 2012 Gain: 7% 14%
* Bloomberg Consensus estimates.
Source: Bloomberg, data estimates as of 12/31/11.
The assumptions provided are prepared solely for informational purposes, and are not a guarantee of future results. Information is subject to
change. We do not undertake to advise the reader as to changes of our views in the future. Please see disclosure for additional information.
HOW TO INVEST IN A SLOW GROWTH WORLD
As in most economic environments, there will continue to be opportunities for investors in 2012. In our view,
investors can position their portfolios in these ways:
n
Emphasize larger U.S. companies. These are more defensive in nature, have cheaper valuations, a global
footprint and higher dividends — in many cases, higher yields than on 10-year Treasury bonds.
n
Keep some exposure to mid- and small-sized companies. Earnings and sales results have been strong here
and prices pulled back in 2011.
n
Pay careful attention to the financial sector in Europe and selectively in the U.S.
n
Stay neutral to slightly positive on emerging markets. Interest rates are coming down in several countries
and growth remains decent. As in 2011, country weights will be important.
n
Limit direct exposure to Europe. We believe recession in Europe is likely in 2012.
n
Consider varied sources of fixed income. This might include U.S. corporate investment grade securities,
U.S. corporate high yield, and emerging market corporate and selected sovereign debt.
n
Limit exposure to TIPS and floating rate bonds. If inflation stays in check there is less reason
to own inflation-protected instruments.
n
Explore carefully selected alternative investments including real estate investments
and master limited partnerships as income generators; and commodities.
Though challenges clearly remain, many of the world’s economies, particularly the U.S.,
are in better shape today than they were in 2009. The action steps implemented thus far have
produced beneficial results, and both U.S. businesses and consumers are holding up well,
generally. To be sure, the European debt crisis is a serious issue with worldwide implications.
Nevertheless, we believe investors can navigate in this environment by taking a balanced
approach focused on larger companies, select emerging markets, varied fixed income,
and certain income-generating alternative investments.
Contributors
BMO Asset Management U.S.
Tommy O. Huie, CFA
President & Chief Investment Officer
Sandy A. Lincoln
Managing Director, Chief Market Strategist
Daniel L. Sido
Managing Director, Chief Investment Strategist
FOR MORE INFORMATION ON
Separate Accounts
Mutual Funds
Collective Investment Trusts
Pooled Funds
UCITS
Alternative Investments
CONTACT
BMO Global Asset Management
115 S. LaSalle Street, 11th Floor
Chicago, IL 60603
1-800-553-0332
bmogamus.com
bmofundsus.com
The statements contained herein may include
statements of future expectations and other
forward-looking statements that are based on
management’s current views and assumptions
and involve known and unknown risks and
uncertainties that could cause actual results,
performance or events to differ materially from
those expressed or implied in such statements.
In addition to statements which are forward-
looking by reason of context, the words
“may”, “will”, “should”, “expects”, “plans”,
“intends”, “anticipates”, “believes”, “estimates”,
“predicts”, “potential”, or “continue” and
similar expressions identify forward-looking
statements. Actual results, performance or
events may differ materially from those in
such statements due to, without limitation, (i)
general economic conditions, (ii) performance of
nancial markets, including emerging markets,
and including market volatility, liquidity and
credit events (iii) the frequency and severity of
loss events, including from natural catastrophes,
(iv) the extent of credit defaults (v), interest rate
levels (vi) currency exchange rates including
the Euro/U.S. Dollar exchange rate changes
in laws and regulations, including monetary
convergence and the European Monetary
Union, (vii) changes in the policies of central
banks and/or foreign governments, and (viii)
general competitive factors, in each case on a
local, regional, national and/or global basis. The
company assumes no obligation to update any
forward-looking statement.
This is not intended to serve as a complete
analysis of every material fact regarding any
company, industry or security. The opinions
expressed here reect our judgment at this
date and are subject to change. Information
has been obtained from sources we consider
to be reliable, but we cannot guarantee the
accuracy. This publication is prepared for
general information only. This material does not
constitute investment advice and is not intended
as an endorsement of any specic investment. It
does not have regard to the specic investment
objectives, nancial situation and the particular
needs of any specic person who may receive
this report. Investors should seek advice
regarding the appropriateness of investing in
any securities or investment strategies discussed
or recommended in this report and should
understand that statements regarding future
prospects may not be realized. Investment
involves risk. Market conditions and trends will
uctuate. The value of an investment, as well as
income associated with investments, may rise or
fall. Accordingly, investors may receive back less
than originally invested. Investments cannot
be made in an index. Past performance is not
necessarily a guide to future performance.
© 2012 BMO Financial Corp.
BMO Global Asset Management comprises BMO Asset Management U.S., BMO Asset Management Canada, and BMO’s
specialized investment boutiques: HIM Monegy, Inc.®, Pyrford International Ltd, Lloyd George Management (BVI) Ltd,
and Taplin, Canida & Habacht, LLC. BMO Asset Management U.S. consists of Harris Investment Management, Inc. and
M&I Investment Management Corp., and BMO Asset Management Canada consists of BMO Asset Management Inc.
(formerly Jones Heward Investment Counsel Inc.). BMO Global Asset Management is part of the BMO Financial Group,
a service mark of Bank of Montreal (BMO).
Certain companies within BMO Global Asset Management offer a number of products and services designed specically
for various categories of investors in a number of different countries and regions. These products or services are only
offered to such investors in those countries and regions in accordance with applicable laws and regulations.
Investment products are: Not FDIC Insured | No Bank Guarantee | May Lose Value