First 5 CaliFornia 2010–2011 annual report pptx
Bạn đang xem bản rút gọn của tài liệu. Xem và tải ngay bản đầy đủ của tài liệu tại đây (7.33 MB, 44 trang )
investing
in the
future
First 5 CaliFornia
2010
–
2011
annual report
First 5 CaliFornia
i
2010-2011
annual report
ii
health
education
services
support
First 5 CaliFornia 2010–2011 annual report
investing
in the
future:
First 5 California touches the lives of millions of children and their families every year.
This 2010–2011 Annual Report tells that story with both a state and local community voice.
Children change rapidly in their earliest years
—
they seem to grow almost overnight. Their
brains
—
in particular
—
expand at an astonishing rate. In fact, research shows that 90 percent
of a child’s brain develops during the first five years.
Nurturing and protecting children at this critical developmental stage is the focus of First 5
California. By investing in cutting-edge statewide services and support, we work to ensure that
more California young children are born healthy and can reach their full potential.
Along with the First 5 county commissions and numerous other partners, First 5 California offers
innovative programs and services designed to help young children thrive and succeed in school
and life. This early learning community has worked for a long time to create an integrated,
high-quality early learning system. Since the passage of Proposition 10 in 1998, First 5 California
has been a
partner in creating this sustainable system for future generations.
As noted in this report, First 5 California currently is developing and implementing quality
programs and resources that target three primary audiences:
the Child, the Parent, and the Teacher
in the focus areas of nutrition, early literacy and language development, and smoking cessation.
Public education and outreach efforts on these subjects deliver research-based messages to
hard-to-reach and low-income populations. Focus groups have shown that First 5 California remains
a trusted source for parents, and we strive to deliver quality information to parents and other
caregivers in the best interest of their children.
Recently, First 5 California completed the goals of its five-year strategic plan, which relied heavily
on leadership and investments to create evidence-based programs that result in quality. The strategic
plan created a powerful blueprint for First 5 California programs and supportive services, many of
which are fully detailed in this Annual Report—
our Child, Parent, and Teacher Signature Programs.
While much has been accomplished, more work is ahead. The early learning community
—
including
First 5 California—is more aligned than ever in our commitment to ensure young children succeed
in early learning settings, kindergarten, and beyond.
Kris Perry
Executive Director
Message FroM the exeCutive DireCtor
Recent advances in brain research
have provided great insight into
how the brain . . . continues to
grow and develop after birth.
. . . Scientists now believe that
[growth] is highly dependent
upon the child’s experiences.
1
“
”
First 5 CaliFornia
i
2010-2011
annual report
2
an
d
communities
empowering families
table of contents
California’s Young Children Ready to Learn
Leadership: First 5 California
Structure: State and County
Accountability: Funding and Audit Results
Partnerships: Working Together
Serving California’s Young Children, Parents, and Teachers
Child. . . . . . . . . . . . . . . . . . . . . . . . . . . . . . . . . . . . . . . . . . . . . . . . . . . . . . . . . . . . . . . . . .
Child Development Focus
Power of Preschool
Educare
School Readiness
Matching Fund Programs
Child Health Focus
Smoking Cessation
Parent
Family Functioning Focus
Kit for New Parents
Parent Education Website
Teacher
CARES Plus
Appendix A: First 5 California Result Areas and Services
Acknowledgements
References
California State Controller’s Annual Report on Disk
7
7
7
8
9
10
12
12
12
18
20
21
25
29
30
30
30
34
31
40
38
40
41
34
First 5 CaliFornia
i
2010-2011
annual report
4
list of FY 2010/11 exhibits
Exhibit 1:
First 5 California Commission Members FY 10/11
Exhibit 2:
First 5 California Children and Families Commission Funds
–
Allocation of State Portion
Exhibit 3:
Total Number of Services Provided to Children Ages 0 to 5 and Adults
in FY 10/11 Across Result Areas
Exhibit 4:
Total Expenditures for Children Ages 0 to 5 and Adults Receiving Services
in FY 10/11 by Result Area
Exhibit 5:
Total Expenditures for Children Ages 0 to 5 and Adults Receiving Services
in FY 10/11 by Provider
Exhibit 6:
Child Development
–
Total Number of Services Provided to Children Ages 0 to 5
in FY 10/11 by Service
Exhibit 7:
Power of Preschool
–
Integrating Level Changes in FY 10/11
Exhibit 8:
Child Development
–
Distribution of Expenditures for Children Ages
0 to 5 and Adults in FY 10/11 by Service
Exhibit 9:
Child Development
–
Distribution of Expenditures for Children Ages 0 to 5 and
Adults in FY 10/11 by Provider
Exhibit
10:
Child Health
–
Total Number of Services that Benefitted Children Ages
0 to 5 in FY 10/11 by Service
Exhibit
11:
California Smokers’ Helpline
–
Education Level of Callers in FY 10/
11
Exhibit
12:
California Smokers’ Helpline
–
Race/Ethnicity of Callers in FY 10/11
Exhibit
13:
Child Health
–
Distribution of Expenditures for Children Ages 0 to 5 and Adults
in FY 10/11 by Service
Exhibit
14:
Child Health
–
Distribution of Expenditures for Children Ages 0 to 5 and Adults
in FY 10/11 by Provider
Exhibit
15:
Family Functioning
–
Total Number of Services Provided to Adults in FY 10/11 by Service
Exhibit
16:
Family Functioning
–
Distribution of Expenditures for Children Ages
0 to 5 and Adults in FY 10/11 by Service
Exhibit
17:
Family Functioning
–
Distribution of Expenditures for Children Ages
0 to 5 and Adults in FY 10/11 by Provider
10
11
11
12
13
20
21
25
28
28
29
7
29
8
30
31
31
providing
support
5
Child
development
First 5 CaliFornia
i
2010-2011
annual report
6
g
ui
d
a
n
ce
an
d
support
7
leaDership: First 5 CaliFornia
With the passage of Proposition
10
—
the
California Children and Families Act
—
in 1998,
seeds for a better future for California’s
youngest children were firmly planted. For the
past 13 years, the First 5 California Children
and Families Commission (First 5 California)
has established quality standards and invested
in the development of programs and services
emphasizing improvement in early education,
child care, social services, health care, research,
and community awareness.
struCture: state anD County
First 5 California was created to promote and
support early childhood development for children
ages 0 to 5 within the provisions contained in the
California Children and Families Act (the Act).
The Act authorized the establishment of 58
First 5 county commissions and required that
each develop and update a local strategic plan
based on the assessed needs in the county.
First 5 California prepares guidelines to assist
the county commissions in the update and
execution of their plans.
State leadership is provided by a seven-member
Commission appointed by the California
Legislature and Governor, with the Secretary
of the California Health and Human Services
Agency serving as an ex-officio member. The
Commission hires the First 5 California Executive
Director; Kris Perry has served in this capacity
since July 2005.
California’s Young Children
Ready to Learn
— First 5 California
Guiding Principle
publiC support: Build a foundation
of support for a comprehensive,
integrated, and holistic early
childhood development system.
EXHIBIT 1: First 5 California
Commission Members FY 10/11
CoMMission MeMbers:
Jennifer Kent
Chair
Appointed by Governor
Molly Munger
Vice Chair
Appointed by Speaker of the Assembly
Maria Minon, M.D.
Appointed by Governor
Conway Collis
Appointed by Speaker of the Assembly
Patrick Duterte
Appointed by Governor
Casey McKeever
Appointed by Senate Rules Committee
Joyce Iseri
Appointed by Senate Rules Committee
ex-oFFiCio MeMber:
Diana Dooley
Secretary of the California Health and
Human Services Agency
First 5 CaliFornia
i
2010-2011
annual report
8
First 5 county commission members are
appointed by the county board of supervisors.
Each county commission includes two members
selected from county health and local
health-related service agencies, as well as
one member of the appointing county board
of supervisors.
2
Members also can be selected
from other child development organizations
within the county.
aCCountability: FunDing
anD auDit results
Under the Act, the State Board of Equalization
collects an excise tax levied on all tobacco
products and deposits the revenue into the
California Children and Families Trust Fund,
allocating 20 percent to First 5 California
and 80 percent to county commissions. In
Fiscal Year (FY) 2010/11, First 5 California
received $94 million.
The amount of money allocated annually
to each county commission is based on the
number of births in the county relative to
the total number in the state for the year.
First 5 county commissions use their funds to
support local programs in four result areas:
• Child Development
• Child Health
• Family Functioning
• Systems of Care
The California Department of Finance, Office
of State Audits and Evaluations, conducted an
audit of the First 5 California financial records for
FY 2010/11. Submitted in November 2011, this
report on the California Children and Families
Trust Fund was free of any negative findings.
First 5 California’s Administrative Services
Division, Contract and Procurement Division, and
the Information Technology Office provide staff
support for the following operations and systems:
• Fiscal management of the California Children
and Families Trust Fund
• Tax revenue disbursements to county
commissions
• Local agreement and program disbursement
management
EXHIBIT 2:
First 5 California Children and Families
Commission Funds
–
Allocation of State Portion
results
Administration 1%
First 5 County
Commissions 80%
First 5 California State Commission 20%
Research and
Development 3%
Education 5%
Communications/
Mass Media 6%
Unallocated 2%
Child Care 3%
Source: Health and Safety Code Section 130105
9
• Procurement and contract management
• Workforce recruitment and development
• Information technology
• Audits and annual fiscal reports
• Business services
The administration of these and other programs
is consistent with all applicable state and
federal laws, rules, and regulations.
During FY 2010/11, First 5 California contributed
$81.4 million to the Managed Risk Medical
Insurance Board, addressing a gap in funding
for the Healthy Families Program and averting
the establishment of a children’s health coverage
applicant waiting list. The funds were used
to ensure health care services for more than
200,000 children ages 0 to 5 through June 2011.
Recognizing the importance of early
intervention programs, First 5 California also
provided $50 million in FY 2010/11 to support
regional center services provided to children
ages 0 to 5 in the Early Start Program
administered by the California Department
of Developmental Services.
partnerships: Working
together
The First 5 California Commission works
with First 5 county commissions to further
the goals of the Act. Partnerships focus
on research design; implementation of
Signature Programs for Child, Parent, and
Teacher; data collection and evaluation for
Signature Programs; and continuous program
improvement. First 5 California provides
technical assistance to First 5 county
commissions in the areas of data collection,
program implementation, and outreach.
— First 5 California
Guiding Principle
partnerships anD leveraging:
Promote collaboration with
public and private partners,
building on existing systems.
outreach
First 5 CaliFornia
i
2010-2011
annual report
10
First 5 California tracks progress in four key
result areas to support evidence-based funding
decisions, program planning, and policies:
• Child Development
• Child Health
• Family Functioning
• Systems of Care
These result areas comprise a framework
for reporting and assessing early childhood
outcome data. Appendix A includes a complete
description of the First 5 California result areas
and services. This data reporting framework
provides a statewide overview of number, type,
and costs of services provided to children and
adults for a particular fiscal year.
Stakeholders can use this information as one
source to determine First 5 impact and resource
allocation. Exhibit 3 contains the total number
of services provided to children ages 0 to 5
and adults in FY 2010/11 for the three result
areas of Child Development, Child Health, and
Family Functioning.
The total expenditures for children ages 0 to
5 and adults receiving services in FY 2010/11
by result areas and providers are presented in
Exhibits 4 and 5, respectively.
Serving California’s Young Children,
Parents, and Teachers
— First 5 California
Guiding Principle
Quality stanDarDs: Incorporate
the highest quality, evidence-
based standards when assessing
program effectiveness.
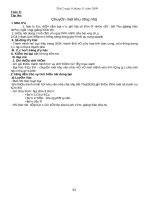
EXHIBIT 3: Total Number of Services Provided to Children
Ages 0 to 5 and Adults in FY 10/11 Across Result Areas
One result area, Systems of Care, differs
from the others. It consists of programs and
initiatives that support program providers in
the other three result areas. In FY 2010/11,
22 percent of expenditures went toward
community strengthening efforts; 32 percent
toward service, outreach, planning, support, and
management; and 46 percent toward provider
capacity building, training, and support.
Family
Functioning
Child
Development
Child
Health
Children Adults
494,854
234,224
294,697
285,751
411,490
355,569
Source: County Demographic Worksheet, November 2011
11
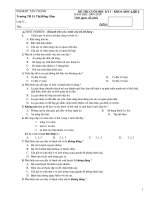
EXHIBIT 4: Total Expenditures for Children Ages 0 to 5 and
Adults Receiving Services in FY 10/11 by Result Area*
EXHIBIT 5: Total Expenditures for Children Ages 0 to 5
and Adults Receiving Services in FY 10/11 by Provider*
County Government
10%
Elementary Schools 16%
Community
Agencies
49%
First 5 County
Commissions 5%
Private 6%
Other Government
4%
Educational
Institutions 10%
Family
Functioning
22%
Child Health 26%
Child
Development
52%
*
The percentages in this chart may not add to 100 due to rounding.
Source: County Revenue and Expenditure Summary, November 2011
Photo courtesy of First 5 Humboldt.
First 5 CaliFornia
i
2010-2011
annual report
12
ChilD DevelopMent FoCus
Large developmental disparities exist among children
ages 0 to 5 across California. Such an early readiness
gap threatens later learning, development, and
health. Programs that support disadvantaged
children
make it possible to overcome socioeconomic barriers
that limit opportunities for success.
First 5 California and county commissions actively
promote screening and assessment that help
identify critical issues in children with special
needs. When identified and addressed early, these
issues will not delay children’s chances for success
in school and beyond. Descriptions of the eight
services within the Child Development result area
can be found in Appendix A. The number of child
development services provided to children by
service in FY 2010/11 can be found in Exhibit 6.
poWer oF presChool
National research indicates that high-quality
preschool has a significant and positive impact on
early childhood outcomes, including cognitive,
language, and social development.
3
This is partic
u-
larly true for at-risk children. Approximately 50
percent of California’s 3- and 4-year-old children
do not attend preschool, and even fewer attend
high-quality preschool.
4
High-quality preschools
go beyond the basics to provide opportunities
for evidence-based learning activities, along with
the development of nurturing and supportive
relationships with teachers and caregivers.
Scientific studies conclude that high-quality
preschool programs improve school readiness
and lead to better academic achievement in
elementary school. In addition, a fiscal analysis of
return on investment indicates that high-quality
preschool generates approximately $7 for every
dollar invested, ultimately resulting in significant
savings on welfare, education, and criminal justice.
5
First 5 California’s Power of Preschool (PoP)
program is a high-quality, free, voluntary, part-
day preschool for 0 to 5 year olds, across eight
Child
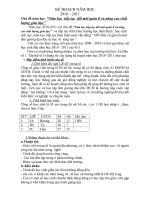
EXHIBIT 6: Child Development
–
Total Number of Services
Provided to Children Ages 0 to 5 in FY 10/11 by Service
51,335
8,706
15,941
22,884
3,727
30,535
11,093
110,
864
39,612
State School
Readiness
Preschool
Ages 3 to 4
County School
Readiness
Comprehensive
Screening
Special
Needs
Intervention
Early Education
Provider
Education
Kindergarten
Transition
Other Services
Number of Services
— First 5 California
Guiding Principle
ChilD CentereD: Focus all
programs and activities on the
needs of California’s children.
Source: County Demographic Worksheet, November 2011
13
California counties. These counties include Los
Angeles, Merced, San Diego, San Francisco, San
Joaquin, Santa Clara, Ventura, and Yolo. PoP actively
reduces the achievement gap and improves school
readiness among disadvantaged and underserved
communities. Between 2005 and 2010, First 5
California invested $109 million in PoP demonstration
programs. Page 21 lists counties with PoP and other
First 5 California Matching Fund Programs.
Data from all PoP sites in FY 2010/11 indicate that:
• Preschools are high quality: classroom
environmental assessments rate an average of
5.4 out of a possible score of 7. (Five of the
eight PoP counties reported this average score.)
• Teachers are well qualified: nearly 58% are
Master Teachers with bachelor’s or higher
degrees in early childhood education.
EXHIBIT 7: Power of Preschool
–
Integrating Level
Changes in FY 10/11
Number of PoP Children
Beginning of Year
Number of PoP Children
End of Year
915
7,919
292
3,574
351
1,949
154
1,381
Effective Learning
Personal and Social
Competence
Physical and Motor
Competence
Safe and Healthy
Power of Preschool actively
reduces the achievement gap
and improves school readiness
among disadvantaged and
underserved communities.
power of
preschool
Source: Power of Preschool Evaluation Questions and Data
Collection Form, November 2011
PoP requires participating counties to use the
Desired Results Developmental Profile 2010 (DRDP
2010), a comprehensive assessment tool, to evaluate
enrollees’ progress. In FY 2010/11, PoP counties
submitted DRDP data for children who had both fall
and spring assessments (10,514 of 25,246 children).
Children progress through five DRDP developmental
levels, from lowest (Not Yet at First Level) to highest
(Integrating). As depicted in Exhibit 7, pre- and
post-program assessment data reflect the percentage
increase at the Integrating developmental level for
each Child Desired Result area:
• 765% for the measure Personal and
Social Competence
• 1124% for the measure Effective Learning
• 455% for the measure Physical and
Motor Competence
• 794% for the measure Safe and Healthy
PoP assists thousands of children to become
competent and effective learners. An analysis
of available PoP data reveals that PoP counties
register strong school readiness levels and high-
quality learning
environments. The following stories
reflect two counties with compelling results
within
their PoP programs.
First 5 CaliFornia
i
2010-2011
annual report
14
presChool For all:
loCal-state partnership
San Francisco’s Preschool for All is a free,
half-day preschool for all 4 year olds in San
Francisco. First 5 San Francisco manages
this state-, county-, and city-funded
program. The purpose of Preschool for
All is to provide high-quality preschool
education to pre-kindergarten children.
San Francisco’s Preschool for All is unique
in that it is the only countywide program
in California to offer preschool universally
to all 4-year-old residents.
6
San Francisco
also utilizes a mixed delivery system, with
preschool programs operated by the San
Francisco Unified School District, Head Start,
private nonprofit providers, corporate child
care, and family child care homes.
In San Francisco, preschool attendance
among 4-year-old children increased from
72 percent in 2007 to 83 percent in 2009,
and this increase is due, in part, to First
5 San Francisco’s investment in preschool
facilities. Maximizing preschool attendance
through multiple providers is important;
preschool attendance is correlated with
improved kindergarten readiness, and
kindergarten readiness is associated with
long-term achievement.
7
In addition to many other agencies,
Preschool for All works alongside the
county’s separately funded early care and
education programs. This collaboration
enables efficiency in teaching, nurturing,
and preparing children for the future.
First 5 California’s Power of
Preschool
(PoP)
program partners
with local commissions
to leverage resources for
quality preschools.
power of
q
ualit
y
pr
e
s
chools
voiCe FroM a loCal CoMMunity: First 5 san FranCisCo
15
Preschool for All welcomes children of
all income levels, needs, and cultural
backgrounds.
Currently, there are 121
8
preschools
participating in Preschool for All, all of
which provide quality education; are
licensed and insured; follow employment
regulations; demonstrate financial
responsibility; and employ qualified
teachers. In 2010/11, 2,870 4-year-old
children were served in San Francisco.
9
Preschool for All supports the professional
development of its teachers by funding
enhanced teacher training and increased
compensation. In 2008, 178 Preschool for
All teachers and assistants participated in
the Comprehensive Approaches to Raising
Educational Standards (CARES) program
to enhance professional development and
educational attainment.
According to an evaluation report on
San Francisco’s Preschool for All program
conducted by the American Institutes
for Research in 2010, teacher-child
interactions are typically warm and
emotionally supportive, with effective
behavior and instructional management
strategies that enhance children’s
learning. Findings further indicate that
Preschool for All teachers received
high scores for incorporating the life
experiences and cultural backgrounds
of children who are English learners.
10
Preschool attendance is
correlated with improved
kindergarten readiness, and
kindergarten readiness is
associated with long-term
achievement.
Photo courtesy of First 5 San Francisco.
First 5 CaliFornia
i
2010-2011
annual report
16
Quality presChools
In FY 2010/11, San Joaquin County preschool
programs enrolled 864 children. First 5
San Joaquin supports quality preschool
education through programs administered
by the Charterhouse Center for Families;
Child Abuse Prevention Council; and Tracy,
Lodi, Manteca, Stockton, and Lincoln Unified
School Districts. Literacy and language
development are important focus areas of
these programs. Highlighted below are a
few examples:
• The “Building Literacy Together” program
at the Tracy Unified School District
provides free preschool services, health
insurance and developmental screenings,
and a two-week kindergarten bridge
program. “Parenting for Academic
Success” is offered to parents during the
school year in Spanish and English.
• The “Rock, Roll, and Read” program in
the Lodi Unified School District improves
movement, music, and literacy skills of
toddlers and preschoolers.
• At the Manteca Unified School District,
activities include collaboration with
the UC Davis Co-op Extension nutrition
program, “Raising a Reader” program,
monthly book time with the kindergarten
teacher, and family involvement in the
parent-teacher club.
First 5 California’s Power of
Preschool
(
PoP
)
program
assists thousands of California
children in eight counties to
become effective learners.
learn,
g
row,
d
evelop
voiCe FroM a loCal CoMMunity: First 5 san JoaQuin
17
• Stockton Unified School District
promotes various family literacy events.
Presentations of the “Families Reading
Together” program at the Stockton/San
Joaquin Public Library inform parents of
the importance of reading to children
daily, while modeling appropriate reading
techniques for parents.
•
Lincoln Unified School District promotes
a variety of kindergarten transition
activities for preschool children to
make them better prepared to enter
kindergarten.
To ensure that preschool-aged children
receive a quality education, First 5 San
Joaquin requires preschool teachers to
use an approved curriculum. All staff must
have a child development permit. Both
teacher-to-child ratios and teacher/staff
credentialing requirements are carefully
monitored. The number of teachers
earning a bachelor’s degree increased by
19 percent. Those earning a master’s or
doctorate degree increased by 3 percent
between 2007 and 2009. By the spring
of 2009, the percentage of teachers with
a child development program director
permit had increased from 6 to 20 percent,
reflecting the positive effect of workforce
development support.
11
High-quality preschool has a
significant and positive impact
on childhood outcomes…
California’s First 5 preschool
programs are improving the
lives of California’s young
children and preparing them
for tomorrow’s challenges.
First 5 CaliFornia
i
2010-2011
annual report
18
research-
b
ase
d
eDuCare
Children in low-income families typically enter
kindergarten 12 to 14 months behind the national
average in pre-reading and language skills. California
is ranked 30th in the nation for the percentage
of children in poverty.
12
According to the National
Center for Children in Poverty, 43 percent of children
lived in low-income families, defined as an income
below 200 percent of the federal poverty level, in
2009. Economically disadvantaged children often
grow up in environments lacking in cognitive,
social, and emotional stimulation and support.
The Educare model was first established in 2000.
Currently, there are 13 Educare centers in 10 states.
Educare promotes school readiness by implementing
programs that reduce the achievement gap in
children ages 0 to 5. Educare targets disadvantaged
children and their families, including children from
low socioeconomic backgrounds who are less likely
to attend high-quality preschool programs.
The Educare approach for early education is
comprehensive and research-based. First 5 California
is part of a public-private partnership that
has committed to establishing California’s first
Educare center in Silicon Valley, followed by
a second site being developed in Los Angeles.
publiC-private partnership
In April 2010, First 5 California approved an
innovative public-private partnership that
established the state’s first Educare in Santa
Clara County. Educare of California @ Silicon
Valley (ECSV) is comprised of national and
local philanthropists, foundations, public
entities, business leaders, community-based
organizations, public policy makers, Santa
Clara County Office of Education Head Start
and Early Head Start, State Preschool, East
Side Union High School District CALSAFE,
WestEd E3 Institute, and Franklin-McKinley
School District.
— First 5 California
Guiding Principle
Diversity: Ensure that families
from all of California’s diverse
populations connect to services
needed to succeed.
voiCe FroM a loCal CoMMunity:
First 5 santa Clara County
19
The architects of ECSV understand that parents
are key to early child development. Program
features are designed to develop and strengthen
the abilities of parents to support their child’s
learning when they enter school. Family support
services are provided by full-time social workers
and other community-based family service
consultants.
ECSV is a collaborative effort with governance
and oversight of First 5 Santa Clara County,
Santa Clara County Office of Education, Franklin-
McKinley School District, the Silicon Valley
Leadership Group, First 5 California, Packard
Foundation, Catholic Charities, East Side Union
High School District, and the national Bounce
Learning Network.
Currently, a 34,000-square-foot, state-of-
the-art facility is being constructed in the
Santee neighborhood of San Jose within the
Franklin-McKinley School District, adjacent
to the Santee Elementary School. The school
district has 75 percent of its students as English
learners and 90 percent as qualified for free or
reduced lunch. The Santee neighborhood is an
impoverished community with Santee Elementary
School performing in the bottom 20 percent of
all schools statewide.
13
Scheduled to be fully operational in fall 2014,
ECSV will serve approximately 200 children,
infants through 5 years of age, of low wage-
earning families; teen parents and parents in
job training are a priority to serve. The facility
will include classrooms, classroom observation
rooms, and spaces for community gatherings.
The Family Resource Center will include housing,
immigration, counseling, employment assistance,
nutrition assistance, health services, community
gardens, family-engagement educational
opportunities, in-home support services, early
literacy, Triple P Positive Parenting and Abiendo
Puertas parent engagement support.
ECSV will leverage current evidence-based First
5 California programs, including Comprehensive
Approaches to Raising Educational Standards
(CARES) Plus and Power of Preschool (PoP), to
implement a professional development institute
for early educators, which will include training,
coaching, reflective practice, and mentoring.
The Educare arch, placed at each of
its centers, symbolizes the nationwide
effort to build quality preschools.
early
l
ear
ning
Photo and artwork courtesy of Ounce of Prevention.
First 5 CaliFornia
i
2010-2011
annual report
20
sChool reaDiness
With a focus on low-performing schools,
First 5 California’s School Readiness program
aims to improve the ability of families,
schools, and communities to prepare children
to enter school ready to learn. School
Readiness programs target early learning and
kindergarten transition; parenting education
and family strengthening; health screenings
and treatment; and communication between
early care settings and elementary schools.
Typically, parents are expected to be highly
involved in School Readiness programs,
as parents are regarded as a child’s most
important teacher.
School readiness encompasses the cognitive,
social, physical, emotional, and supportive
elements internal and external to a child
that facilitate that child’s ability to enter
kindergarten ready to learn. Equally important
are the child’s basic literacy and math skills,
as it has been demonstrated that children who
enter school with basic knowledge of math
and language skills are more likely to
experience academic success, attain higher
levels of education, and obtain employment.
Kindergartners who enter school without these
skills are likely to remain behind as they move
through the education system, making it
imperative that school readiness and achieve-
ment gaps are addressed as early as possible.
First 5 California Matching Fund Programs,
on page 21, contain the number of School
Readiness programs per county. Featured on
pages 22–24 are counties with compelling
developments and results within their School
Readiness programs.
The distribution of child development-related
expenditures for children ages 0 to 5 and adults
in FY 2010/11 by services and providers can be
found in Exhibits 8 and 9, respectively.
power of
EXHIBIT 8: Child Development
–
Distribution of
Expenditures for Children Ages 0 to 5 and Adults
in FY 10/11 by Service
school
readiness
Kindergartners who enter school
without readiness skills are likely
to remain behind as they move
through the education system.
Early Education 7%
State School
Readiness 30%
Preschool Ages 3 to 4
32%
Special Needs Intervention 1%
Comprehensive
Screening 5%
Other Services 3%
Provider Education
19%
County School Readiness 2%
Kindergarten Transition 1%
The percentages in this chart may not add to 100 due to rounding.
Source: County Revenue and Expenditure Summary, November 2011
21
SAN
FRANCISCO
NORTE
HUMBOLDT
LASSEN
MODOC
SHASTA
SISKIYOU
TRINITY
DEL
COLUSA
GLENN
MENDOCINO
TEHAMA
ALPINE
AMADOR
CALAVERAS
EL DORADO
PLACER
SACRAMENTO
SIERRA
SUTTER
TUOLUMNE
YUBA
BUTTE
NEVADA
CONTRA COSTA
SOLANO
SONOMA
NAPA
YOLO
MARIN
ALAMEDA
SAN
JOAQUIN
SAN
MATEO
SANTA
CLARA
STANISLAUS
LAKE
FRESNO
KINGS
MADERA
MARIPOSA
MERCED
MONO
MONTEREY
SAN
BENITO
SANTA
CRUZ
INYO
KERN
ORANGE
SAN LUIS
OBISPO
TULARE
IMPERIAL
RIVERSIDE
SAN BERNARDINO
SAN DIEGO
PLUMAS
SANTA
BARBARA
VENTURA
LOS ANGELES
Number of School Readiness Programs
2006–2010
❊
Power of Preschool Demonstration Programs
CARES
Plus Programs
Educare
11
–
14
6
–
10
2
–
51 15+
❊
Number of programs does not equate to number of sites.
First 5 CaliFornia
MatChing FunD prograMs
partnerships
The First 5 California Commission partners
with First 5 county commissions to focus
on research design; implementation of
Signature Programs for Child, Parent, and
Teacher; data collection and evaluation
for Signature Programs; and continuous
program improvement.
EXHIBIT 9: Child Development
–
Distribution of
Expenditures for Children Ages 0 to 5 and Adults
in FY 10/11 by Provider
County Government 2%
Elementary Schools 26%
Community
Agencies
45%
First 5 County
Commissions 6%
Private 3%
Other Government 4%
Educational
Institutions 14%
The percentages in this chart may not add to 100 due to rounding.
Source: County Revenue and Expenditure Summary, November 2011
First 5 CaliFornia
i
2010-2011
annual report
22
power of
tool inForMs aCaDeMiC suCCess
Since its inception in 1998, First 5 Santa
Barbara County has worked with its partners
to ensure that children have the support
they need to enter school ready to learn. An
important part of creating school readiness
is acquiring quality data for the purposes
of gaining a deeper understanding of what
works; assessing intervention effectiveness;
and improving school readiness measure-
ments and interventions.
In 2003, First 5 Santa Barbara, UC Santa
Barbara, and the Santa Maria Bonita School
District developed the Kindergarten Student
Entrance Profile (KSEP) tool to standardize
the assessment of entering kindergarteners.
The KSEP has drawn national attention as a
universal screening measure and is currently
being used by several school districts across
the United States, as well as school districts
throughout Santa Barbara County.
The KSEP tool measures school readiness,
that is, the degree to which children are
ready to start kindergarten. The KSEP
contains 16 items within school readiness
domains of socio-emotional, physical,
and cognitive abilities. This content
is consistent with the essential school
readiness indicators of the National
The Kindergarten Student
Entrance Profile (KSEP) has
drawn national attention as a
universal screening measure
and is currently being used
by several school districts
voiCe FroM a loCal CoMMunity: First 5 santa barbara County
23
Association for the Education of Young
Children and the California Desired Results
Developmental Profile.
The KSEP is an observational rating scale
completed by trained teachers who have
observed children for three weeks in their
natural classroom environments. Each item
is rated on a 4-point scale:
1 = not yet
2 = emerging
3 = almost mastered
4 = mastered
Since 2005, First 5 Santa Barbara, UC Santa
Barbara, and the Santa Maria Bonita School
District have used the KSEP to assess school
readiness and academic performance of
thousands of children entering kindergarten.
Through this valuable collaboration,
the organizations examined student
academic performance from kindergarten
through the third grade.
• KSEP scores significantly predicted
mid-kindergarten phonological
awareness and end-of-the-first-grade
reading fluency.
• Students with higher California
Standard Test scores at the end of
the second grade had significantly
higher KSEP ratings at kindergarten
entry than students with lower
California Standard Test scores.
14
success
tools
for
Photos courtesy of First 5 Santa Barbara County.