Báo cáo khoa học: Protein folding intermediates of invasin protein IbeA from Escherichia coli pdf
Bạn đang xem bản rút gọn của tài liệu. Xem và tải ngay bản đầy đủ của tài liệu tại đây (397.14 KB, 12 trang )
Protein folding intermediates of invasin protein IbeA
from Escherichia coli
Damodara R. Mendu
1
, Venkata R. Dasari
2
, Mian Cai
1
and Kwang S. Kim
1
1 Department of Pediatrics, Division of Infectious Diseases, Johns Hopkins University School of Medicine, Baltimore, MD, USA
2 Department of Biomedical and Therapeutic Sciences, College of Medicine, University of Illinois, Peoria, IL, USA
Escherichia coli is the most common Gram-negative
organism that causes neonatal meningitis [1–4]. E. coli
has several virulence factors, including a 50 kDa IbeA
protein, which has been found to be unique to cerebro-
spinal fluid isolates from neonatal E. coli meningitis.
E. coli invasin protein IbeA facilitates the E. coli
penetration of human brain microvascular endothelial
cells (HBMEC) which constitute the blood–brain
barrier (BBB) [5–7]. The 8.2 kDa N-terminal IbeA
protein was shown to inhibit E. coli K1 invasion of
HBMEC [5].
The primary amino acid sequence of a polypeptide
encodes all of the information necessary for folding and
assembly pathways, as well as the native 3D structure
Keywords
acid and Gdm-HCl-induced unfolding;
Escherichia coli; molten globule; protein
unfolding intermediates of IbeA
Correspondence
K. S. Kim, Division of Pediatric Infectious
Diseases, Johns Hopkins University School
of Medicine, 200 North Wolfe Street,
Room 3157, Baltimore, MD 21287, USA
Fax: +1 410 614 1491
Tel: +1 410 614 3917
E-mail:
(Received 9 October 2007, revised
15 November 2007, accepted 28 November
2007)
doi:10.1111/j.1742-4658.2007.06213.x
IbeA of Escherichia coli K1 was cloned, expressed and purified as a His
6
-
tag fusion protein. The purified fusion protein inhibited E. coli K1 invasion
of human brain microvascular endothelial cells and was heat-modifiable.
The structural and functional aspects, along with equilibrium unfolding of
IbeA, were studied in solution. The far-UV CD spectrum of IbeA at
pH 7.0 has a strong negative peak at 215 nm, indicating the existence of
b-sheet-like structure. The acidic unfolding curve of IbeA at pH 2.0 shows
the existence of a partially unfolded molecule (molten globule-like struc-
ture) with b-sheet-like structure and displays strong 8-anilino-2-naphthyl
sulfonic acid (ANS) binding. The pH dependent intrinsic fluorescence of
IbeA was biphasic. At pH 2.0, IbeA exists in a partially unfolded state with
characteristics of a molten globule-like state, and the protein is in extended
b-sheet conformation and exhibits strong ANS binding. Guanidine hydro-
chloride denaturation of IbeA in the molten globule-like state is noncoop-
erative, contrary to the cooperativity seen with the native protein,
suggesting the presence of two domains (possibly) in the molecular struc-
ture of IbeA, with differential unfolding stabilities. Furthermore, trypto-
phan quenching studies suggested the exposure of aromatic residues to
solvent in this state. Acid denatured unfolding of IbeA monitored by far-
UV CD is non-cooperative with two transitions at pH 3.0–1.5 and 1.5–0.5.
At lower pH, IbeA unfolds to the acid-unfolded state, and a further
decrease in pH to 2.0 drives the protein to the A state. The presence of
0.5 m KCl in the solvent composition directs the transition to the A state
by bypassing the acid-unfolded state. Additional guanidine hydrochloride
induced conformational changes in IbeA from the native to the A-state, as
monitored by near- and far-UV CD and ANS-fluorescence.
Abbreviations
ANS, 8-anilino-2-naphthyl sulfonic acid; BBB, blood–brain barrier; Gdm-HCl, guanidine hydrochloride; HBMEC, human brain microvascular
endothelial cells; IMAC, immobilized metal affinity chromatography; LB, Luria-Bertani; oPOE, octylpolyoxyethylene; PVDF, poly(vinylidene
difluoride); b-ME, b-mercaptoethanol.
458 FEBS Journal 275 (2008) 458–469 ª 2007 The Authors Journal compilation ª 2007 FEBS
[8,9]. Partially folded and denatured proteins can give
important insights into protein misfolding, and aggre-
gation. It has been recognized that the structure
of non-native state of proteins can provide significant
insight into fundamental issues such as the relationship
between protein sequences and 3D structures, the nat-
ure of protein folding pathways, the stability of pro-
teins and the transport of proteins across membranes
[10]. Even though a large amount of information is
available on protein folding intermediates [11–18],
there are no reports available for E. coli invasin pro-
tein IbeA. The process of unfolding and refolding is
useful for a complex unfolding transition, indicating
their presence of a partially folded intermediate with
one of the domains being ordered and disordered [19].
In the protein folding pathway, the identified inter-
mediates (aggregates) can be used to define the role of
the individual folding intermediaries in each pathway
and developing therapies against these intermediates
might be an attractive strategy. Such delineation can
only be achieved by identifying partially unfolded
states formed during folding, and correlating their
populations by spectroscopy. Using this approach,
IbeA protein folding intermediates (misfolded aggre-
gates) can be directly identified and attention focused
on defining the structural properties of these states. To
date, no information about the structural properties of
IbeA has been available. In the present study, we char-
acterized the biophysical properties of IbeA in solution
using spectroscopic techniques to identify protein fold-
ing intermediates.
Results
The initial step in the action of IbeA for E. coli
K1 traversal of the BBB is binding to a cell-surface
receptor, which induces the conformational changes of
the IbeA binding domains. We hypothesize that the
resulting protein–receptor complexes are endocytosed
and delivered to an acidic compartment (endosome) of
the cell, forming a prepore-like structure, enabling the
internalization and traversal of E. coli in HBMEC, but
the nature of this relationship is incompletely under-
stood. No studies on E. coli traversal mechanisms have
focused on the conformational changes occurring in
IbeA acidification, and no study has addressed the
acid-induced changes in the IbeA molecule. We also
hypothesize that the HBMEC central lumen is too
small to accommodate native IbeA, necessitating some
degree of protein unfolding for efficient translocation
of E. coli, and we have shown the existence of protein
folding intermediates and acidic unfolding intermedi-
ates in vitro.
Purification of IbeA
The expression level of IbeA was 6–8 mgÆL
)1
of
culture, and its molecular weight was 50 kDa by
SDS ⁄ PAGE. The fractions eluted from an immobilized
metal affinity chromatography (IMAC) column were
analyzed by Coomassiee blue staining (Fig. 1). The
identity of the IbeA was analyzed by western blotting
with monoclonal His
6
antibody (unpublished data) and
with purified antibodies to IbeA (Fig. 2). The correct
refolding of IbeA was shown by invasion assays and
heat modifiability experiments. The purified recombi-
nant IbeA blocked E. coli K1 invasion in HBMEC
m (kDa)
250
150
100
75
50
37
25
20
A B
C
D E
30 40 50
m (kDa)
190
120
85
60
50
40
25
20
A B C D E
A
B
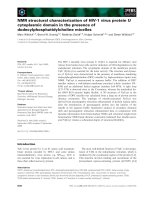
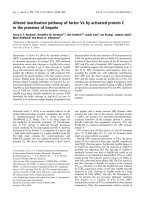
Fig. 1. (A) Analysis of the purified IbeA by SDS ⁄ PAGE (4–20%).
The alternate fractions from the TALONÒ column were analyzed by
SDS ⁄ PAGE. Lane A, molecular weight markers (Invitrogen pre-
stained markers); lane B, flow through; and lanes C–E, TALONÒ
fractions heated at 30, 40 and 50 °C for 5 min, respectively. (B)
Purified IbeA ($5 lg) was heated at 100 °C for 5 min in SDS ⁄ PAGE
sample buffer and analyzed by SDS ⁄ PAGE. Lane A, molecular
weight markers (Bio-Rad prestained markers) and lanes B–E, puri-
fied protein.
D. R. Mendu et al. Protein folding intermediates
FEBS Journal 275 (2008) 458–469 ª 2007 The Authors Journal compilation ª 2007 FEBS 459
(25 lgÆmL
)1
reduced the HBMEC invasion frequency
of E. coli K1 strain RS218 by 73%) and it is assumed
that this blocking activity is due to its native structure,
and that there was no interference of the His
6
-tag. On
the other hand, our His
6
-tag control protein and His
6
-
tag removed proteolytically from IbeA molecule did
not have any effect on HBMEC invasion of RS218.In
further studies, we used His
6
-tagged IbeA molecule.
We have also shown the correct folding of purified
IbeA by invasion assays, heat modifiability experi-
ments and fluorescence spectroscopy (Fig. 3) for both
neutral and acidic pH and denaturant. The refolded
protein displays the heat shift typical of outer mem-
brane proteins in the correctly folded state. The puri-
fied IbeA exists in three interconvertible forms,
distinguishable by SDS ⁄ PAGE as 50, 53 and 55 kDa
when heated at 30, 40 and 50 °C, respectively
(Fig. 1A). When the IbeA was heated at 100 °C for
5 min in SDS sample buffer, only the 50 kDa band
was observed (Fig. 1B), suggesting the gel shift at high
temperature. The gel shift of 5 kDa is similar to the
other modifiable membrane proteins [20–22]. We
assume that the 50 kDa protein is fully folded protein
and that the 53 and 55 kDa proteins could be a fold-
ing intermediate or off pathway species [23]. A number
of membrane proteins differ in their migration veloci-
ties in SDS ⁄ PAGE depending on whether or not the
protein was heated before electrophoresis [24–28]. The
fractions of TALONÒ shown in Fig.1A were identified
by the polyclonal sera (Fig. 2).
Characterization of IbeA
The purified IbeA was equilibrated with denaturant up
to 24 h and no further spectroscopic changes were
observed after 24 h, when the presented results were
obtained, indicating that equilibrium was attained
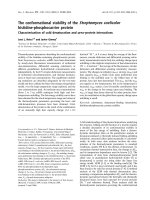
within this time. Near-UV CD was employed to exam-
ine the asymmetry of aromatic amino acids, and
thereby to monitor the changes in the tertiary structure
of the protein [22]. The CD spectrum of native IbeA
exhibited a positive peak at 276–278 nm and a nega-
tive peak at 297–299 nm, which is due to the presence
of tryptophan residues (Fig. 4A). However, pH 2.0
and strong denaturant, such as 6 m guanidine hydro-
chloride (Gdm-HCl), did not provide information due
to the disordered aromatic groups in the unfolded
state. The far-UV CD spectrum of a protein is a diag-
nostic probe of secondary structure and facilitates
determination of specific structural features that com-
prise the native conformation. The far-UV CD spec-
trum of IbeA (Fig. 4B) showed a negative peak at
215 nm, suggesting the presence of extended ß-sheet
regions. IbeA exhibited a negative peak at 200 nm,
indicative of a strong contribution from disordered
structural elements, characteristic of a protein in a ran-
dom coil conformation.
As can be seen, decreasing the pH below 2 changed
the acid-induced unfolded state due to the formation
of the A-state. The A-state of IbeA has a substantial
non-native secondary structure, and little or no tertiary
structure. These data strongly indicate the presence of
extended b-sheets and, in the presence of 6 m Gdm-
HCl, IbeA lost all of the peaks, suggesting the loss of
secondary structure. The deconvolution spectrum
obtained using the selcon program [29] provides the
structural component of IbeA (Table 1).
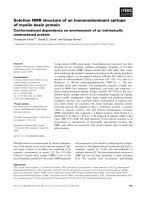
The intrinsic fluorescence spectra of IbeA at pH 7.0
and 2.0 and in the presence of 6 m Gdm-HCl are
shown in Fig. 3. The lowering of pH from 7.0 to 2.0
drastically decreased fluorescence intensity by 70–75%
with a blue shift of 16 nm in the emission maxima at
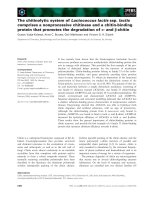
AB C
Fig. 2. Western blot analysis of purified, refolded IbeA using puri-
fied sera raised against pure IbeA. The pure IbeA (5 lg) was heated
at 30, 40 and 50 °C for 5 min in SDS ⁄ PAGE sample buffer and
loaded on to the 12% SDS ⁄ PAGE gel.
0
50
100
150
200
250
300
350
400
450
300 320 340 360 380 400
Wavelength (nm)
Fluorescence intensity
pH 7.0
Gdm-HCl (6 M)
pH 2.0
Fig. 3. Fluorescence spectroscopy analysis of denatured IbeA by
Gdm-HCl. Purified IbeA (1 l
M) was denatured by titrating with
Gdm-HCl at room temperature (25 °C). The denaturation mediated
changes in IbeA were monitored for tryptophan fluorescence; exci-
tation was 292 nm and emission was 300–420 nm at pH 7.0 and
2.0 and in the presence of 6
M Gdm-HCl.
Protein folding intermediates D. R. Mendu et al.
460 FEBS Journal 275 (2008) 458–469 ª 2007 The Authors Journal compilation ª 2007 FEBS
352–336 nm, indicating the non-polar environment of
tryptophan. Although the fluorescence spectrum of
completely unfolded IbeA in 6 m Gdm-HCl remains
similar in shape, the emission maximum suffers a red
shift from 352 nm to 358 nm along with a decrease in
fluorescence intensity of 60–70%. This red shift in the
wavelength maximum indicates that more tryptophan
residues of the protein are exposed to a polar environ-
ment, which is characteristic of unfolding, or could be
due to decreased distance between tryptophan and
quenching groups, resulting in tryptophan fluorescence
quenching.
The far-UV CD spectrum of IbeA remains
unchanged in the pH range of 3.0–10, and the spec-
trum reveals two distinct peaks: one at 222 nm and the
other at 208 nm (Data not shown). The unfolding of
the IbeA, in the absence of added salt, followed by
ellipticity at 222 nm, is noncooperative (Fig. 5). A
cooperative transition from the native state to an acid-
unfolded state occurred at pH 3.0–1.5, and a second
transition occurred on further lowering the pH from
1.5 to 0.5. The unfolded state at lower pH, exhibiting
a reduced secondary structure and loss of tertiary
structure, represents the acid-unfolded state of the
IbeA, indicating partial unfolding of the protein mole-
cule. Thus, IbeA at pH 1.5–1.0 exists in an acid-
unfolded state. Furthermore, addition of acid leads to
a second transition between pH 1.5 and 0.5 resulted in
an increase in secondary structure, leading to the
A state [30].
In the presence of 0.5 m KCl, pH-induced unfolding
of IbeA is cooperative, as manifested by a single tran-
sition (Fig. 5), in which the protein molecule passes
from the native state to the A state directly without
passing through the acid-unfolded state. The secondary
structural content of such a salt-induced A state is
more ordered than that observed at pH 0.5 in the
absence of added salt. The CD spectrum of the protein
at pH 2.0–0.5, either in the presence or in the absence
of 0.5 m KCl, exhibits predominantly extended b-sheet
structure and the negative peak at 215–217 nm at
pH 2.0 (Fig. 4B) is a common characteristic feature of
proteins having extended b-sheets. At a higher concen-
tration of KCl, aggregation or precipitation was
observed.
–30
0
30
60
90
120
150
250 270 290 310
Wavelength (nm)
Wavelength (nm)
[ ] deg cm
2
d mo l
–1
pH 7.0
pH 2.0
Gdm-HCl (6
M
)
–10
–7
–4
–1
2
5
8
11
180 190 200 210 220 230 240 250 260
[ ] × 10
–3
deg cm
2
d mol
–1
pH 7.0
pH 2.0
6
M
Gdm-HCl
A
B
Fig. 4. (A) Near- and (B) far-UV CD of purified IbeA in the presence
of oPOE, as described in the Experimental procedures, were
analyzed at pH 7.0 and 2.0 and in the presence of Gdm-HCl. The
protein concentrations were 3.25 l
M and 1.5 lM in the near- and
far-UV CD, respectively.
Table 1. Secondary structure content of IbeA by SELCON.
State a (%) b (%) Other (%)
Native 30 34 36
Acid unfolded 5 40 55
Gdm-HCl unfolded 10 50 40
–8
–7
–6
–5
–4
–3
–2
–1
0
0246810
pH
[θ] 222 × 10
–3
deg cm
2
dmol
–1
presence of salt
absence of salt
Fig. 5. Effect of salt on the structure of IbeA. Structural changes
of IbeA as a function of pH were monitored by studying ellipticity
values at 222 nm in the presence and absence of 0.5
M KCl.
D. R. Mendu et al. Protein folding intermediates
FEBS Journal 275 (2008) 458–469 ª 2007 The Authors Journal compilation ª 2007 FEBS 461
8-Anilino-2-naphthyl sulfonic acid (ANS)
fluorescence studies
The effect of pH on ANS binding shows that IbeA
binds more strongly at pH 2.0 rather than in its native
state (pH 7.0) and completely unfolded state (pH 0.5)
(Fig. 6A,B). At pH 2.0, IbeA has maximum hrdro-
phobicity (480 nm) compared with native IbeA
(518 nm) because of the presence of more accessible
hydrophobic residues to ANS. The ANS fluorescence
spectra between 10–0.5 pH (Fig. 6B) strongly support
the acidic unfolding with a two state transition and the
formation of a molten globule state at pH 3.0–1.5. The
molten globule was formed at pH 2.0 (Fig. 6B) with
high ANS binding capacity and significant secondary
structure with no tertiary structure. At pH 0.5, ANS
binding capacity and secondary structure was minimal
as it reached the A state. These data suggests the pres-
ence of a molten globule state at pH 2.0 with the for-
mation of the A state at pH 0.5, since the molten
globular state of IbeA molecule exposes hydrophobic
residues. All these data obtained at pH 2.0 support the
definition of a molten globule with b-helical confirma-
tion.
The pH dependent intrinsic fluorescence of IbeA
was carried out to evaluate its biphasic behavior.
Fig. 7A,B demonstrates that the pH-induced transi-
tions in IbeA molecule represent a two step process.
The first transition occurs between 4.0–6.0 with a mid-
point of 4.8 and second transition occurs between 1.0–
3.0 with a midpoint of 2.0. The fluorescence decreases
when the pH falls from 6.0 to 4.0 (blue shift) and,
in the latter transition, fluorescence intensity was
increased (red shift) as the protein reached its acid
unfolded state.
Iodine-quenching studies
The solvent accessibility of individual tryptophan resi-
dues in the native, molten globule and unfolded states
0
100
200
300
400
500
600
700
A
B
02468
10
pH
Fluorescence intensity
0
100
200
300
400
500
600
700
400 450 500 550 600
Fluorescence intensity
pH 7.4
pH 2.0
pH 3.0
pH 0.5
6 M Gdm-HCl
Wavelength (nm)
Fig. 6. ANS binding to IbeA as a function of pH. The samples were
incubated for 24 h at 25 °C before the measurements were taken.
(A) ANS binding measurement was taken by excitation at 360 nm
and emission was collected between 400–600 nm. (B) ANS fluores-
cence at different pH values.
330
335
340
345
350
355
360
A
B
pH
Wavelength maxima (nm)
0
75
150
225
300
375
450
0246810
012345678910
pH
Fluorescence intensity
Fig. 7. Intrinsic fluorescence analysis of IbeA at varying pH values.
The effect of pH on the intrinsic fluorescence of IbeA at different
pH values was plotted. The protein concentration was 1 l
M in
20 m
M PO
4
buffer pH 7.0, containing 5 mM oPOE. (A) The wave-
length maximum. (B) The excitation wavelength was 292 nm with
slit widths of 10 and 5 nm for excitation and emission, respec-
tively.
Protein folding intermediates D. R. Mendu et al.
462 FEBS Journal 275 (2008) 458–469 ª 2007 The Authors Journal compilation ª 2007 FEBS
was investigated by iodine quenching studies. The
quenching constants (K
SV
) and fraction of accessible
fluorophore (f
a
) at native pH and pH 2.0 in the pres-
ence of Gdm-HCl were 5.86, 8.64 and 9.28 m
)1
, and
0.36 ± 0.03, 0.89 ± 0.08 and 0.8 ± 0.07, respectively.
The modified Stern–Volmer plot indicates that the
tryptophan residues in the IbeA at pH 2.0 are more
exposed to the solvent compared with native IbeA at
pH 7.0 (Fig. 8). However 0–2 m Cs
+
was unable to
quench tryptophan fluorescence either at pH 2.0 or in
the presence of Gdm-HCl (data not shown). At neutral
pH, no noticeable changes were seen in the fluores-
cence spectra for both quenchers (data not shown).
These data indicate that no structural changes took
place in the protein molecule.
IbeA was denatured by Gdm-HCl at different
pH values and was monitored by near- and far-
UV CD and fluorescence spectroscopy to determine
the secondary and tertiary structural changes
(Table 2). The CD and intrinsic fluorescence spectrum
at pH 7.0 is sigmoidal and cooperative (Fig. 9A). At
pH 3.0, the Gdm-HCl-induced unfolding curves of
IbeA are cooperative (Fig. 9B), with non-coincidental
transition curves. At this pH, IbeA loses its secondary,
tertiary structure and fluorescence intensity, indicating
the presence of intermediates in the unfolding process
[31]. The existence of intermediates was further con-
firmed by ANS binding at 1.5 m Gdm-HCl (Fig. 9C).
However, at highly acidic pH < 2.0, IbeA lost its ter-
tiary structure, as indicated by near UV-CD spectrum
and, at pH 2.0, the Gdm-HCl-induced denaturation
curve of IbeA was non-cooperative (Fig. 9D). The
ANS binding to IbeA (Fig. 9E) was very strong after
the first transition and gradually decreased with an
increase in Gdm-HCl concentration, indicating the
existence of hydrophobic domains at first unfolded.
Discussion
The biophysical analysis of IbeA provides much infor-
mation about its conformational states and protein
folding intermediates. In the present study, we have
used multiple probes to investigate the structure of
IbeA by pH and the denaturation process induced by
Gdm-HCl. These probes were used to study its solu-
tion confirmation and to identify protein unfolding
intermediates. We attempted to characterize the fold-
ing intermediates in interaction with HBMEC, but low
pH (acidic) and denaturant damaged the HBMEC
monolayer, precluding such experiments.
IbeA was expressed, purified and refolded using
octylpolyoxyethylene (oPOE) detergent and has no
0
0.5
1
1.5
2
2.5
3
3.5
4
[I
-
]
–1
F0/ (F0 – F)
024681012
pH 7.0
pH 2.0
6 M Gdm-HCl
Fig. 8. The modified Stern–Volmer’s of tryptophan fluorescence
quenching by iodide [I
)1
]. Quenching of tryptophan fluorescence
intensity of IbeA at pH 7.0 and 2.0 and in the presence of Gdm-
HCl, was carried out with 0.0–0.2
M KI at 25 °C. KCl was added to
maintain the ionic strength constant. The data was analyzed as per
modified Stern–Volmers’s equation.
Table 2. Unfolding parameters of IbeA. RT, Room temperature. –, unable to calculate.
Denatured by Gdm-HCl Method Transition mid point (C
m
)(M) DG
U-N
(kcalÆmol
)1
) m
U-N
kcalÆmol
)1
ÆM
)1
pH 7.0 (RT) CD [h]
222
4.5 ± 0.1 )12.9 ± 0.5 )2.8 ± 0.1
CD [h]
278
4.4 ± 0.1 )12.8 ± 0.5 )2.6 ± 0.1
Fluorescence 4.5 ± 0.1 )13.0 ± 0.5 )2.7 ± 0.1
pH 3.0 (RT) CD [h]
222
2.4 ± 0.1 )4.9 ± 0.2 )1.8 ± 0.1
CD [h]
278
1.1 ± 0.1 )3.4 ± 0.2 )3.4 ± 0.1
Fluorescence 2.5 ± 0.1 )4.8 ± 0.2 )1.8 ± 0.1
pH 2.0 (RT) CD [h]
222
1.8 ± 0.1 (C
m1
)– –
3.2 ± 0.1 (C
m2
)– –
Fluorescence 1.8 ± 0.1 (C
m1
)– –
3.2 ± 0.1 (C
m2
)– –
D. R. Mendu et al. Protein folding intermediates
FEBS Journal 275 (2008) 458–469 ª 2007 The Authors Journal compilation ª 2007 FEBS 463
0
0.1
0.2
0.3
0.4
0.5
0.6
0.7
0.8
0.9
1
[Gdm-HCl] (
M
)
[Gdm-HCl] (
M
)
Fraction unfolded
near UV-CD
far UV-CD
fluorescence
0
0.2
0.4
0.6
0.8
1
1.2
1.4
0
0.2
0.4
0.6
0.8
1
1.2
1.4
Fraction unfolded
far UV-CD
near UV-CD
fluorescence
0
100
200
300
400
500
600
[Gdm-HCl] (M)
ANS fluorescence
[Gdm-HCl] (M)
Fraction unfolded
fluorescence
far UV-CD
near UV-CD
0
100
200
300
400
500
600
[Gdm-HCl] (
M
)
ANS fluorescence
3.5 4.5 5.5 6.5 0 1 2 3 4 5 6 7
0 1 2 3 4 5 6 7
0 1 2 3
4 5 6
02468
A
B
C
E
D
Fig. 9. Formation and identification of protein folding intermediates. 1 lM IbeA in 20 mM PO
4
buffer pH 7.0, containing 5 mM oPOE was
denatured as a function of Gdm-HCl. Near-and far-UV CD and ANS fluorescence were measured (A) at pH 7.0, (B) 20 m
M glycine buffer
pH 3.0 containing 5 m
M oPOE, (C) 20 mM glycine buffer pH 2.0 containing 5 mM oPOE, (D) ANS fluorescence at pH 3.0 and (E) at pH 2.0.
Protein folding intermediates D. R. Mendu et al.
464 FEBS Journal 275 (2008) 458–469 ª 2007 The Authors Journal compilation ª 2007 FEBS
interference in invasion assays. In principle, we cannot
discount the possibility that IbeA cannot refold in
solution is an in vitro artifact. We strongly believe that
this is not the case because we performed an extensive
screening of refolding conditions.
CD is a sensitive method for investigating the pep-
tide bond and has been widely used to elucidate the
structure of proteins [32–39]. The far-UV CD of IbeA
(Fig. 4B) is similar to the characteristic features of
porins [40–45]. The membrane proteins exist as
a-helical and ß-barrel proteins and the transmembrane
ß-barrels are present in Gram-negative bacteria
because they could be easily detectable due to the pres-
ence of non-polar residues in their outer membranes.
The strong ellipticities at 215 nm in far-UV CD indi-
cates that IbeA exists as an extended ß-sheet confirm-
ation in its native state and in the molten globular
state. The negative ellipticity at 208 and 222 nm also
indicates the presence of a-helical confirmation.
The fluorescence spectra of IbeA were identical
when excited at 278 and 295 nm (unpublished data)
and these data show that tyrosine fluorescence was
quenched by tryptophan. The fluorescence spectra of
IbeA at 6 m Gdm-HCl and at pH 7 indicate that more
tryptophan residues are exposed to a polar environ-
ment. It could be also possible that, at neutral pH, the
excitable chromophores are in a hydrophilic environ-
ment.
Our acid unfolding studies indicate that the molten
globule state was formed at pH 2.0 in the unfolding
process from pH 3.0–1.5 and this was also confirmed
by the ANS data. Thus, IbeA exhibits a two state tran-
sition in acidic denaturation, as the mechanisms of
acid-induced unfolding of proteins have been eluci-
dated in detail [30,46,47], and the pH-induced unfold-
ing of IbeA was explained accordingly. The decrease in
pH causes enhancement of protonation of the protein.
At pH 2.0, the protonation becomes saturated and the
protein loses its structure and forms the A state. Both
anions and cations will be present in the acidic unfold-
ing environment and addition of cations (K
+
) does
not have any impact on ionization. At extreme acidic
pH, there will be repulsion between the charged groups
of the protein, and an even high concentration of the
salts (counter-ions) interacts with charged groups and
weakens the repulsions. Thus, in the presence of salt
(KCl), the IbeA molecule directly reaches the A state.
The pH-induced denaturation curves demonstrate
that the decrease in the fluorescence intensity, with a
blue shift (15–17 nm) between 6.0–4.0 pH, could be
due to either the microenvironmental changes in the
region of tryptophan residues protecting its overall
structure and the tertiary structure of the protein, or
to uncharged carboxylate groups causing the less polar
environment near the tryptophan residues, resulting in
a blue shift of the tryptophan fluorescence [48]. In the
second transition, a red shift with an increase in fluo-
rescence intensity in the pH range between 3.0–0.5
occurs as a result of loss in its secondary structure due
to the acid-induced unfolding state.
The modified Stern–Volmer’s plot for the native
IbeA indicates the limited accessibility of the aromatic
residues but, at acidic pH, more aromatic groups are
exposed to the solvent due to the presence of a molten
globule. These data indicate the high binding capacity
of quenchers at acidic pH due to the formation of
molten globule compared to the native state. We
assume that the molten globule is a loosely packed
intermediate with largely exposed tryptophan residues.
The Gdm-HCl-induced unfolding of IbeA from a
molten globule to an unfolded state is noncooperative,
by contrast to the cooperative unfolding occurring at
neutral pH. This cooperative unfolding is due to the
integrity of IbeA owing to side chain packing entailing
the breaking of the tertiary structure required for non-
cooperative transitions observed in the molten globule.
The Gdm-HCl-induced unfolding of the IbeA molten
globule structure also denotes the presence of two
domains that unfold independently of each other. Our
Gdm-HCl data also indicate the unfolding of one
domain between 2.0–2.8 m Gdm-HCl whereas the
other one is intact. The ANS binding to the molten
globule at pH 2.0 is also parallel with the first transi-
tion because most of the hydrophobic residues are in
the first unfolded domain.
The Gdm-HCl and pH induced (3.0) unfolding curves
were coincidental, and the m
U-N
values at near –UV CD
are considerably higher than the fluorescence and
far-UV CD values. These data indicate the presence of
an intermediate state between the native and denatured
states. Furthermore, the existence of an intermediate
was demonstrated by ANS binding to IbeA at 1.5 m
Gdm-HCl with a secondary structure. The secondary
structure of the intermediates at pH 3.0 and 1.5 m
Gdm-HCl are almost similar, supporting the existence
of intermediates in the different conditions.
The characteristic heat modifiability was mainly used
to study b-barrel outer membrane proteins. The high
content of b-strands reflected in the CD spectra
reported in the present study suggests that a significant
number of extracellular loops also adopt this second-
ary structure. We assume that IbeA molecule b-barrel
strands traverse through the outer membrane into
extracellular space. IbeA had the characteristic features
of outer membrane proteins, with seven trans-
membrane domains having extended b-sheets and two
D. R. Mendu et al. Protein folding intermediates
FEBS Journal 275 (2008) 458–469 ª 2007 The Authors Journal compilation ª 2007 FEBS 465
functional domains that unfold independently. In the
IbeA unfolding process, an equilibrium intermediate
was found with 1.5 m Gdm-HCl and pH 2.0. The
unfolding pathway of IbeA could be divided into two
transition stages, namely an inactive intermediate and
a native state. The proposed unfolding pathway of
IbeA is shown in Fig. 10.
Experimental procedures
Reagents
High purity grade Gdm-HCl, ANS, and KI were obtained
from Sigma Chemical Co (St Louis, MO, USA); oPOE was
from Bachem (Torrance, CA, USA); TALONÒ IMAC
resin was from Clontech (Palo Alto, CA, USA); poly(vinyli-
dene difluoride) (PVDF) membrane was from Millipore
(Bedford, MA, USA); Novex gels and SDS ⁄ PAGE markers
and monoclonal anti-His
6
-tag sera were from Invitrogen
(Carlsbad, CA, USA); Bradford reagent was from Bio-Rad
(Bio-Rad, Hercules, CA, USA); lysozyme was from Roche
Diagnostics (Indianapolis, IN, USA); horseradish peroxi-
dase conjugated anti-mouse sera and the PVDF membrane
ECL detection kit were from Amersham Biosciences
(Piscataway, NJ, USA); and ampicillin, isopropyl thio-
b-d-galactoside, EDTA, dithiothreitol, b-mercaptoethanol
and complete protease inhibitors, oPOE, were from Sigma
Chemical Co.
Buffers and solutions
The buffers used for the spectroscopic measurements at dif-
ferent pH values were 20 mm KCl-HCl (0.5–1.5), 20 mm
glycine ⁄ HCl (pH 2–3), 20 mm sodium acetate (pH 4–5),
20 mm sodium phosphate (pH 6–7.5), and 50 mm Tris–HCl
(pH 8.5–10.5); all the buffers contained 5 mm of oPOE.
Unfolding conditions were provided by Gdm-HCl (0–6 m)
in 20 mm NaCl ⁄ P
i
, pH 7.0. ANS concentration was calcu-
lated spectrophotometrically using an extinction coefficient
of 5000 m
)1
Æcm
)1
at 350 nm. All the solutions were prepared
in deionized water and filtered through a 0.22-lm filter.
Expression of IbeA fusion protein
IbeA was cloned as described previously [6] as a 6 · His
6
-
tag fusion protein. E. coli DH5a containing the recombi-
nant IbeA plasmid was grown overnight in 10 mL LB
broth containing 100 lg Æ mL
)1
of ampicillin at 37 °C. The
overnight culture was inoculated to 1 L of fresh LB media
containing 100 l g ÆmL
)1
of ampicillin at 37 °C until an at-
tenuance of 0.4–0.6 at 600 nm was reached, after which
recombinant protein expression was induced by 1 mm iso-
propyl thio-b-d-galactoside for 3 h. The cells were collected
by centrifugation at 6000 g for 15 min and were frozen at
)20 °C until further use. Inclusion bodies were isolated as
previously described [6]. The cell pellet was suspended thor-
oughly in 20 mm Tris pH 8.0 containing 1 mm EDTA, 5%
glycerol, protease inhibitors (Roche Diagnostics), 100 mm
NaCl, 1 mm dithiothreitol (buffer ratio = 3 mL ⁄ 1 g of pel-
let). After making an even suspension, 2 mg ⁄ mL of lyso-
zyme was added and the cells were lysed by sonication. The
unbroken cells were removed by centrifugation and the cell
lysate was further centrifuged at 12 000 g for 1 h at 4 °C.
The pellet from the above step was washed with 2 m urea
in the lysis buffer, followed by centrifugation at 20 000 g
for 30 min. At this point, the white pellet was visible that
contains partially purified inclusion bodies. The partially
purified inclusion bodies were suspended in 10 mL of
freshly prepared denaturing buffer, 20 mm Tris pH 8.0 con-
taining 8 m urea and centrifuged at 20 000 g for 2 h at
room temperature and the clear supernatant was dialyzed
to a final concentration of 100 mm oPOE in the equilibra-
tion buffer (50 mm Tris–HCl, pH 8.0 containing 0.2 m urea
150 mm NaCl, 1 mm b-mercaptoethanol, and complete pro-
tease inhibitors, 5 mm imidazole for overnight with three
regular changes every 4 h. The dialysate was clarified by
centrifugation 12 000 g for 30 min, loaded onto a 10 mL
(15 · 1 cm) of pre-equilibrated TALONÒ IMAC column.
Then, the column was washed by 20 mL of the equilibra-
tion buffer, eluted in the same buffer containing 50 mm
imidazole and collected in 1 mL fractions. The purity of
the protein was detected by SDS ⁄ PAGE. The fractions
having pure protein was pooled and stored at )70 °C until
further use.
HBMEC invasion assays
HBMEC invasion assays were carried out as described pre-
viously [5–7]. Briefly, confluent HBMEC in 24-well tissue
culture plates were incubated with 107 colony forming units
of E. coli K1 strain RS218 at a multiplicity of infection of
100 for 90 min at 37 °C. The monolayers were washed once
Native
IbeA
N´
MG
pH 2.0 < pH 2.0
pH 3.0
U
1.5 M Gdm-HCl
at pH 3.0
1.5 M Gdm-HCl
at pH 2.0
Fig. 10. Hypothesized unfolding pathway for IbeA. N, native state at pH 7.0; N¢, non native state at acidic pH; MG, molten globule state at
1.5
M Gdm-HCl; U, unfolded state at pH < 2.0.
Protein folding intermediates D. R. Mendu et al.
466 FEBS Journal 275 (2008) 458–469 ª 2007 The Authors Journal compilation ª 2007 FEBS
and then incubated with experimental medium containing
gentamicin (100 lgÆmL
)1
) for 1 h to kill extracellular bacte-
ria. The monolayers were washed three times with NaCl ⁄ P
i
,
lysed with sterile water, and released intracellular bacteria
were enumerated by plating on sheep blood agar plates.
The results were calculated as a percent of the initial inocu-
lum. The effect of exogenous IbeA protein on E. coli K1
invasion of HBMEC was examined by pre-incubating
HBMEC with IbeA protein for 45 min at 37 °C, and then
followed by the above-mentioned invasion assays. His
6
-
tagged AslA protein was shown not to interact with
HBMEC and used as a control for His
6
-tagged IbeA.
Determination of correct folding: heat-
modifiability experiments
Samples were mixed 5 : 2 with SDS ⁄ PAGE loading buffer
containing 100 mm SDS and either boiled for 5 min or
directly loaded onto the gel. In all experiments, 4–20% gels
were used. Protein was detected by staining with Safe Coo-
massieÒ Protein Stain (Invitrogen).
Protein determination
The protein concentration was determined spectrophoto-
metrically using Bradford reagent.
Western blot analysis
The purified protein was separated on 12% Novex (tris-gly-
cine gel) SDS ⁄ PAGE gel and the protein was transferred
onto a PVDF membrane. After transfer, the membrane was
blocked in 5% (w ⁄ v) nonfat dried milk in NaCl ⁄ P
i
for 1 h
at room temperature. Monoclonal anti-His
6
-tagged sera
(1 : 2000) in the same blocking buffer was incubated at
room temperature for 1 h, followed by washing with
NaCl ⁄ P
i
containing Tween-20 (6 · 5 min) and incubation
with horseradish peroxidase conjugated anti-mouse serum
for 1 h at room temperature. Bound antibody was visual-
ized after six washings in NaCl ⁄ P
i
(6 · 5 min), and ana-
lyzed using the ECL detection kit.
CD studies
CD studies were performed on a Jasco Model J500A spec-
tropolarimeter (Jasco Inc., Easton, MD, USA). The second-
ary structure of the IbeA (1.5 lm) was monitored in the
far-UV region (190–260 nm) using a path length of 0.1 cm.
The tertiary structure of the IbeA (3.25 lm) was monitored
in the near-UV (250–320 nm) region using a path length of
0.5 cm path. Band widths were 1 nm in the far-UV and
0.4 nm in the near-UV CD. Each spectrum was recorded as
the average of three scans. The molar ellipticity (h) was cal-
culated using the formula:
h ¼ðh
observed
 molecular massÞ=ð10  l  cÞ
Where l is the length (cm) of the light path and c is the
concentration in gÆL
)1
[49]. 20 mm NaCl ⁄ P
i
pH 7.0 contain-
ing 5 mm oPOE was used as a blank under identical condi-
tions to the sample, and the value of the blank was
subtracted from the spectrum. All measurements were made
at room temperature. All data are the averages of three
measures.
Acidic denaturation of IbeA
IbeA was denatured as a function of pH, as mentioned for
the buffers above. In all the experiments, the final concen-
tration of the protein was 1 lm in 20 mm NaCl ⁄ P
i
pH 7.0
containing 5 mm oPOE.
1-Anilino-8-naphthalene sulfonate binding
measurements
The extrinsic fluorescence measurement was performed with
a Hitachi fluorimeter (Hitachi Corp., Tokyo, Japan). The
protein concentration was 1 lm in 20 mm NaCl ⁄ P
i
buffer
pH 7.0 containing 5 mm oPOE and the concentration of
ANS was 150 lm. Solutions were left overnight for equilibra-
tion. The excitation wavelength was 380 nm and the emission
fluorescence was monitored in the range 400–600 nm.
Fluorescence quenching experiments
Tryptophan quenching was performed by KI incubated at
pH 2.0 and 7.0 in the presence of 6 m Gdm-HCl at 25 °C
for 1 h. The samples of the protein with quencher were
incubated at 25 °C in the dark for 30 min before fluores-
cence measurements were taken. Tryptophan residue was
selectively excited at 292 nm. The absorbance of the sample
at 292 nm was always kept below 0.06; thus, no correction
of an inner filter effect was necessary. The intensity of the
fluorescence at the emission maximum was monitored as a
function of the increasing concentration of the quencher.
The quenching data were analyzed using the modified
Stern–Volmer equation [50,51]:
F
o
=ðF
o
À FÞ¼1=f
a
þ 1=ðf
a
ÁK
sv
Á½QÞ
where F
o
and F are the fluorescence intensities of the pro-
tein in the absence and presence, respectively, of a given
concentration of quencher [Q], K
sv
is the Stern–Volmer
quenching constant, and f
a
refers to the fraction of trypto-
phans accessible to the quencher.
Denaturation of IbeA as a function of Gdm-HCl
Gdm-HCl induced denaturation of IbeA at a given pH,
was performed with increasing concentrations of the
D. R. Mendu et al. Protein folding intermediates
FEBS Journal 275 (2008) 458–469 ª 2007 The Authors Journal compilation ª 2007 FEBS 467
denaturant. The protein sample was incubated at a
desired denaturant concentration for approximately 24 h at
25 °C to attain equilibrium. The final concentrations of the
protein and denaturant, in each sample, were determined
by spectrophotometry and refractive index measurements,
respectively. Data are expressed in terms of the fraction
unfolded (FU) calculated from the equation
FU ¼ðF
observed
À F
native
Þ=ðF
unfolded
À F
native
Þ
Each spectrum is the average of three emission scans, and
data were corrected by subtracting a blank from which the
experimental sample was omitted.
References
1 Stoll BJ (1997) The global impact of neonatal infection.
Clin Perinatol 24, 1–21.
2 Pong A & Bradley JS (1999) Bacterial meningitis and the
newborn infant. Infect Dis Clin North Am 13, 711–733.
3 Louvois J (1994) Acute bacterial meningitis in the new-
born. J Antimicrob Chemother 34, 61–73.
4 Kim KS (2001) Escherichia coli translocation at the
blood-brain barrier. Infect Immun 69, 5217–5222.
5 Huang SH, Wass CA, Fu Q, Prasadarao NA, Stins MF
& Kim KS (1995) Escherichia coli invasion of brain
microvascular endothelial cells in vitro and in vivo:
molecular cloning and characterization of invasion gene
ibe10. Infect Immun 63, 4470–4475.
6 Huang SH, Wan ZS, Chen YH, Jong AY & Kim KS
(2001) Further characterization of Escherichia coli brain
microvascular endothelial cell invasion gene IbeA by
deletion, complementation, and protein expression.
J Infect Dis 183, 1071–1078.
7 Kim KS. (2003) Neurological diseases: pathogenesis of
bacterial meningitis: from bacteremia to neuronal
injury. Nature Rev Neurosci 4, 376–385.
8 Anfinsen CB (1973) Principles that govern the folding
of protein chains. Science 181, 223–230.
9 Ptitsyn OB (1991) How does protein synthesis give rise
to the 3D-structure? FEBS Lett 285, 176–181.
10 Van der Goot FG, Gonzalez-Manas JM, Lakey JH &
Pattus F (1991) A ‘molten-globule’ membrane-insertion
intermediate of the pore-forming domain of colicin.
Nature 354, 408–410.
11 Dobson CM & Karplus M (1999) The fundamentals of
protein folding: bringing together theory and experi-
ment. Curr Opin Struct Biol 9, 92–101.
12 Chiti F, Taddei N, Bucciantini M, White P, Ramponi
G & Dobson CM (2000) Mutational analysis of the
propensity for amyloid formation by a globular protein.
EMBO J 19, 1441–1449.
13 Wright PE & Dyson HJ (1999) Intrinsically unstruc-
tured proteins: reassessing the protein structure-function
paradigm. J Mol Biol 293, 321–331.
14 Ren J, Kachel K, Kim H, Malenbaum SE, Collier RJ
& London E (1999) Interaction of diphtheria toxin T
domain with molten globule-like proteins and its impli-
cations for translocation. Science 284, 955–957.
15 Kay MS & Baldwin RL (1996) Packing interactions in
the apomyglobin folding intermediate. Nat Struct Biol
3, 439–445.
16 Schulman BA, Kim PS, Dobson CM & Redfield C
(1997) A residue-specific NMR view of the non-cooper-
ative unfolding of a molten globule. Nat Struct Biol 4,
630–634.
17 Dalby PA, Oliveberg M & Fersht AR (1998) Folding
intermediates of wild-type and mutants of barnase. I.
Use of small phi, Greek-value analysis and m-values to
probe the cooperative nature of the folding pre-equilib-
rium. J Mol Biol 276, 625–646.
18 Eliezer D, Yao J, Dyson J & Wright PE (1998) Struc-
tural and dynamic characterization of partially folded
states of apomyoglobin and implications for protein
folding. Nat Struct Biol 5, 148–155.
19 Tanford C (1968) Protein denaturation. Adv Protein
Chem 23, 121–282.
20 Chen YH, Yang JT & Martinez HM (1972) Determina-
tion of the secondary structures of proteins by circular
dichroism and optical rotatory dispersion. Biochemistry
24, 4120–4131.
21 Conlan S, Zhang Y, Cheley S & Bayley H (2000)
Biochemical and biophysical characterization of
OmpG: a monomeric porin. Biochemistry 39, 11845–
11854.
22 Schweizer M, Hindennach I, Garten W & Henning U
(1978) Major proteins of the Escherichia coli outer cell
envelope membrane. Interaction of protein II with lipo-
polysaccharide. Eur J Biochem 82, 211–217.
23 Beher MG, Schnaitman CA & Pugsley AP (1980)
Major heat-modifiable outer membrane protein in
gram-negative bacteria: comparison with the ompA pro-
tein of Escherichia coli. J Bacteriol 143, 906–913.
24 Davies RL & Lee I (2004) Sequence diversity and
molecular evolution of the heat-modifiable outer mem-
brane protein gene (ompA)ofMannheimia (Pasteurella)
haemolytica, Mannheimia glucosida, and Pasteurella tre-
halosi. J Bacteriol 186, 5741–5752.
25 Davies RL, MacCorquodale R, Baillie S & Caffrey B
(2003) Characterization and comparison of Pasteurella
multocida strains associated with porcine pneumonia
and atrophic rhinitis. J Med Microbiol 52, 59–67.
26 Marandi M & Mittal KR (1996) Characterization of
an outer membrane protein of Pasteurella multocida
belonging to the OmpA family. Vet Microbiol 53,
303–314.
27 Fajardo DA, Cheung J, Ito C, Sugawara E, Nikaido H
& Misra R (1998) Biochemistry and regulation of a
novel Escherichia coli K-12 porin protein, OmpG, which
Protein folding intermediates D. R. Mendu et al.
468 FEBS Journal 275 (2008) 458–469 ª 2007 The Authors Journal compilation ª 2007 FEBS
produces unusually large channels. J Bacteriol 180,
4452–4459.
28 Heller KB (1978) Apparent molecular weights of a
heat-modifiable protein from the outer membrane of
Escherichia coli in gels with different acrylamide concen-
trations. J Bacteriol 134, 1181–1183.
29 Sreerama N & Woody RW (1994) Poly(Pro)II type
structure in globular proteins – identification and CD
analysis. Biochemistry 33, 10022–10025.
30 Fink AL, Calciano LJ, Goto Y, Kurotsu T & Palleros
DR (1994) Classification of acid denaturation of pro-
teins: intermediates and unfolded states. Biochemistry
33, 12504–12511.
31 Sears DW & Beychok S (1973) Circular dichroism. In
Physical Properties and Techniques of Protein Chemistry.
Part C (Leach SJ ed.), pp. 445–593. Academic Press,
New York, NY.
32 Wong KP & Tanford C (1973) Denaturation of bovine
carbonic anhydrase B by guanidine hydrochloride. A
process involving separable sequential conformational
transitions. J Biol Chem 248, 8518–8523.
33 Wallace BA, Lees JG, Orry AJ, Lobley A & Janes RW
(2003) Analyses of circular dichroism spectra of mem-
brane proteins. Protein Sci 12, 875–884.
34 Sreerama N & Woody RW (2004) On the analysis of
membrane protein circular dichroism spectra. Protein
Sci 13, 100–112.
35 Yang JT, Wu CS & Martinez HM (1986) Calculation
of protein conformation from circular dichroism.
Methods Enzymol 130, 208–269.
36 Johnson WC Jr (1988) Secondary structure of proteins
through circular dichroism spectroscopy. Annu Rev
Biophys Biophys Chem 17 , 145–166.
37 Greenfield N & Fasman GD (1969) Computed circular
dichroism spectra for the evaluation of protein confor-
mation. Biochemistry 8, 4108–4116.
38 Venyaminov SY & Yang JT (1996) Determination of
protein secondary structure. In Circular Dichroism and
the Conformational Analysis of Biomolecules (Fasman
GD ed.), pp. 69–107. Plenum, New York, NY.
39 Sreerama N & Woody RW (2000) Circular dichroism
of peptides and proteins. In Circular Dichroism: Princi-
ples and Applications, 2nd edn (Berova N, ed.), pp. 601–
620. Wiley, New York, NY.
40 Sreerama N & Woody RW (2004) Computation and
analysis of protein circular dichroism spectra. Methods
Enzymol 383, 318–351.
41 Markovic-Housley Z & Garavito RM (1986) Structural
and functional characterization of a recombinant PorB
class 2 protein from Neisseria meningitidis. Conforma-
tional stability and porin activity. Biochim Biophys Acta
869, 158–170.
42 Eisele JL & Rosenbusch JP (1990) In vitro folding and
oligomerization of a membrane protein. Transition of
bacterial porin from random coil to native conforma-
tion. J Biol Chem 265, 10217–10220.
43 Rocque WJ & McGroarty EJ (1990) Structure and
function of an OmpC deletion mutant porin from
Escherichia coli K-12. Biochemistry 29, 5344–5351.
44 Tokunaga M, Tokunaga H, Okajima Y & Nakae T
(1979) Characterization of porins from the outer mem-
brane of Salmonella typhimurium
. 2. Physical properties
of the functional oligomeric aggregates. Eur J Biochem
95, 441–448.
45 Rosenbusch JP (1974) Characterization of the major
envelope protein from Escherichia coli. J Biol Chem
249, 8019–8029.
46 Lakowicz JR (1999) Principles of Fluorescence Spectros-
copy. Plenum Press, New York, NY.
47 Goto Y, Calciano LJ & Fink AL (1990) Acid-induced
folding of proteins. Proc Natl Acad Sci USA 87, 573–
577.
48 Goto Y, Takahashi N & Fink AL (1990) Mechanism of
acid-induced folding of proteins. Biochemisty 29, 3480–
3488.
49 Bohm G, Muhr R & Jaenicke R (1992) Quantitative
analysis of protein far UV circular dichroism spectra by
neural networks. Protein Eng 5, 191–195.
50 Stern O & Volmer M (1919) On the quenching time of
fluorescence. Z Phys 20 , 183–188.
51 Eftink MR (1991) Fluorescence quenching: theory and
applications. In Topics in Fluorescence Spectroscopy
(Lakowicz JR ed.), pp. 53–126. Plenum Press, New
York, NY.
D. R. Mendu et al. Protein folding intermediates
FEBS Journal 275 (2008) 458–469 ª 2007 The Authors Journal compilation ª 2007 FEBS 469