Báo cáo khoa học: C-terminal, endoplasmic reticulum-lumenal domain of prosurfactant protein C – structural features and membrane interactions ppt
Bạn đang xem bản rút gọn của tài liệu. Xem và tải ngay bản đầy đủ của tài liệu tại đây (910.86 KB, 12 trang )
C-terminal, endoplasmic reticulum-lumenal domain
of prosurfactant protein C – structural features
and membrane interactions
Cristina Casals
1
, Hanna Johansson
2
, Alejandra Saenz
1
, Magnus Gustafsson
2,3
, Carlos Alfonso
4
,
Kerstin Nordling
2
and Jan Johansson
2
1 Department of Biochemistry and Molecular Biology I & CIBER Enfermedades Respiratorias, Complutense University of Madrid, Spain
2 Department of Anatomy, Physiology and Biochemistry, Swedish University of Agricultural Sciences, The Biomedical Centre, Uppsala,
Sweden
3 Department of Medical Biochemistry and Biophysics, Karolinska Institutet, Stockholm, Sweden
4 Centro de Investigaciones Biolo
´
gicas, Consejo Superior de Investigaciones Cientı
´
ficas, Madrid, Spain
Amyloid diseases represent a growing medical problem
in which specific proteins are converted from their sol-
uble native structure and form insoluble fibrils. The
fibrils are composed of a cross-b-sheet structure, in
which the strands are oriented perpendicular to the
fibril axis [1]. The amyloid diseases include Alzheimer’s
Keywords
amyloid disease; Brichos domain;
membrane protein; protein–lipid interactions
Correspondence
J. Johansson, Department of Anatomy,
Physiology and Biochemistry, Swedish
University of Agricultural Sciences,
The Biomedical Centre, 751 23 Uppsala,
Sweden
Fax: +46 18 550762
Tel: +46 18 4714065
E-mail:
(Received 27 August 2007, revised 6
November 2007, accepted 4 December
2007)
doi:10.1111/j.1742-4658.2007.06220.x
Surfactant protein C (SP-C) constitutes the transmembrane part of prosurf-
actant protein C (proSP-C) and is a-helical in its native state. The C-termi-
nal part of proSP-C (CTC) is localized in the endoplasmic reticulum lumen
and binds to misfolded (b-strand) SP-C, thereby preventing its aggregation
and amyloid fibril formation. In this study, we investigated the structure of
recombinant human CTC and the effects of CTC–membrane interaction on
protein structure. CTC forms noncovalent trimers and supratrimeric oligo-
mers. It contains two intrachain disulfide bridges, and its secondary struc-
ture is significantly affected by urea or heat only after disulfide reduction.
The postulated Brichos domain of CTC, with homologs found in proteins
associated with amyloid and proliferative disease, is up to 1000-fold more
protected from limited proteolysis than the rest of CTC. The protein
exposes hydrophobic surfaces, as determined by CTC binding to the envi-
ronment-sensitive fluorescent probe 1,1¢-bis(4-anilino-5,5¢-naphthalenesulfo-
nate). Fluorescence energy transfer experiments further reveal close
proximity between bound 1,1¢-bis(4-anilino-5,5¢-naphthalenesulfonate) and
tyrosine residues in CTC, some of which are conserved in all Brichos
domains. CTC binds to unilamellar phospholipid vesicles with low micro-
molar dissociation constants, and differential scanning calorimetry and
CD analyses indicate that membrane-bound CTC is less structurally
ordered than the unbound protein. The exposed hydrophobic surfaces and
the structural disordering that result from interactions with phospholipid
membranes suggest a mechanism whereby CTC binds to misfolded SP-C in
the endoplasmic reticulum membrane.
Abbreviations
bis-ANS, 1,1¢-bis(4-anilino-5,5¢-naphthalenesulfonate); CTC, C-terminal domain of prosurfactant protein C; DPPC, 1,2-dipalmitoyl-
phosphatidylcholine; DSC, differential scanning calorimetry; ER, endoplasmic reticulum; FRET, fluorescence resonance energy transfer;
ILD, interstitial lung disease; LUV, large unilamellar vesicles; POPC, 1-palmitoyl-2-oleoyl-phosphatidylcholine; POPE, 1-palmitoyl-2-oleoyl-
phosphatidylethanolamine; POPG, 1-palmitoyl-2-oleoyl-phosphatidylglycerol; T
m
, gel-to-fluid phase transition temperature.
536 FEBS Journal 275 (2008) 536–547 ª 2008 The Authors Journal compilation ª 2008 FEBS
disease, the spongiform encephalopathies or prion dis-
eases, and type II diabetes mellitus. Knowledge of the
pathophysiological mechanisms in amyloid diseases is
incomplete, but they probably include cytotoxicity elic-
ited by the amyloid deposits as such and ⁄ or by soluble
intermediates on the pathway from the native to the
fibrillar state [2].
Lung surfactant protein C (SP-C) is a 35-residue
transmembrane a-helical lipopeptide that is exclusively
produced by alveolar type II cells. SP-C is secreted
into the alveolar space in order to promote spreading
and stability of phospholipids at the alveolar air–liquid
interface [3,4]. The a-helical structure of SP-C is meta-
stable, due to a poly-Val sequence, and spontaneously
converts to b-sheet aggregates and amyloid fibrils [5].
This property of SP-C appears to be relevant to
human disease. The fibrillar form of SP-C has been
isolated from lung lavage fluid obtained from patients
suffering from pulmonary alveolar proteinosis [6].
Moreover, recently discovered mutations in the SP-C
precursor [prosurfactant protein C (proSP-C)] are
associated with interstitial lung disease (ILD), misfold-
ing of proSP-C in the endoplasmic reticulum (ER), cel-
lular toxicity, and reduced levels of mature SP-C in the
alveoli [7–11]. proSP-C is a 197-residue transmembrane
protein with a type II orientation in the ER mem-
brane; that is, the N-terminus is localized on the cyto-
solic side. Mature SP-C corresponds to residues 24–58.
Residues 1–23 of proSP-C constitute an N-terminal
propart, and residues 59–197 constitute a C-terminal
propart localized in the ER lumen [see Fig. 3 below
for the amino acid sequence of the C-terminal part of
proSP-C (CTC)].
CTC contains a 100-residue Brichos domain, cov-
ering the region from residue 94 to the C-terminal end.
The name Brichos refers to the fact that the domain
was initially found in proteins belonging to the Bri
family, associated with familial British and Danish
dementia, in chondromodulin, associated with chon-
drosarcoma, and in proSP-C [12]. These proteins are
all made as transmembrane precursors that are pro-
cessed into fragments by proteolysis. Recently, the
Brichos domain has been found also in other proteins,
including a protein (TFIZ1) that binds trefoil domains
[13]. The Brichos domain may be involved in folding
and processing of the precursors and in binding to
other polypeptides [12,14]. The structural properties
have not been experimentally investigated for any Bri-
chos domain, and it lacks clearly homologous proteins,
although it has been compared to the apical domain of
the chaperone GroEL [12].
We have recently found that: (a) expression of
proSP-C
L188Q
, a mutant associated with ILD, in cell
culture, results in formation of intracellular amyloid-
like aggregates; (b) replacement of the metastable poly-
Val part with a thermodynamically stable poly-Leu
part [15] stabilizes proSP-C
L188Q
; (c) transfection with
CTC stabilizes proSP-C
L188Q
; (d) recombinant wild-
type CTC, but not CTC
L188Q
, binds to SP-C that is in
the b-strand conformation; and (e) CTC added in trans
prevents SP-C from forming amyloid fibrils [14]. These
findings suggest that CTC works as a specific scaven-
ger of misfolded SP-C in the ER and thereby prevents
aggregation and amyloid fibril formation. With the
aim of defining how CTC can scavenge misfolded,
membrane-bound SP-C, we have now investigated its
structure, domain organization, stability, and phospho-
lipid interactions.
Results
Quaternary structure
Analytical ultracentrifugation
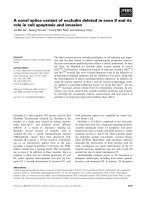
Sedimentation velocity was used to estimate the associ-
ation state of the protein and its degree of size polydis-
persity. Figure 1A shows the sedimentation coefficient
distribution of CTC, which reveals that the protein is
heterogeneous in size. The main sedimenting species
( 85% of the loading concentration) has an s-value of
3.1 ± 0.2 S, and two minor species ( 5% each) have
s-values of 1.9 and 5 S, respectively. These results agree
well with the distribution of species found by electro-
phoresis under native conditions (Fig. 1B). In order to
determine the mass of the main species observed, paral-
lel sedimentation equilibrium experiments were per-
formed. Figure 1C shows the protein gradient at
sedimentation equilibrium. The best fit analysis, assum-
ing a single sedimenting species, yielded an average
molecular mass of 52 000 ± 2000 Da, which is com-
patible with the size expected for a CTC trimer
(54 800 Da). The derived mass was essentially invariant
over protein concentrations from 0.05 to 0.45 mgÆmL
)1
.
The hydrodynamic behavior of the protein, taking into
account the sedimentation velocity and equilibrium
data, deviates slightly from that expected for a globular
trimer (frictional ratio f ⁄ f
o
= 1.6).
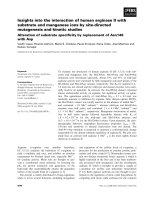
MS
ESI MS of CTC in aqueous buffer, pH 6.9, shows
mainly trimers, but dimers of trimers, trimers of tri-
mers and tetramers of trimers (i.e. hexamers, nonamers
and dodecamers) are also clearly visible (Fig. 2). Weak
signals corresponding to monomers, dimers, tetramers,
pentamers, heptamers and possibly octamers exist
C. Casals et al. proSP-C structure and membrane interactions
FEBS Journal 275 (2008) 536–547 ª 2008 The Authors Journal compilation ª 2008 FEBS 537
(data not shown). The largest oligomer uniquely identi-
fied was a dodecamer, representing a molecular mass
of 219 kDa. For trimers, a complete charge state enve-
lope between 11 and 26 charges (m ⁄ z 4982–2108) was
observed, and for hexamers and nonamers, complete
envelopes between 20 and 35 charges (m ⁄ z 5480–3132)
and between 28 and 37 charges (m ⁄ z 5872–4444),
respectively, were observed. An incomplete charge
state envelope between 48 and 66 charges (m ⁄ z 4567–
3322) was observed for dodecamers. Also, a complete
charge state envelope between 8 and 16 charges
(m ⁄ z 2284–1143) was observed for monomers, but its
strongest peak constituted only 0.6% of the intensity
of the peak at m ⁄ z 3654, which mainly corresponds to
a trimer with 15 charges (Fig. 2).
For mass determination of the denatured CTC
monomer, a complete charge state envelope between
10 to 18 charges was used for iterative deconvolution
onto a true mass scale, giving an average molecular
mass of 18 263.71 Da. The theoretical average mass of
the protein is 18 264.89 Da with all four Cys residues
oxidized (see below), which is in agreement with the
experimental result, giving a mass accuracy of 65 p.p.m.
Structure, stability and hydrophobic surface
Disulfide bridges
CTC contains four Cys residues. The mass of CTC
monomers determined by MALDI MS (18 264.1 Da;
supplementary Fig. S1A), like the mass of denatured
CTC determined by ESI MS (see above), was indeed
in almost exact agreement with its calculated mass,
provided that all four Cys residues are engaged in
disulfide bridges (18 264.9 Da). This shows that CTC
contains two intramolecular disulfides. For determina-
tion of half-cystine linkages, trypsin cleavage and
identification of liberated peptides by MALDI MS
was used. This showed two fragment ions that both
correspond to three peptides linked via two disulfide
bridges. The [M +H]
+
ion at 9272.0 corresponds to
peptides covering residues 82–125, 141–153, and 168–
197, whereas the [M +H]
+
ion at 9400.4 corresponds
to peptides 82–125, 140–153, and 168–197 (supplemen-
tary Fig. S1B; see Fig. 3 for the amino acid sequence
of CTC). These fragments show that one of the two
juxtaposed Cys residues at positions 120 and 121
forms a disulfide with Cys148 and the other forms a
disulfide with Cys189. The juxtaposition of Cys120
and Cys121 makes it difficult to cleave the polypeptide
chain in between these residues, in order to unambigu-
ously assign their disulfide partners. Cys121 and
Cys189 are strictly conserved in all Brichos domains
described so far, whereas Cys120 and Cys148 lack
counterparts in other Brichos domains and are not
conserved in all proSP-C sequences [12]. These data
strongly suggest that the disulfide pairings in CTC are
Cys120–Cys148 and Cys121–Cys189 (Fig. 3).
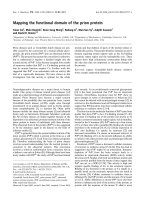
Limited proteolysis
CTC was treated with trypsin at a molar ratio of
1300 : 1 and at room temperature. Analysis of the
cleavage kinetics by MALDI MS showed that the sen-
sitivity towards trypsin differed >1000-fold between
the possible cleavage sites (Fig. 3). Cleavages after
Lys63 and Arg81 occurred first and were observed
after 25 s. Cleavages after Lys160 and Arg167 were
observed after 6 min. The most resistant cleavage sites
were those that follow Lys125 (cleavage first observed
after 2 h), Arg139 (cleavage observed after 4 h), and
Lys140 (cleavage after 8 days). Cleavages after Lys114
and Lys153 were observed first after 8 days and 19 h,
respectively. This resistance to cleavage, however, can
be explained by the presence of Pro at positions 115
AB
C
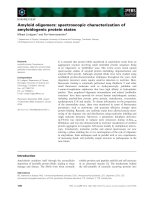
Fig. 1. Oligomerization state of CTC. (A) Sedimentation coefficient
distribution of 0.45 mgÆ mL
)1
CTC at 20 °C. (B) Native PAGE of
CTC. The labels on the left indicate bands that are compatible with
monomers (a), trimers (3a), hexamers (6a), and nonamers (9a),
according to sedimentation velocity and equilibrium data (A, C) and
MS data (Fig. 2). (C) Sedimentation equilibrium data (gray dots) and
the best fit analysis (solid line), assuming a single sedimenting spe-
cies. The lower panel shows residuals between estimated values
and experimental data for one-component fit.
proSP-C structure and membrane interactions C. Casals et al.
538 FEBS Journal 275 (2008) 536–547 ª 2008 The Authors Journal compilation ª 2008 FEBS
and 154. The pattern that emerges from these experi-
ments is that the CTC Brichos domain is much more
resistant to cleavage than the preceding part.
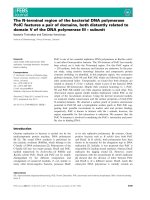
Urea-induced and temperature-induced unfolding
CD spectra of nonreduced and reduced CTC in the
presence of increasing amounts of urea are shown in
Fig. 4A,B. Nonreduced CTC showed small and
continuous changes in the spectra between 0 and 8 m
urea, whereas for reduced CTC, major changes took
place between 4 and 7 m urea. The residual molar ellip-
ticity at 222 nm versus urea concentration (Fig. 4C)
showed cooperative behavior, with a midpoint at 5.5 m
urea for reduced CTC, whereas no cooperative unfold-
ing was seen without reduction.
Similar results as observed in the urea experiments
were obtained by heating from 20 °Cto90°C. Non-
reduced CTC only showed a small linear decrease in
ellipticity at 222 nm above 60 °C, whereas reduced
CTC gave a sharp transition with a midpoint at about
68 °C (supplementary Fig. S2).
Interaction with 1,1¢-bis(4-anilino-5,5¢-
naphthalenesulfonate) (bis-ANS)
The fluorescence intensity and emission maximum
wavelength (k
max
) of bis-ANS depend on its environ-
ment, and are commonly used to probe accessible
hydrophobic surfaces of proteins. The fluorescence
intensity of bis-ANS increased > 7-fold and its k
max
was blue-shifted from 525 to 482 nm upon binding to
CTC (supplementary Fig. S3). The magnitude of the
fluorescence change increased as a function of CTC
concentration and was saturable. The apparent equilib-
rium dissociation constant (K
d
) for CTC–bis-ANS
complexes was 1.7 ± 0.3 lm (n = 2), assuming a
molecular mass of 18.2 kDa for monomeric CTC.
nd
0.5
0.5
nd
0.5
59 70
80
0.5
90 100 110
11500
120
120
130 150 170
11500
240
1125 6 6
180 197
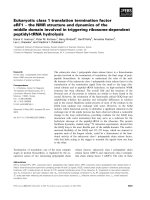
Fig. 3. Limited proteolysis of CTC. The amino acid sequence of
human CTC is in upper-case letters, and the sequence of the S-tag
is in lower-case letters. The numbering refers to the positions in
the full-length proSP-C sequence. The postulated Brichos domain is
underlined. The arrows mark trypsin cleavage sites and the time in
minutes after which the cleavages were first observed. The lines
connecting Cys residues represent the disulfide pairings now identi-
fied. nd, cleavage not detected.
2500 2750 3000 3250 3500 3750 4000 4250 4500 4750 5000 5250 5500 5750
m/
z
0
100
%
3M
16+
3M
15+
3M
14+
3M
17+
3M
19+
3M
21+
3M
22+
2M
13+
6M
24+
6M
23+
6M
22+
6M
21+
6M
20+
12M
51+
6M
25+
3M
13+
9M
28+
9M
29+
9M
30+
9M
31+
6M
26+
6M
27+
6M
28+
12M
57+
6M
29+
9M
37+
9M
35+
9M
32+
9M
34+
9M
33+
9M
36+
6M
30+
6M
32+
6M
31+
6M
33+
6M
34+
3M
20+
8M
38+
6M
35+
3M
18+
6M
36+
6M
38+
6M
39+
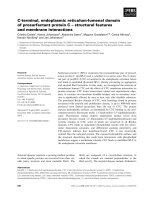
Fig. 2. ESI mass spectrum of CTC. Ions are labeled with their most likely oligomeric state and number of charges. Complete charge state
envelopes are labeled for a possible trimer, hexamer, and monomer. A complete envelope was not detected for a possible dodecamer, but
ions that could be unambiguously assigned (e.g. 12M
51+
) are indicated.
C. Casals et al. proSP-C structure and membrane interactions
FEBS Journal 275 (2008) 536–547 ª 2008 The Authors Journal compilation ª 2008 FEBS 539
CTC contains six Tyr residues and no Trp residues.
To determine whether Tyr residues are close to the bis-
ANS-binding site in CTC, fluorescence resonance
energy transfer (FRET) studies were performed.
Figure 5A shows the emission spectra of CTC after
excitation at 280 nm in the presence of different con-
centrations of bis-ANS. Upon addition of increasing
bis-ANS concentrations, there was a gradual decrease
in Tyr fluorescence at 306 nm, concurrent with an
increase in the bis-ANS fluorescence at 482 nm. As
free bis-ANS does not emit when excited at 280 nm,
the increase in fluorescence at 482 nm indicates energy
transfer from CTC Tyr residues to bis-ANS bound to
surface-exposed hydrophobic sites. FRET data were
also used to determine the affinity of bis-ANS for
A
B
C
Fig. 5. Energy transfer between Tyr and bound bis-ANS in CTC. (A)
Fluorescence emission spectra of CTC in the absence (black line)
and presence of increasing concentrations of bis-ANS. (B) The effi-
ciency of energy transfer from Tyr to bis-ANS. (C) Data from the
spectra shown in (A) were used to construct a plot of the relative
fluorescence intensity at 306 nm (blue circles, representing Tyr flu-
orescence) and the relative fluorescence at 482 nm (red circles,
representing bound bis-ANS fluorescence) versus bis-ANS concen-
tration.
–12
–10
–8
–6
–4
–2
0
2
0
<
8
A
–10
–8
–6
–4
–2
0
210 220 230 240 250 260
λ
λ
(nm)
8
0
<
B
θ
θ
–10
–8
–6
–4
–2
0
0246810
Urea (
M)
C
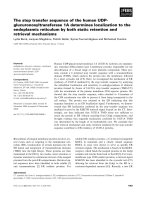
Fig. 4. Effects of urea on CTC secondary structure. CD spectra of
CTC in 0–8
M urea increasing by 1 M steps, as indicated by the
arrows. (A) Nonreduced CTC. (B) Reduced CTC. (C) Residual molar
ellipticity at 222 nm of reduced (crosses) and nonreduced (open cir-
cles) CTC versus urea concentration. The residual molar ellipticity
(h) is expressed in kdegÆcm
)2
Ædmol
)1
.
proSP-C structure and membrane interactions C. Casals et al.
540 FEBS Journal 275 (2008) 536–547 ª 2008 The Authors Journal compilation ª 2008 FEBS
CTC. The K
d
calculated from energy transfer efficiency
from Tyr residues to bis-ANS was 1.8 ± 0.2 lm
(Fig. 5B,C), similar to that calculated from bis-ANS
fluorescence titration experiments (supplementary
Fig. S3). Considering the dependence of energy trans-
fer efficiency on distance between donor and acceptor,
FRET experiments indicate molecular proximity of
Tyr residues in CTC and the bound bis-ANS.
Interaction with phospholipid vesicles
Intrinsic fluorescence experiments
The intrinsic Tyr fluorescence of CTC was measured
upon titration with large unilamellar vesicles (LUVs)
composed of 1-palmitoyl-2-oleoyl-phosphatidylcholine
(POPC), 1-palmitoyl-2-oleoyl-phosphatidylglycerol
(POPG), POPC ⁄ POPG (1 : 1, w ⁄ w), and POPC ⁄ 1-pal-
mitoyl-2-oleoyl-phosphatidylethanolamine (POPE)
(1:1,w⁄ w). As shown in Fig. 6A, increasing concen-
trations of LUVs progressively reduced the fluores-
cence emission intensity, reaching saturation at a
phospholipid ⁄ protein weight ratio of 10 : 1. For all
LUVs, a sharp decrease in fluorescence intensity at
305 nm was observed, reaching saturation at a phos-
pholipid concentration of 0.1 mm (CTC subunit con-
centration was 1 lm, Fig. 6B). Estimated K
d
values for
CTC–phospholipid complexes were in the low micro-
molar range (Fig. 6B).
Effect of phospholipid vesicles on CTC secondary
structure
The CD spectrum of CTC in the absence of lipids
(Fig. 7, black line) indicates 32% a-helix, 34% b-sheet,
and about 20% random coil structures (Table 1). The
binding of CTC to increasing concentrations of LUVs
progressively altered the CD signal. The negative ellip-
ticity increased and the minimum was blue-shifted
(Fig. 7). For all types of phospholipid vesicles, the
percentages of a-helix and b-sheet structures decreased,
whereas that of random coil structure increased
(Table 1). This effect was most prominent with POPC
and 1,2-dipalmitoyl-phosphatidylcholine (DPPC)
vesicles.
Effect of phospholipid vesicles on CTC thermal
unfolding
Thermal unfolding of nonreduced CTC was not
observed by CD (supplementary Fig. S2). Therefore,
differential scanning calorimetry (DSC) was used to
determine the thermal stability of free and membrane-
bound CTC. The melting curve displayed one heat
absorption peak over a temperature range of 20–95 °C
(Fig. 8A, scan 1). The apparent T
m
value was
66.4 ± 0.4 °C(n = 5). Thermal unfolding of CTC
was not completely reversible; after a cycle of heating
and cooling, there was a distortion with the appear-
ance of a low-temperature endotherm (Fig. 8A,
scan 2). The heat capacity curves for the second and
third scans overlapped. Interestingly, the melting curve
of reduced CTC showed a low-temperature endotherm,
similar to scan 2 of the nonreduced protein (data not
shown).
The melting curves of membrane-bound CTC
showed two transitions with maxima at 59 °C and
66–67 °C (Fig. 8B). The first, second and third heat
capacity curves of membrane-bound CTC overlapped.
Discussion
The present study shows that human CTC is oligo-
meric, exposes hydrophobic surfaces, and binds to
phospholipid membranes with concomitant structural
disordering of the protein. CTC mainly forms trimers,
but also some larger oligomers (Fig. 1). Analytical
ultracentrifugation lacks the ability to exactly deter-
mine the molecular mass, and the composition of the
AB
Fig. 6. CTC binds to phospholipid vesicles.
(A) Fluorescence emission spectra of CTC
in the absence and presence of different
amounts of POPC vesicles at 25 °C. The
phospholipid ⁄ CTC weight ratios are indi-
cated. (B) Net change in fluorescence
emission intensity at 305 nm versus phos-
pholipid concentration. Estimated K
d
values
for CTC–phospholipid vesicle complexes are
given in parentheses.
C. Casals et al. proSP-C structure and membrane interactions
FEBS Journal 275 (2008) 536–547 ª 2008 The Authors Journal compilation ª 2008 FEBS 541
larger complexes was therefore difficult to assign.
ESI MS can be used to study protein interactions in
the gas phase under pseudo-physiological conditions
[16,17]. The ESI data show that CTC forms trimers
and oligomers of trimers (Fig. 2). Chemical crosslink-
ing experiments have shown that proSP-C in cell
culture forms dimers and larger oligomers. Also,
proSP-C(24–58), i.e. the mature SP-C part, was cross-
linked into mainly dimers but also larger oligomers,
indicating that proSP-C oligomerization in the ER
membrane is mediated by the SP-C part [18]. Our data
show that CTC forms trimers in the absence of the
remaining parts of proSP-C, which suggests that the
C-terminal part can also contribute to proSP-C oligo-
merization. ILD-associated mutations in the Brichos
domain of proSP-C are present on one allele only, but
still cause near complete absence of mature SP-C [4].
The ability of CTC to oligomerize may partly explain
this dominant negative effect, if mutant and wild-type
proSP-C form co-oligomers that are trapped in the ER.
The Brichos domain was postulated from multiple
sequence alignments [12]. Limited proteolysis of CTC
(Fig. 3) gives experimental support for the existence of
a folded entity that agrees well with the proposed
Fig. 7. Effect of phospholipid vesicles on CTC secondary structure. The composition of the phospholipid vesicles is given above each set of
spectra. The total phospholipid ⁄ CTC weight ratios were: no phospholipid (A); 0.25 : 1 (B); 1 : 1 (C); 5 : 1 (D); 10 : 1 (E); and 20 : 1 (F).
Table 1. Secondary structure contents of CTC in the absence and
presence of phospholipid vesicles. The phospholipid ⁄ protein weight
ratio was 10 : 1.
% Secondary structure
a-Helix b-Sheet b-Turn Random
CTC 32 34 15 19
+ POPC 26 20 15 39
+ DPPC 26 22 12 39
+ POPG 27 24 15 33
+ POPC ⁄ POPG
(1 : 1, w ⁄ w)
27 23 14 36
+ DPPC ⁄ POPG
(1 : 1, w ⁄ w)
27 24 12 34
+ POPC ⁄ POPE
(1 : 1, w ⁄ w)
26 28 11 34
+ DPPC ⁄ POPG ⁄ POPE
(2:1:1,w⁄ w)
28 27 12 34
AB
Fig. 8. Thermal unfolding of CTC in the
absence and presence of phospholipid vesi-
cles. The temperature dependence of spe-
cific heat capacity at constant pressure, C
p
,
in the absence (A) and presence (B) of dif-
ferent phospholipid vesicles. The phospho-
lipid ⁄ protein weight ratio was 10 : 1.
proSP-C structure and membrane interactions C. Casals et al.
542 FEBS Journal 275 (2008) 536–547 ª 2008 The Authors Journal compilation ª 2008 FEBS
boundaries of the Brichos domain. The region between
residues 160 and 170 appears to be less protected from
proteolysis than the rest of CTC. It is notable that this
region is localized in a part of proSP-C where residue
exchanges between species are frequent as compared
to most of proSP-C (see />BRICHOS for alignment of proSP-C sequences), and
that Xenopus laevis proSP-C [19] has a deletion in this
region. The non-Brichos part of CTC is readily cleaved
by trypsin, which indicates that it is structurally flexi-
ble. Interestingly, this segment is evolutionarily well
conserved, and ILD-associated mutations herein, e.g.
the common proSP-C
I73T
, appear to give rise to a
different phenotype than mutations in the Brichos
domain [4].
CTC exposes hydrophobic surfaces with contribu-
tions from Tyr residues (Fig. 5). It is tempting to spec-
ulate that the side chains of some of the six Tyr
residues in CTC (Fig. 3) might form an apolar pocket
involved in the recognition of poly-Val peptides and
lipid-bound nonhelical SP-C [14]. The Tyr residues are
well conserved in proSP-C, and the mutation pro-
SP-C
Y104H
is linked to ILD [20]. Furthermore, Tyr
residues at positions 106, 122 and 195 of proSP-C are
highly conserved (or replaced by Phe) in all Brichos
domains [12].
CTC binds to both zwitterionic and anionic phos-
pholipid vesicles (Fig. 6). The slightly lower K
d
for
CTC binding to POPC than for binding to POPG indi-
cates a somewhat higher affinity for the phosphocho-
line headgroup. However, when POPC was mixed with
POPE, but not with POPG, the binding affinity
decreased slightly. With respect to the physical state of
the phospholipid vesicles, CTC binds equally to satu-
rated (DPPC) and unsaturated (POPC) vesicles (data
not shown). The low micromolar K
d
values for CTC–
phospholipid vesicles indicate high binding affinities,
comparable to those determined for tightly associated
membrane proteins such as spectrin (K
dPC
= 0.5 lm)
[21], cecropin P1 (K
dPC⁄ PS
=8lm) [22], or cyto-
chrome c oxidase (K
dPC⁄ PG
=26lm) [23]. This sug-
gests that the C-terminal domain of proSP-C will also
associate with phospholipid membranes after it has
been proteolytically released from proSP-C.
CD spectroscopy shows that CTC contains a mixed
secondary structure and that the disulfides are essential
for stability (Fig. 4, Table 1). Thermal unfolding of
CTC measured with DSC shows a broad endotherm
(Fig. 8), which indicates that the structure unfolds
gradually, rather than in a cooperative manner. It is
plausible that the oligomeric nature contributes to this
behavior. CTC binding to phospholipid vesicles
resulted in the appearance of a reversible low-tempera-
ture endotherm (Fig. 8). This is consistent with a phos-
pholipid-induced increase in random structure and a
decrease in ordered structures seen by CD spectros-
copy (Fig. 7, Table 1). Collectively, the results from
DSC and CD experiments indicate that membrane-
bound CTC is structurally less ordered than the free
protein. Structural disordering of CTC upon mem-
brane binding is intriguing, as a less ordered structure
will be more adaptable in binding to misfolded SP-C.
The structural properties of CTC, in particular
exposed hydrophobic surface and membrane interac-
tions, are thus compatible with a role as a scavenger of
misfolded SP-C in the ER membrane. Disulfide bridges
and Tyr residues are here shown to be important for
CTC stability and exposure of hydrophobic surface,
respectively. Cys and Tyr residues are particularly well
conserved in the Brichos domain [12], which suggests
that some of the features of CTC now described are
applicable to other Brichos domains as well.
Experimental procedures
Materials
bis-ANS was obtained from Molecular Probes, Inc.
(Eugene, OR, USA). Synthetic phospholipids were obtained
from Avanti Polar Lipids (Birmingham, AL, USA). Metha-
nol and chloroform used to dissolve lipids were HPLC-
grade (Scharlau, Barcelona, Spain). All other reagents were
of analytical grade and were obtained from Merck (Darms-
tadt, Germany).
Expression and isolation of CTC
CTC was expressed and purified as described previously [14].
In essence, a fragment covering residues 59–197 of human
proSP-C was expressed as a fusion protein with thioredoxin-
tag, His
6
-tag and S-tag in Escherichia coli. The protein was
purified using affinity chromatography and ion exchange
chromatography. Thrombin was used to remove the thiore-
doxin-tag and His
6
-tag. The protein purity on SDS ⁄ PAGE
was > 90%. Native PAGE was performed at 4 °C with a
4–20% gradient polyacrylamide gel (Biorad, Hercules, CA,
USA) for 16 h. CTC was visualized by silver stain.
Analytical ultracentrifugation
Sedimentation velocity experiments were performed at
50 000 r.p.m. and 20 °C in a Beckman XL-A ultracentrifuge
(Beckman-Coulter Inc., Fullerton, CA, USA) with a
UV–visible optics detector, using an An-50Ti rotor and
double-sector 12 mm centerpieces of Epon-charcoal. Sedi-
mentation profiles were registered every 5 min at 235, 260
C. Casals et al. proSP-C structure and membrane interactions
FEBS Journal 275 (2008) 536–547 ª 2008 The Authors Journal compilation ª 2008 FEBS 543
or 280 nm. Typically, 0.45 mgÆmL
)1
CTC in 20 mm
phosphate buffer (pH 7.4) were used. The sedimentation
coefficient distributions were calculated by least-squares
boundary modeling of sedimentation velocity data using the
c(s) method [24,25], as implemented in the sedfit program,
from which the corresponding s-values were determined.
Sedimentation equilibrium short-column experiments
(70 lL of protein, loading concentrations 0.05, 0.075, 0.1,
0.15, 0.225 and 0.45 mgÆmL
)1
in 20 mm phosphate buffer,
pH 7.4) were done at 16 000, 18 000, 20 000 and
35 000 r.p.m. by taking absorbance scans when sedimenta-
tion equilibrium was reached. High-speed sedimentation
(50 000 r.p.m.) was conducted afterwards for baseline cor-
rections. The buoyant molecular masses of the protein were
determined by fitting a sedimentation equilibrium model of
a single sedimenting solute to individual data using the pro-
grams eqassoc [26] or HeteroAnalysis [27]. These values
were converted to the corresponding average molecular
masses by using 0.731 mLÆg
)1
as the partial specific volume
of CTC, calculated from the amino acid composition with
the program sednterp [28].
ESI MS
Data were acquired on a QTOF Ultima API mass spec-
trometer, (Waters, Milford, MA, USA) equipped with a
Z-spray source operated in the positive-ion mode. Scans
between 800 and 6000 m ⁄ z were acquired. Samples were
introduced via a nanoflow electrospray interface from
metal-coated borosilicate glass capillary needles (Proxeon
Biosystems, Odense, Denmark), and the source temperature
was 80 °C. The capillary voltage was between 1.2 and
1.9 kV, and cone and RF lens potentials were 100 and
38 V, respectively. The pumping of the ESI interface region
was restricted; backing pirani vacuum gauge from 1.8 to
1.95 mbar, and analyzer pressure 5.85 · 10
)5
mbar. Argon
gas was used as collision gas, and the collision voltage was
10 V. The instrument was operated in single reflector mode
at a resolution of 10 000 (full width half maximum
definition), and the mass scale was calibrated against
poly(ethylene glycol)-3400. CTC stock solution (1164 lm in
20 mm sodium phosphate buffer, 30 mm NaCl, pH 7.4) was
diluted to 11 lm in 10 mm ammonium acetate buffer
(pH 6.9) prior to analysis. A mass spectrum of monomeric
CTC denatured in 30% acetonitrile ⁄ 0.1% acetic acid was
deconvoluted onto a true mass scale using the maximum
entropy function of the masslynx software package. The
processing parameters were as follows: the output mass
range was 15 000–21 000 Da at a ‘resolution’ of 1.0 Da per
channel; the damage model was used with the uniform
Gaussian parameter set to 1.0 Da width at half-height; the
minimum intensity ratios between successive peaks were
10% (left and right). The deconvoluted spectrum was mass
centroided using 80% of the peak and a minimum peak
width at half-height of two channels.
MALDI MS
Spectra were acquired on a Bruker Autoflex (Bruker
Daltonics, Billerica, MA, USA) operated in linear mode
(m ⁄ z 1800–26 000) or in reflector mode (m ⁄ z 800–5000). In
both cases, delayed extraction was employed. When pep-
tides < 4000 Da were analyzed, 0.5 lL of sample was
added to a Bruker standard steel target and cocrystallized
with 0.5 lLofa-cyano-4-hydroxycinnamic acid
(3 mgÆmL
)1
) dissolved in 70% acetonitrile ⁄ 0.1% trifluoro-
acetic acid. When proteins > 4000 Da were analyzed,
0.5 lL of sample was deposited on top of a thin layer of
sinapinic acid precrystallized from a 30 mgÆmL
)1
solution in
acetone, and cocrystallized with 0.5 lL of sinapinic acid
(30 mgÆmL
)1
) dissolved in 50% acetonitrile ⁄ 0.1% trifluoro-
acetic acid.
Limited proteolysis
Two hundred micrograms of CTC and 0.2 lg of modified
trypsin (Promega, Madison, WI, USA) were dissolved in
100 lLof50mm ammonium bicarbonate buffer (pH 7.8)
at room temperature. At different time points, between 25 s
and 8 days, 1 lL aliquots were removed and added to 9 lL
of ice-cold 30% acetonitrile ⁄ 0.1% trifluoroacetic acid and
kept on ice until analysis by MALDI MS.
Preparation of phospholipid vesicles
Freshly prepared unilamellar vesicles were used. Phospho-
lipids were dissolved in chloroform ⁄ methanol 3 : 1 (v ⁄ v),
and evaporated under a stream of nitrogen and under
reduced pressure overnight. Vesicles were prepared at a
total phospholipid concentration of 1 mgÆmL
)1
by hydrat-
ing lipid films in 150 mm NaCl, 0.1 mm EDTA, and 5 mm
Tris ⁄ HCl (pH 7.4), and allowing them to swell for 1 h at a
temperature above their T
m
. After vortexing, the resulting
multilamellar vesicles were sonicated at the same tempera-
ture in a UP 200S sonifier with a 2 mm microtip. The final
lipid concentration was assessed by phosphorus determina-
tion. For vesicle-size analysis, quasi-elastic light scattering
was used. DPPC ⁄ POPG (1 : 1, w ⁄ w), POPC ⁄ POPG (1 : 1,
w ⁄ w) and POPG vesicles consisted of a major population
(85%) of unilamellar vesicles (mean diameter 95 ± 15 nm)
and a minor population (15%) of multilamellar vesicles
that was removed by centrifugation. Vesicles of DPPC,
POPC and POPC ⁄ POPE (1 : 1, w ⁄ w) consisted of a major
population (60–70%) of unilamellar vesicles (mean diameter
110–160 nm).
CD spectroscopy
For unfolding experiments, CD spectra in the far-UV
region (190–260 nm) were recorded either at 22 °C for CTC
proSP-C structure and membrane interactions C. Casals et al.
544 FEBS Journal 275 (2008) 536–547 ª 2008 The Authors Journal compilation ª 2008 FEBS
(20 lm)in20mm NaH
2
PO
4
and 5 mm NaCl buffer
(pH 7.4), containing from 0 to 8 m urea, or between 20 °C
and 90 °C at 222 nm, with increments of 2 °CÆmin
)1
, for
CTC (15 lm)in10mm NaH
2
PO
4
and 50 mm NaCl
(pH 7.4). Reduction was achieved by incubation with
300 lm dithiothreitol at 37 °C for 2 h. Spectra were
recorded with a Jasco J-810-150S spectropolarimeter (Jasco,
Tokyo, Japan), using a bandwidth of 1 nm and a response
time of 2 s, and 10 data points per nanometer were col-
lected. Each spectrum is the average of three scans.
Far-UV CD spectra of CTC in the presence of phos-
pholipid vesicles were obtained on a Jasco J-715 spectro-
polarimeter. Four scans were accumulated and averaged for
each spectrum. The acquired spectra were corrected by
subtracting the appropriate blank runs (of buffer or phos-
pholipid vesicle solutions), and subjected to noise reduc-
tion analysis; data are presented as molar ellipticities (h)
(kdegÆcm
)2
Ædmol
)1
), using 130 Da as the average residue
mass. All measurements were performed in 5 mm Tris ⁄ HCl
buffer (pH 7.4), containing 150 mm NaCl at 25 °C. The
protein concentration was 10 lm. Estimation of the second-
ary structure content from the CD spectra was performed
after deconvolution of the spectra into four simple compo-
nents (a-helix, b-sheet, b-turn, and random coil) according
to the convex constraint algorithm [29].
Fluorescence measurements
Fluorescence measurements were carried out using an
SLM-Aminco AB-2 spectrofluorimeter with a thermostated
cuvette holder (Thermo Spectronic, Waltham, MA, USA)
(± 0.1 °C), using 5 · 5 mm path-length quartz cuvettes.
Fluorescence emission spectra of CTC (1 lm) with or with-
out phospholipid vesicles or bis-ANS were measured at
25 °Cin5mm Tris ⁄ HCl buffer (pH 7.4) and 150 mm
NaCl. Excitation was at 280 nm, emission spectra were
recorded from 290 to 400 nm, and the slit-widths were
4 nm.
In titration experiments, aliquots of a vesicle suspension
(typically 1 mgÆmL
)1
) were added to the protein solution.
The fluorescence intensity spectra were corrected for dilu-
tion, scatter contribution of lipid dispersions, and the inner
filter effect. Absorption spectra of the samples were
recorded using a Beckman DU-800 spectrophotometer. In
all lipid titration experiments, the absorbance at 280 nm
was less than 0.1.
To calculate the K
d
values, the interaction of CTC with
phospholipid vesicles was treated as a 1 : 1 association.
K
d
values were derived by nonlinear least-squares fits of
data from equilibrium binding titrations of phospholipids
and CTC.
To determine the binding constant between bis-ANS
(e =23· 10
3
cm
)1
m
)1
at 395 nm) and CTC, fluorescence
titration experiments were performed with 1 lm CTC in
5mm Tris ⁄ HCl buffer (pH 7.4), incubated with 0–25 lm
bis-ANS for 10 min at 25 °C. The fluorescence spectra of
bis-ANS from 450 to 600 nm were obtained with excitation
at 395 nm. The K
d
for CTC–bis-ANS complexes was calcu-
lated from the saturation curve fitted to a rectangular
hyperbola. FRET from CTC Tyr residues to bound bis-
ANS was performed under the same conditions. The fluo-
rescence emission intensity was recorded from 290 to
600 nm after excitation at 280 nm. To calculate the effec-
tive energy transfer [30], CTC alone as the donor, bis-ANS
alone and CTC+ bis-ANS were measured.
DSC
Calorimetry was performed in a Microcal VP differential
scanning calorimeter (Microcal Inc., Northampton, MA,
USA). CTC (10 lm)in20mm phosphate buffer (pH 7.4)
was analyzed in the absence or presence of phospholipid
vesicles with T
m
below 0 °C. All solutions were degassed
just before loading into the calorimeter. Data were collected
between 20 °C and 95 °C at a heating rate of 0.5 °CÆmin
)1
.
The reversibility of the thermal transition was evaluated by
several cycles of heating and cooling. The standard micro-
cal origin software was used for data acquisition and
analysis. The excess heat capacity functions were obtained
after subtraction of the buffer baseline.
Acknowledgements
We thank Dr G. Rivas from Centro de Investigaciones
Biolo
´
gicas, and G. Alvenius, Dr J. Lengqvist and Dr
H. Jo
¨
rnvall, Karolinska Institutet, for advice and
support. This research was supported by the Swed-
ish Research Council (project 10371), FORMAS to
J. Johansson and from the Ministerio de Educacio
´
ny
Ciencia (SAF2006-04434), Instituto de Salud Carlos III
(Ciberes-CB06 ⁄ 06 ⁄ 0002) and CAM (S-BIO-0260-2006)
to C. Casals.
References
1 Makin OS, Sikorski P & Serpell LC (2006) Diffraction
to study protein and peptide assemblies. Curr Opin
Chem Biol 10, 417–422.
2 Westermark P (2005) Aspects on human amyloid forms
and their fibril polypeptides. FEBS J 272, 5942–5949.
3 Johansson J (1998) Structure and properties of surfac-
tant protein C. Biochim Biophys Acta 1408, 161–172.
4 Beers MF & Mulugeta S (2005) Surfactant protein C
biosynthesis and its emerging role in conformational
lung disease. Annu Rev Physiol 67, 663–696.
5 Johansson J, Weaver TE & Tjernberg LO (2004) Pro-
teolytic generation and aggregation of peptides from
transmembrane regions: lung surfactant protein C and
amyloid beta-peptide. Cell Mol Life Sci 61, 326–335.
C. Casals et al. proSP-C structure and membrane interactions
FEBS Journal 275 (2008) 536–547 ª 2008 The Authors Journal compilation ª 2008 FEBS 545
6 Gustafsson M, Thyberg J, Naslund J, Eliasson E &
Johansson J (1999) Amyloid fibril formation by pul-
monary surfactant protein C. FEBS Lett 464, 138–
142.
7 Nogee LM, Dunbar AE III, Wert SE, Askin F, Hamvas
A & Whitsett JA (2001) A mutation in the surfactant
protein C gene associated with familial interstitial lung
disease. N Engl J Med 344, 573–579.
8 Thomas AQ, Lane K, Phillips J III, Prince M, Markin
C, Speer M, Schwartz DA, Gaddipati R, Marney A,
Johnson J et al. (2002) Heterozygosity for a surfactant
protein C gene mutation associated with usual intersti-
tial pneumonitis and cellular nonspecific interstitial
pneumonitis in one kindred. Am J Respir Crit Care
Med 165, 1322–1328.
9 Nogee LM (2002) Abnormal expression of surfactant
protein C and lung disease. Am J Respir Cell Mol Biol
26, 641–644.
10 Mulugeta S, Nguyen V, Russo SJ, Muniswamy M &
Beers MF (2005) A surfactant protein C precursor
protein BRICHOS domain mutation causes endoplas-
mic reticulum stress, proteasome dysfunction, and
caspase 3 activation. Am J Respir Cell Mol Biol 32,
521–530.
11 Bridges JP, Xu Y, Na CL, Wong HR & Weaver TE
(2006) Adaptation and increased susceptibility to infec-
tion associated with constitutive expression of misfolded
SP-C. J Cell Biol 172, 395–407.
12 Sanchez-Pulido L, Devos D & Valencia A (2002) BRI-
CHOS: a conserved domain in proteins associated with
dementia, respiratory distress and cancer. Trends
Biochem Sci 27, 329–332.
13 Westley BR, Griffin SM & May FE (2005) Interaction
between TFF1, a gastric tumor suppressor trefoil pro-
tein, and TFIZ1, a brichos domain-containing protein
with homology to SP-C. Biochemistry 44, 7967–7975.
14 Johansson H, Nordling K, Weaver TE & Johansson J
(2006) The Brichos domain-containing C-terminal part
of pro-surfactant protein C binds to an unfolded poly-
val transmembrane segment. J Biol Chem 281, 21032–
21039.
15 Hosia W, Johansson J & Griffiths WJ (2002) Hydro-
gen ⁄ deuterium exchange and aggregation of a poly-
valine and a polyleucine alpha-helix investigated by
matrix-assisted laser desorption ionization mass spec-
trometry. Mol Cell Proteomics 1, 592–597.
16 van den Heuvel RH & Heck AJ (2004) Native protein
mass spectrometry: from intact oligomers to functional
machineries. Curr Opin Chem Biol 8, 519–526.
17 Sobott F, Hernandez H, McCammon MG, Tito MA &
Robinson CV (2002) A tandem mass spectrometer for
improved transmission and analysis of large macro-
molecular assemblies. Anal Chem 74, 1402–1407.
18 Wang WJ, Russo SJ, Mulugeta S & Beers MF (2002)
Biosynthesis of surfactant protein C (SP-C). Sorting of
SP-C proprotein involves homomeric association via a
signal anchor domain. J Biol Chem 277, 19929–19937.
19 Hyatt BA, Resnik ER, Johnson NS, Lohr JL & Corn-
field DN (2007) Lung specific developmental expression
of the Xenopus laevis surfactant protein C and B genes.
Gene Expr Patterns 7, 8–14.
20 Nogee LM, Dunbar AE III, Wert S, Askin F, Hamvas
A & Whitsett JA (2002) Mutations in the surfactant
protein C gene associated with interstitial lung disease.
Chest 121, 20S–21S.
21 Diakowski W & Sikorski AF (1995) Interaction of
brain spectrin (fodrin) with phospholipids. Biochemistry
34, 13252–13258.
22 Gazit E, Boman A, Boman HG & Shai Y (1995)
Interaction of the mammalian antibacterial peptide
cecropin P1 with phospholipid vesicles. Biochemistry 34
,
11479–11488.
23 Frey S & Tamm LK (1990) Membrane insertion and
lateral diffusion of fluorescence-labelled cytochrome c
oxidase subunit IV signal peptide in charged and
uncharged phospholipid bilayers. Biochem J 272,
713–719.
24 Schuck P & Rossmanith P (2000) Determination of the
sedimentation coefficient distribution by least-squares
boundary modeling. Biopolymers 54, 328–341.
25 Schuck P, Perugini MA, Gonzales NR, Howlett GJ &
Schubert D (2002) Size-distribution analysis of proteins
by analytical ultracentrifugation: strategies and applica-
tion to model systems. Biophys J 82, 1096–1111.
26 Minton AP (1997) Alternative strategies for the charac-
terization of associations in multicomponent solutions
via measurement of sedimentation equilibrium. Prog
Colloid Polymer Sci 107, 11–19.
27 Cole JL (2004) Analysis of heterogeneous interactions.
Methods Enzymol 384, 212–232.
28 Laue TM, Shah BD, Ridgeway TM & Pelletier SL
(1992) Interpretation of analytical sedimentation data
for proteins. In Analytical Ultracentrifugation in
Biochemistry and Polymer Science (Harding SE, Rowe
AJ & Horton J, eds) pp. 99–125. Royal Society of
Chemistry, Cambridge.
29 Perczel A, Park K & Fasman GD (1992) Analysis of
the circular dichroism spectrum of proteins using the
convex constraint algorithm: a practical guide. Anal
Biochem 203, 83–93.
30 Lakowicz J (1999) Principles of Fluorescence Spectros-
copy, 2nd edn. Kluwer Academic ⁄ Plenum Publishers,
New York, NY.
Supplementary material
The following supplementary material is available
online:
Fig. S1. Analysis of CTC disulfide bridges.
proSP-C structure and membrane interactions C. Casals et al.
546 FEBS Journal 275 (2008) 536–547 ª 2008 The Authors Journal compilation ª 2008 FEBS
Fig. S2. Effects of temperature on CTC secondary
structure.
Fig. S3. Binding of bis-ANS to CTC.
This material is available as part of the online article
from
Please note: Blackwell Publishing are not responsible
for the content or functionality of any supplementary
materials supplied by the authors. Any queries (other
than missing material) should be directed to the corre-
sponding author for the article.
C. Casals et al. proSP-C structure and membrane interactions
FEBS Journal 275 (2008) 536–547 ª 2008 The Authors Journal compilation ª 2008 FEBS 547