Báo cáo khoa học: Two L-amino acid oxidase isoenzymes from Russell’s viper (Daboia russelli russelli) venom with different mechanisms of inhibition by substrate analogs pdf
Bạn đang xem bản rút gọn của tài liệu. Xem và tải ngay bản đầy đủ của tài liệu tại đây (788.88 KB, 18 trang )
Two L-amino acid oxidase isoenzymes from Russell’s viper
(Daboia russelli russelli) venom with different mechanisms
of inhibition by substrate analogs
Somnath Mandal and Debasish Bhattacharyya
Division of Structural Biology and Bioinformatics, Indian Institute of Chemical Biology, Kolkata, India
The flavoenzyme l-amino acid oxidase (LAAO;
EC 1.4.3.2) is a major constituent of many snake ven-
oms. This enzyme catalyzes oxidative deamination of
l-amino acid substrates to a-keto acids in a stereospe-
cific mode. The catalytic cycle begins with the reduc-
tive half-reaction involving the conversion of FAD
(flavin cofactor) to FADH
2
and concomitant oxidation
of the amino acid to an imino acid. The imino acid
intermediate of the oxidation pathway undergoes
nonenzymatic hydrolysis to yield the respective a-keto
acid and ammonia. An oxidative half-reaction
completes the catalytic cycle by reoxidizing FADH
2
Keywords
enzyme kinetics; inhibitor cross-competition;
flavoenzyme;
L-amino acid oxidase; mixed
inhibition
Correspondence
D. Bhattacharyya, Division of Structural
Biology and Bioinformatics, Indian Institute
of Chemical Biology, Kolkata 700032, India
Fax: 91 33 2473 5197 ⁄ 0284
Tel: 91 33 2473 3491 x 164
E-mail:
(Received 1 January 2008, revised 25 Febru-
ary 2008, accepted 27 February 2008)
doi:10.1111/j.1742-4658.2008.06362.x
Two isoforms, L
1
and L
2
,ofl-amino acid oxidase have been isolated from
Russell’s viper venom by Sephadex G-100 gel filtration followed by CM-
Sephadex C-50 ion exchange chromatography. The enzymes, with different
isoelectric points, are monomers of 60–63 kDa as observed from size exclu-
sion HPLC and SDS ⁄ PAGE. Partial N-terminal amino acid sequencing of
L
1
and L
2
showed significant homology with other snake venom l-amino
acid oxidases. Both the enzymes exhibit marked substrate preference for
hydrophobic amino acids, maximum catalytic efficiency being observed
with l-Phe. Inhibition of L
1
and L
2
by the substrate analogs N-acetyltry-
ptophan and N-acetyl-l-tryptophan amide has been followed. The initial
uncompetitive inhibition of L
1
followed by mixed inhibition at higher con-
centrations suggested the existence of two different inhibitor-binding sites
distinct from the substrate-binding site. In the case of L
2
, initial linear com-
petitive inhibition followed by mixed inhibition suggested the existence of
two nonoverlapping inhibitor-binding sites, one of which is the substrate-
binding site. An inhibition kinetic study with O-aminobenzoic acid, a mim-
icking substrate with amino, carboxylate and hydrophobic parts, indicated
the presence of three and two binding sites in L
1
and L
2
, respectively,
including one at the substrate-binding site. An inhibitor cross-competition
kinetic study indicated mutually excluding binding between N-acetyltrypto-
phan, N-acetyl-l-tryptophan amide and O-aminobenzoic acid in both the
isoforms, except at the substrate-binding site of L
1
. Binding of substrate
analogs with different electrostatic and hydrophobic properties provides
useful insights into the environment of the catalytic sites. Furthermore, it
predicts the minimum structural requirement for a ligand to enter and
anchor at the respective functional sites of LAAO that may facilitate the
design of suicidal inhibitors.
Abbreviations
LAAO,
L-amino acid oxidase; NAT, N-acetyltryptophan; NATA, N-acetyl-L-tryptophan amide; OAB, O-aminobenzoic acid; PBE, polybuffer
exchanger; PLA
2
, phospholipase A
2
; RVV, Russell’s viper venom.
2078 FEBS Journal 275 (2008) 2078–2095 ª 2008 The Authors Journal compilation ª 2008 FEBS
with molecular oxygen, producing hydrogen peroxide
(Scheme 1). The redox catalytic cycle of the enzyme
has been well documented in the literature [1–3]. The
preferred substrates of these enzymes are aromatic or,
more generally, hydrophobic amino acids. Deamina-
tion of polar and basic amino acids proceeds at a
much lower rate [3,4].
So far, LAAOs from bacterial, fungal and plant
sources have been proposed to be involved in the utili-
zation of nitrogen sources [5,6]. The role of this
enzyme in snake venom is not fully understood.
Venom LAAOs act as potential toxins, as they cause
impairment of platelet aggregation together with
induction of necrotic and apoptotic cell death [4]. The
cytotoxicity of LAAO is primarily attributed to hydro-
gen peroxide produced during the substrate turnover
[7,8]. Recently, LAAO from the Malayan pit viper has
been shown to induce both necrosis and apoptosis in
Jurkat cells, where the role of hydrogen peroxide was
well established by scavenging it with catalase. Dock-
ing of LAAO on the cell surface and subsequent inter-
nalization has been proposed to be the inherent
mechanism for induction of apoptosis [9]. The evidence
to date implicates the glycan moiety of LAAO for the
docking onto the host cell that enhances localization
of high concentrations of hydrogen peroxide. The
mode of hydrogen peroxide delivery has been sug-
gested to be an important factor for efficient and
tissue-specific induction of apoptosis [7,10].
Apart from mechanistic studies, the crystal structure
of LAAO from Calloselasma rhodostoma complexed
with l-Phe has been recently solved at 1.8 A
˚
resolution
[11]. It predicted deprotonation of the a-NH
3
+
group
of the substrate by His223 of the enzyme and subse-
quent movement of the lone pair of electrons from
NH
2
to the a-C atom, which activates the substrate to
transfer the hydride from a-C to N-5 of the flavin moi-
ety to yield the imino acid and FADH
2
[11]. The struc-
ture of the catalytic site of LAAO in complex with
two different inhibitors indicates that the site is buried
deep inside the molecule [12]. Each subunit of the
dimeric enzyme is composed of three parts: an FAD-
binding domain, a substrate-binding domain, and a
helical domain. The interface between the substrate-
binding and helical domains forms a 25 A
˚
long funnel
providing access to the active site. Binding sites and
orientations of O-aminobenzoic acid (OAB) (a sub-
strate analog without the a-C
H
that is necessary for
hydride transfer) within the catalytic funnel suggest the
probable role of electrostatic and hydrophobic parts in
the trajectory of the substrate to the active site. How-
ever, the importance of complementary electrostatic
and hydrophobic surfaces in the inhibitor molecule for
successful inhibition of enzymatic activity remains to
be evaluated.
Envenomation by Russell’s viper followed by death
is a WHO-identified occupational hazard for paddy
growers of Southeast Asian countries [13]. Currently,
application of antivenom is the only mode of treat-
ment, and the success rate varies to a large extent. For
better snakebite management, it is our long-term aim
to isolate and characterize different toxins. These
include hemorrhagins such as VRR-22 [14], VRR-12
[15], VRR-76 [16] and Russell’s viper venom (RVV)-7,
a cytotoxin with phospholipase A
2
(PLA
2
) activity [17]
that also acts as a renal tubular necrosis factor [18].
Empirical assay protocols for hemorrhage and PLA
2
activity that are suitable for snake venoms have also
been developed [19,20]. Here we report the purification
and preliminary characterization of two LAAO iso-
forms from RVV and demonstrate for the first time
that they contain two or three inhibitor-binding sites
in solution. Derived N-terminal sequences of the two
isoforms have shown a good degree of homology to
LAAO from other snake venoms. A recent molecular
and comparative structural analysis of Bothrops jarara-
cussu and Bothrops moojeni having 83–87% sequence
identities with other snake venom LAAOs indicated a
high degree of structural similarity in the main regions,
such as the FAD-binding, substrate-binding and helical
domains, with those of Ca. rhodostoma LAAO [21].
Our observations regarding the inhibition kinetics of
LAAO from RVV were compared with the crystal
structure of Ca. rhodostoma LAAO, based on similar
H
2
O
2
H
2
O
E-FADH
2
E-FAD
O
2
NH
3
NH
3
NH
+
R
C
R
C
R
C
H
COO
–
COO
–
COO
–
O
Scheme 1. Reaction mechanism of LAAO.
S. Mandal and D. Bhattacharyya Inhibitor-binding sites of
L-amino acid oxidase
FEBS Journal 275 (2008) 2078–2095 ª 2008 The Authors Journal compilation ª 2008 FEBS 2079
substrate specificity and number of inhibitor-binding
sites. The insights gained are likely to be useful in
designing suicidal inhibitors in future [22].
Results
Purification and characterization of LAAO
Crude RVV was resolved into four major peaks on a
Sephadex G-100 gel filtration column, LAAO activity
being eluted in the first peak (Fig. 1A). Recovery of
activity was 80%. The pooled portion was further
fractionated by CM-Sephadex C-50 chromatography,
using an NaCl gradient of 0–0.1 m at pH 7.2 (Fig. 1B).
Bound LAAO activity was released near the end of the
gradient in two partially overlapping fractions. They
were collected (the middle fractions were discarded),
and termed L
1
and L
2
. Homogeneity of the fractions
was demonstrated by SDS ⁄ PAGE followed by silver
staining, where they appeared as single bands of equal
migration (Fig. 1B, inset). Development of the gel with
glycoprotein staining solution appeared to be positive
(result not shown). Final recoveries of LAAO activity
in L
1
and L
2
were 22% and 18%, respectively. Separa-
tion of the two isoforms into two peaks by CM-Sepha-
dex C-50 cation exchange chromatography indicated
A C
B D
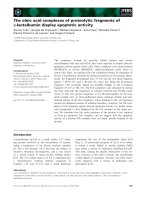
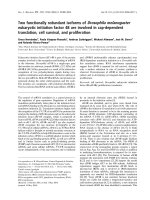
Fig. 1. Purification and characterization of L
1
and L
2
from RVV. (A) Chromatogram showing elution of LAAO from Sephadex G-100
(117 · 1.2 cm) column. Twenty-one milligrams of RVV, equivalent to 15 mg of protein was applied. Elution of protein was followed at
280 nm and LAAO by a coupled assay at 436 nm using
L-Phe as substrate. Fractions with LAAO activity were pooled and applied to a CM-
Sephadex C-50 column (2 · 10 cm) pre-equilibrated with 20 m
M potassium phosphate buffer (pH 7.4). (B) Bound fractions were eluted after
application of 0–0.1
M NaCl (dotted line). Elution of proteins and of LAAO were followed as stated earlier. Indicated areas of L
1
and L
2
peaks
were pooled. Inset: 10% SDS ⁄ PAGE profiles of the pooled L
1
and L
2
fractions, showing a single band corresponding to 60 kDa with respect
to standard molecular mass markers, the positions of which have been indicated on the left. (C) Chromatofocusing of the LAAO activity
eluted from a Sephadex G-100 column. The sample was loaded on a PBE 96 column pre-equilibrated with 25 m
M Tris ⁄ acetate (pH 8.3). The
sample was eluted with 0.0072 mmolÆpH unit
)1
ÆmL
)1
PBE 96 (pH 6) at a flow rate of 12 mLÆh
)1
. LAAO activity and the pH of each 1.5 mL
fraction were measured separately. (D) Size exclusion HPLC of L
1
and L
2
using a Waters Protein Pak 300 column (fractionation range
10–400 kDa). The flow rate was 0.8 mLÆmin
)1
. Elution of L
1
and L
2
at 9.01 ± 0.05 and 9.23 ± 0.06 min are marked. Inset: calibration curve
of the column, using standard molecular mass markers as described in the text. Upward and downward arrows indicate the positions of L
1
and L
2
, respectively.
Inhibitor-binding sites of
L-amino acid oxidase S. Mandal and D. Bhattacharyya
2080 FEBS Journal 275 (2008) 2078–2095 ª 2008 The Authors Journal compilation ª 2008 FEBS
different pI values. The difference was further analyzed
by chromatofocusing of the LAAO from Sepha-
dex G100 chromatography. This resulted in the separa-
tion of LAAO activity into two peaks corresponding
to pH 7.49 ± 0.06 and pH 7.26 ± 0.04 (Fig. 1C). As
compared to nonglycosylated proteins, the peaks are
broader but not diffused to a large extent. A low level
of glycosylation and homogeneity of the glycosydic
part, as has been reported in the case of Ca. rhodos-
toma LAAO [23], might be the cause of the chromato-
focusing features for both the isoforms.
Molecular mass
Purified L
1
and L
2
appeared in SDS ⁄ PAGE with a
molecular mass corresponding to 60 kDa by reference
to standard markers. In size exclusion HPLC, L
1
and
L
2
were eluted from a Protein Pak 300 A
˚
column
as single symmetrical peaks at 9.01 ± 0.05 and
9.23 ± 0.06 min, respectively. These corresponded to
63 and 60 kDa by reference to a calibration curve
(Fig. 1D). Thus, the enzymes appeared to exist as
monomers under the conditions of storage.
N-terminal sequencing
Derived amino acid sequences up to the 20th residue
from N-termini of L
1
and L
2
, obtained using Edman
degradation, were ADDINPKEECFFEDDYYEFE
and ADDKNPLEECFCEDDDYCEG, respectively.
These sequences are 70% homologous to each other.
Chromatograms of the released amino acid derivatives
indicated that the analyzed samples were homogeneous
and free from cross-contamination. Homology analysis
of these sequences using the NCBI blastp program
indicated up to 93% similarity with LAAO from other
snake venoms (Table 1). Both L
1
and L
2
have shown
more than 60% homology with LAAO from Ca. rho-
dostoma, for which an X-ray crystallographic structure
is available. This sequence similarity indicates probable
structural and functional similarity between the
enzymes.
Identification of cofactor
The absorption spectra between 300 and 600 nm of
holo-LAAO from the active fractions of Sephadex G-
100 chromatography containing a mixture of L
1
and
L
2
, the isolated cofactor after dissociation from the
enzyme and standard FAD are shown in Fig. 2A. In
each spectrum, two peaks of comparable intensity were
observed. The corresponding maxima were at 390 and
475 nm, 375 and 450 nm, and 370 and 450 nm, respec-
tively. The spectral features of the dissociated cofactor
were similar to those of FAD. The shifting of absorp-
tion maxima of the enzyme-bound flavin was due to
its microenvironment. The RP-HPLC profiles of the
cofactor dissociated by heat and of reference FAD are
shown in Fig. 2B. This illustrates that, under the chro-
matographic conditions used, a single component was
eluted at 10.59 ± 0.07 min in either case. Extension of
the gradient up to 100% methanol failed to elute any
additional component from the enzyme extract.
The HPLC fractions of reference FAD and the co-
factor were collected and analyzed by ESI MS. The
abundance of FAD intact ions (830.32 Da) was only
20%, whereas a 413.35 Da [riboflavin, C
17
H
20
N
4
O
6
(376.36) + K
+
(39)]
+1
peak appeared with 70% abun-
dance. The mass spectrum of the cofactor did not pro-
duce any peak corresponding to 830 Da, but signals of
m ⁄ z 415 and 317.2 [C
15
H
16
N
4
O
4
(316.12) + H
+
]
+1
were present in greater abundance. These peaks might
have resulted from the fragmentation of intact FAD
during ionization. Quantification of enzyme-bound
FAD was done from the absorption spectrum of the
dissociated cofactor (e
462
= 1.14 · 10
4
m
)1
cm
)1
). The
derived stoichiometry was 1.25 ± 0.03 ⁄ monomer. In a
control set, it was confirmed that the presence of 0.1%
SDS did not affect the spectrum of FAD.
Enzymatic properties
L
1
and L
2
have shown substrate preferences for hydro-
phobic, particularly aromatic, amino acids, of which
l-Phe was the best. Table 2 summarizes the catalytic
efficiency, i.e. the ratio of turnover number and K
m
,of
L
1
and L
2
for different substrates. The specific activi-
ties of L
1
and L
2
with l-Phe were found to be 8.96 ±
1.88 and 6.94 ± 1.25 lmolÆmin
)1
Æmg
)1
, respectively.
Table 1. Sequence homology of L
1
and L
2
(Daboia russelli russelli)
with LAAOs from other snake venom sources. Swiss Prot entry
names of respective LAAOs are presented in parentheses.
LAAO source organism
Homology (%)
L
1
L
2
Vipera berus berus (OXLA_VIPBB) 78 93
Gloydius blomhoffi j(OXLA_AGKHA) 73 80
B. jararcassu (OXLA_BOTJR) 73 80
B. moojeni (OXLA_BOTMO) 73 80
Macrovipera labetina (OXLA_VIPLE) 78 93
Crotalus durissus (OXLA_CRODC) 68 73
Gloydius halys (OXLA_AGKHP) 68 73
Crotalus atrox (OXLA_CROAT) 68 73
Crotalus adamanteus (OXLA_CROAD) 68 73
Ca. rhodostoma (OXLA_AGKRH) 68 64
S. Mandal and D. Bhattacharyya Inhibitor-binding sites of
L-amino acid oxidase
FEBS Journal 275 (2008) 2078–2095 ª 2008 The Authors Journal compilation ª 2008 FEBS 2081
The catalytic efficiency of L
1
on l-Tyr was close to
that on l-Phe, but L
2
oxidized l-Tyr with poor cata-
lytic efficiency. The hydrophobic amino acids with sur-
face area smaller than 185 A
˚
2
acted as poor substrates,
and catalytic efficiencies with amino acids of surface
area £ 155 A
˚
2
were not detectable. On the other hand,
l-Trp, with a hydrophobicity index between those of
l-Phe and l-Tyr but with a lower surface area
(255 A
˚
2
), had turnover efficiencies 2.2-fold and 2.8-fold
less than that of l-Phe in the cases of L
1
and L
2
,
respectively. Amino acids with polar or charged side
chains are excluded from Table 1, as their oxidation
was not detectable.
pH and thermal stability
High-pH inactivation, as observed for LAAO from
Calloselasma adamenteus [24], was assessed for L
1
and
L
2
after exposing them to pH 4.2–10 for 1 h at 25 °C.
Both enzymes retained 100% activity between pH 6.5
and pH 8.8. Drastic inactivation was observed above
and below this range. The enzymes were exposed to
different temperatures between 30 °C and 100 °C for
10 min to determine their thermal stability. Both were
stable up to 50 °C but were sharply inactivated above
60 °C.
Selection of inhibitors
Interaction of L
1
and L
2
with substrate analogs was
investigated, with the expectation that the kinetic anal-
ysis would reflect the inhibitor trajectory in the func-
tional molecule. Crystallographic data indicated that
the hydrophobic and electrostatic parts of the ligand
might play crucial roles in the orientation and binding
of the molecules in the catalytic funnel of the enzyme.
350
0.01
0.03
0.05
0.07
0.09
A B
0.006
0.004
0.002
0.00
0.00 5.00 10.00
Time
(
min
)
15.00 20.00
0
30
% Methanol
60
90
10.59 ± 0.07
1
2
2
1
3
400 450
Wavelength (nm)
Absorbance
A
450 nm
500 600
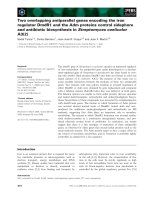
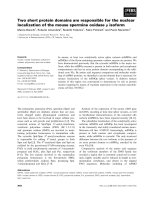
Fig. 2. Characterization of flavin cofactor. (A) UV–visible absorption spectrum between 300 and 600 nm of enzyme-bound cofactor of: (1) the
sample obtained from gel filtration chromatography; (2) cofactor separated from the enzyme after heat denaturation in the presence of SDS;
and (3) standard FAD. (B) RP-HPLC profiles of: (1) standard FAD; and (2) cofactor extracted from the enzyme after gradual heating. Fractions
were eluted only in a 15–75% methanol gradient developed between 5 and 20 min. A description of the experiment is provided in the text.
Table 2. Substrate specificity of L
1
and L
2
. ND, not detectable.
Substrate Hydrophobicity
a
Surface
area (A
˚
2
)
b
K
m
(M)
Catalytic efficiency
(mol
)1
Æs
)1
) · 10
4
L
1
L
2
L
1
L
2
L-Phe +2.8 210 66.5 · 10
)6
49.3 · 10
)6
14.06 15.17
L-Tyr )1.3 230 52.0 · 10
)6
538.2 · 10
)6
12.62 1.13
L-Trp )0.9 255 210.9 · 10
)6
235.1 · 10
)6
6.41 5.51
LMet +1.9 185 297.3 · 10
)6
222.8 · 10
)6
5.68 7.14
L-Leu +3.8 170 750.8 · 10
)6
599.7 · 10
)6
4.32 2.03
L-Ile +4.5 175 1.44 · 10
)3
1.89 · 10
)3
0.88 0.65
L-Val +4.2 155 ND ND – –
L-Ala +1.8 115 ND ND – –
a
Hydrophobicity indices [45].
b
Accessible surface area for residues as part of a polypeptide chain [42].
Inhibitor-binding sites of
L-amino acid oxidase S. Mandal and D. Bhattacharyya
2082 FEBS Journal 275 (2008) 2078–2095 ª 2008 The Authors Journal compilation ª 2008 FEBS
With both enzymes, the preference for aromatic amino
acids indicated that the aromatic ring offers a better fit
at the substrate-binding site. Therefore, to analyze the
roles of different parts of the inhibitor, a set of good
substrate analogs was chosen from the laboratory
chemical library. Table 3, showing substrate specificity,
indicates that tryptophan is a good substrate for both
the enzymes. Acetylation of the amino group and ami-
dation of the carboxylate group in Trp result in a sub-
strate analog N-acetyl-l-tryptophan amide (NATA)
with neutralized charged groups, whereas N-acetyltry-
ptophan (NAT) bears a carboxylate group that is free
for interaction. The importance of the amino and car-
boxylate groups could only be assessed with substrate
analogs that do not have the a-CH in both the groups
necessary for hydride transfer. OAB is a good sub-
strate analog for this purpose. The structures of these
inhibitors are shown in Table 3.
Inhibition by NATA
Assuming that the aromatic rings of the amino acids
could play crucial roles in substrate anchoring, NATA
is expected to compete with the substrate. In reality,
NATA between 0 and 135 lm showed uncompetitive
rather than competitive inhibition in L
1
. At higher
concentrations up to 540 lm, a mixed inhibition pat-
tern appeared (Fig. 3A). The uncompetitive inhibition
arose if the inhibitor combined only with the enzyme–
substrate complex, i.e. when there was no binding site
for the inhibitor until a substrate bound to the enzyme
[25]. The inhibition pattern of Fig. 3A has been
described as mixed inhibition by some authors and
noncompetitive by others [26,27]. Alternatively, the
term mixed inhibition has been conferred on a special
type of noncompetitive inhibition where K
I
„ K
IS
.
This results in double reciprocal plots for different
inhibitor concentrations that intersect either above or
below the abscissal axis [25]. The mixed inhibition pat-
tern appears when the inhibitor combines with both
enzyme and enzyme–substrate forms with different
affinities and the binding sites are physically separated
from the substrate-binding site. In principle, if
K
I
>K
IS
, the inhibition has both noncompetitive and
uncompetitive characteristics [25]. The presence of a
complex inhibition pattern with a distinct uncompeti-
Table 3. Summary of inhibition constants of L
1
and L
2
. ND, not detected, as inhibition constants for three inhibitor-binding sites cannot be
determined from kinetic data. NA, not applicable.
Ligand
L
1
L
2
K
I
(lM)
a
K
IS
(lM)
b
K
I
(lM) K
IS
(lM)
L-Phenylalanine (L-Phe)
NA NA NA NA
N-acetyl tryptophan amide (NATA)
591.6 ± 8.6 384.6 ± 4.6 378.8 ± 5.6 744.8 ± 6.4
N-acetyl tryptophan (NAT)
127.5 ± 2.3 93.5 ± 1.6 114.6 ± 2.7 200.14 ± 3.1
O -aminobenzoic acid (OAB)
ND ND 11.89 ± 0.5 25.44 ± 0.8
a
Inhibition constant for free enzyme.
b
Inhibition constant for enzyme–substrate complex.
S. Mandal and D. Bhattacharyya Inhibitor-binding sites of
L-amino acid oxidase
FEBS Journal 275 (2008) 2078–2095 ª 2008 The Authors Journal compilation ª 2008 FEBS 2083
tive nature at lower NATA concentrations indicates
the involvement of two inhibition mechanisms; we
therefore prefer to call it mixed inhibition. The inter-
section of double reciprocal plots at 270–540 lm
occurred in the lower left-hand quadrant. The kinetic
constants for inhibition summarized in Table 2 show
that, in this case, K
I
was 1.5-fold higher than K
IS
; thus,
the mixed inhibition pattern consisted of noncompeti-
tive and uncompetitive components. The presence of a
mixed inhibition pattern with uncompetitive and non-
competitive characteristics suggests that two NATA
molecules bind to L
1
at two sites other than the sub-
strate-binding site.
Inhibition of L
2
by NATA followed a mixed inhibi-
tion pattern at 0–1344 lm NATA, with an initial
competitive inhibition pattern between 0 and 220 lm
(Fig. 3B). The competitive pattern was examined sepa-
rately in detail (Fig. 3C), focusing on the effect of
inhibitor concentrations on the slopes of double reci-
procal plots. In principle, a hyperbolic slope replot
would indicate that the inhibitor binds to a site on
the enzyme other than the substrate-binding site, to
show uncompetitive inhibition, as NATA did with L
1
,
and in doing so causes a reduction in K
m
with an
unaltered V
max
. Parabolic competitive inhibition is
obtained if binding of one inhibitor molecule at the
active site facilitates binding of the second inhibitor
molecule, so that two molecules of inhibitor contrib-
ute to the exclusion of the substrate. On the other
hand, a linear slope replot would indicate that a sin-
gle inhibitor molecule binds at the substrate-binding
site, resulting in classic competitive inhibition [25].
The pattern of competitive inhibition by NATA was
verified by employing six inhibitor concentrations
ranging from 22 to 220 lm and examining the effect
of inhibitor concentration on the slope of the double
–40 –20 0
0
40
80
120
20 40
1 / [
L-phe] M
–1
x 10
3
1 / v (µM/min)
–1
x 10
–2
60 0 50 150
[NATA]
µ
M
250
–40 –20 0
0
40
80
C
120
(L
1
+ NATA) A B
C D
(L
2
+ NATA)
(L
2
+ NATA)
(Slope replot)
20 40
1 / [
L-phe] M
–1
x10
3
1 / v (µM/min)
–1
x 10
–2
1 / v (µM/min)
–1
x 10
–2
K
m
/V
max
(min) x 10
–3
60 –40
2.0
1.6
1.2
0.8
0.4
0
–20 0
0
50
150
250
20 40
1 / [
L-phe] M
–1
x 10
3
60
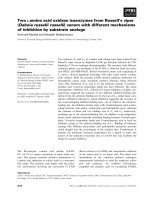
Fig. 3. Inhibition of L
1
and L
2
by NATA. (A) Double reciprocal plots of inhibition of L
1
by 0 lM (e), 105 lM (h), 135 lM (D), 270 lM ( ),
405 l
M ( ) and 540 lM ( ) NATA. (B) Double reciprocal plots of inhibition of L
2
by 0 lM (e), 220 lM (h), 448 lM (D), 896 lM (·) and
1344 l
M ( ) NATA. (C) The bracketed area of (B) showing competitive inhibition was further analyzed with 0 lM (e), 22 lM (h), 44 lM (D),
88 l
M (·), 132 lM ( ), 176 lM ( ) and 220 lM (+) NATA. (D) Replot of the slopes of (C) against the concentration of NATA. The steady-state
kinetic experiments described in Figs 4–7 were carried out at 25 °C in 0.05
M potassium phosphate buffer (pH 6.8) containing 20–100 lM
L
-Phe as substrate and 30 nM L
1
or L
2
. Arrows in all figures indicate points of intersection.
Inhibitor-binding sites of
L-amino acid oxidase S. Mandal and D. Bhattacharyya
2084 FEBS Journal 275 (2008) 2078–2095 ª 2008 The Authors Journal compilation ª 2008 FEBS
reciprocal plot. Importantly, the slope replot was lin-
ear, consistent with the classic competitive inhibition
model, where one molecule of NATA interacts with
the substrate-binding site (Fig. 3D). At higher concen-
trations of NATA (448–1344 lm), the pattern changed
from competitive to mixed inhibition, with K
IS
being
about two-fold higher than K
I
(Table 2). Mixed inhi-
bition with K
IS
> K
I
is known to contain both com-
petitive and noncompetitive components [25]. Mixed
inhibition of L
2
by NATA with initial competitive
inhibition suggests that NATA binds at two different
sites, of which the substrate-binding site has higher
affinity.
Inhibition by NAT
Inhibition of L
1
by NAT occurs in two phases: an
uncompetitive phase between 0 and 11 lm, followed
by mixed inhibition up to 120 lm (Fig. 4A). The dou-
ble reciprocal plots corresponding to inhibitor concen-
trations producing a mixed inhibition pattern intersect
with that of 0 lm in the lower left-hand quadrant,
indicating that K
I
> K
IS
. Inhibition by NAT between
0 and 11 lm showed an uncompetitive profile. This
was in good correlation with expected lower K
IS
.
Increasing the concentration of NAT up to 120 lm
favored its binding to both enzyme and enzyme–sub-
strate complex, resulting in a mixed inhibition pattern
with uncompetitive and noncompetitive components.
This pattern of L
1
was similar to that with NATA,
except that K
I
and K
IS
for NAT were 4.6-fold and
4.1-fold lower (Table 2). This indicated that the avail-
ability of the carboxyl group facilitates the binding of
NAT at uncompetitive and noncompetitive binding
sites, but that the aromatic ring and the carboxyl
group together are not sufficient for anchoring at the
substrate-binding site.
Inhibition of L
2
by NAT also occurred in two
phases: it was competitive up to 22 lm, after which
there was mixed inhibition up to 88 lm (Fig. 4B). The
point of intersection of double reciprocal plots ranging
from 44 to 66 lm NAT occurred in the upper left-
hand quadrant, indicating that K
I
< K
IS
. Shifting of
the initial competitive pattern at 22 lm to a mixed
inhibition pattern with an increase in the NAT concen-
tration up to 88 lm results from the binding of the
inhibitor to both enzyme and enzyme–substrate com-
plex. Therefore, the mixed inhibition appeared as a
combination of competitive and uncompetitive pat-
terns. Three-fold lower K
I
and K
IS
values of NAT as
compared to NATA suggest a positive role for the car-
boxyl group in binding of the inhibitor to the respec-
tive sites (Table 2).
Inhibition by OAB
The inhibitory profiles of substrate analogs studied so
far indicate that the aromatic part of the inhibitor,
which was sufficient for anchoring at the substrate-
binding site of L
2
, leads instead to anchoring at other
sites in L
1
. In both enzymes, the carboxylate group of
the inhibitors improved the affinity for the respective
sites. To determine the importance of the amino group
for ligand anchoring, the inhibition kinetics of OAB
were investigated. The intersection of double reciprocal
plots for L
1
at different concentrations of OAB
occurred at three different points (Fig. 5A). The first
Fig. 4. Inhibition of L
1
and L
2
by NAT. (A) Double reciprocal plots
of inhibition of L
1
by 0 lM (e), 11 lM (D), 22 lM (s), 44 lM ( ),
88 l
M ( ) and 120 lM (+) NAT. (B) Double reciprocal plots for inhi-
bition of L
2
by 0 lM ( ), 22 lM ( ), 44 lM ( ), 66 lM (·) and 88 lM
(:) NAT.
S. Mandal and D. Bhattacharyya Inhibitor-binding sites of
L-amino acid oxidase
FEBS Journal 275 (2008) 2078–2095 ª 2008 The Authors Journal compilation ª 2008 FEBS 2085
point of intersection at 5 lm occurred on the ordinal
axis, consistent with the competitive inhibition pattern.
Upon increase of the OAB concentration to 10 lm, the
point of intersection shifted from the ordinal axis to
the upper left-hand quadrant, showing mixed inhibi-
tion with competitive and noncompetitive components.
This indicates that another OAB molecule binds at a
site physically separated from the substrate-binding
site. A further increase of the OAB concentration to
25 lm shifted the point of intersection back towards
the ordinal axis, showing an unusual inhibition pat-
tern. This can happen only when a third OAB mole-
cule binds at another site affecting both the K
m
and
the V
max
. Binding of three OAB molecules per enzyme
is consistent with the crystal structure of Ca. rhodos-
toma LAAO complexed with OAB [12].
The effect of different inhibitor concentrations on
the slopes of double reciprocal plots for competitive
inhibition was analyzed in a different experiment,
using 1–5 lm OAB to confirm the mechanism of com-
petitive inhibition (Fig. 5B). Importantly, a replot of
the slopes as a function of OAB concentration was lin-
ear (Fig. 5C), indicating a classic competitive model, in
which one inhibitor binds at the substrate-binding site.
The double reciprocal plot of the inhibition kinetics
of L
2
at different concentrations of OAB is depicted in
Fig. 6A. The points of intersection of the double reci-
procal plots up to 20 lm indicate that OAB inhibited
L
2
following a mixed inhibition pattern containing an
initial competitive component at 3 lm (Fig. 6B), simi-
lar to the mechanism of inhibition by NATA and
NAT. The replot of slopes as a function of inhibitor
concentration indicated classic competitive inhibition
(Fig. 6C). At higher concentrations of OAB, between
10 and 20 lm, the point of intersection shifted to the
upper left-hand quadrant and remained fixed (). A
mixed inhibition pattern without further shifting of the
intersection point suggests the presence of only two
binding sites for OAB in L
2
. Taken together, these
data indicate that the number of inhibitor-binding sites
in L
2
is two, whereas it is three in L
1
.
Inhibitor cross-competition kinetics
The substrate analogs used for predicting modes of
inhibition of L
1
and L
2
showed similar mechanisms,
except for OAB. The crystallographic structure of the
LAAO–OAB complex exhibited three OAB-binding
sites at the catalytic funnel. Assuming that OAB also
binds in the catalytic funnels of L
1
and L
2
, these
binding sites were compared with those of NATA and
NAT by inhibitor cross-competition kinetics, to deter-
mine whether enzyme inhibition in the presence of
Fig. 5. Inhibition of L
1
by OAB. (A) Double reciprocal plots of inhibi-
tion by 0 l
M ( ), 5 lM ( ), 10 lM ( ), 20 lM (·) and 25 lM ( ) OAB.
(B) The region indicating competitive inhibition was analyzed further
by 0 l
M ( ), 1 lM ( ), 4 lM ( ) and 5 lM (·) OAB. (C) Replot of the
slopes of (B) against the concentration of OAB.
Inhibitor-binding sites of
L-amino acid oxidase S. Mandal and D. Bhattacharyya
2086 FEBS Journal 275 (2008) 2078–2095 ª 2008 The Authors Journal compilation ª 2008 FEBS
two inhibitors arises from simultaneous binding to
independent sites or from mutually exclusive binding
to a single site or even overlapping sites on the
enzyme [28]. For this, binary combinations of
OAB ⁄ OAB, OAB ⁄ NAT and OAB ⁄ NATA were
applied to L
1
and L
2
, considering OAB as inhibitor 1
(I
1
) and OAB, NAT and NATA as inhibitor 2 (I
2
). In
these experiments, the substrate concentration was
held constant throughout, with different sets contain-
ing variable concentrations of OAB as I
1
. Corre-
sponding to each set of [I
1
] values, OAB, NAT and
NATA concentrations were varied as I
2
. The data
were analyzed by plotting the reciprocal of initial
velocities as a function of [I
1
] to visualize the effect
on slope while [I
2
] was varied.
Variation of OAB concentration in both directions
in a binary combination, i.e. I
1
and I
2
, was first per-
formed on L
1
to validate cross-competition in this sys-
tem. As anticipated, variation of OAB concentration
from 0 to 10 lm in one direction, I
2
, had an effect on
the slopes of the reciprocal dependencies obtained
from variation of OAB concentration in the second
direction, I
1
, between 0 and 5 lm. This was because
10 lm OAB was not sufficient to saturate all three
binding sites (Fig. 7A). The reciprocal dependencies
between the sets of 10 and 20 lm of OAB as I
2
eventu-
ally became parallel with the one where [I
2
] = 0 as all
the binding sites of OAB became saturated. The initial
appearance and subsequent disappearance of the slope
effect with increasing concentrations of OAB as I
2
is
consistent with the sequential saturation of the three
binding sites. The reciprocal plots of the cross-compe-
tition between OAB (0–35 lm as I
2
) and NATA (0–
122.5 lm as I
1
) showed a complicated intersecting pat-
tern, as NATA could not compete with OAB for all of
its binding sites (Fig. 7B). At 5 lm OAB, only the sub-
strate-binding site was occupied, leaving other sites
free for binding to NATA, and this produced a slope
effect. The point of intersection between 0 and 5 lm
OAB shifted further towards the left with increasing
concentrations of OAB between 5 and 25 lm. After
saturation of three binding sites by OAB at 25 lm, the
reciprocal plots for 25 and 35 lm OAB were parallel
to each other, indicating mutually exclusive binding of
the two inhibitors at two binding sites. However,
NATA did not compete for binding at the substrate-
binding site, as there was a slope effect between 0 and
35 lm OAB as I
1
. A similar intersecting pattern was
also observed in the cross-competition between NAT
and OAB (Fig. 7C), indicating that NATA and NAT
bind at the same or overlapping sites where two mole-
cules of OAB also bind, and that binding of OAB at
the substrate-binding site is noncompetitive with
Fig. 6. Inhibition of L
2
by OAB. (A) Double reciprocal plots of inhibi-
tion by 0 l
M (e), 3 lM ( ), 10 lM ( ), 15 lM (·) and 20 lM
( ) OAB. (B) The region indicating competitive inhibition was
analyzed further by 0 l
M ( ), 1 lM ( ), 2 lM ( ) and 3 lM (·) OAB.
(C) Replot of the slopes of (B) against the concentration of OAB.
S. Mandal and D. Bhattacharyya Inhibitor-binding sites of
L-amino acid oxidase
FEBS Journal 275 (2008) 2078–2095 ª 2008 The Authors Journal compilation ª 2008 FEBS 2087
NATA and NAT. In other words, NATA, NAT and
OAB compete for binding sites in the catalytic funnel,
except at the substrate-binding site.
Variation of OAB concentrations in both directions
in L
2
produced an intersecting pattern at low concen-
trations of OAB as I
2
, followed by parallel plots after
Fig. 7. Inhibitor cross-competition between OAB and OAB, NATA or NAT in L
1
and L
2
in the presence of 80 lML-Phe as substrate. (A–C)
Cross-competition patterns of L
1
between: (A) OAB as indicated and 0 lM ( ), 1 lM ( ), 2 lM ( ), 5 lM (·), 10 lM (h) and 20 lM (D) OAB;
(B) NATA as indicated and 0 l
M ( ), 5 lM ( ), 25 lM ( ) and 35 lM (·) OAB; and (C) NAT as indicated and 0 lM ( ), 5 lM ( ), 15 lM (·)
and 25 l
M ( ) OAB. (D–F) Cross-competition pattern in L
2
between: (D) OAB as indicated and 0 lM ( ), 5 lM (·), 10 lM ( ) and 20 lM ( )
OAB; (E) NATA as indicated and 0 l
M ( ), 5 lM ( ), 10 lM ( ) and 20 lM (·) OAB; and (F) NAT as indicated and 0 lM ( ), 5 lM ( ), 10 lM
( ) and 20 lM (·) OAB.
Inhibitor-binding sites of
L-amino acid oxidase S. Mandal and D. Bhattacharyya
2088 FEBS Journal 275 (2008) 2078–2095 ª 2008 The Authors Journal compilation ª 2008 FEBS
saturation of two of its binding sites (Fig. 7D). In
OAB and NATA cross-competition experiments, paral-
lel reciprocal plots were observed between 0 and 5 lm
OAB as I
2
, where it is assumed that the two inhibitors
compete for the substrate-binding site, based on the K
I
of OAB (Fig. 7E). Widely separated values of K
I
and
K
IS
for NATA allowed detection of competition at
the substrate-binding site. Parallel reciprocal plots
appeared again between 0 and 20 lm OAB as I
1
,
whereas an intermediate noncompetitive pattern
occurred at 10 lm OAB. This was the consequence of
partial saturation of the second binding site of L
2
.
Competition between OAB and NAT also produced
parallel reciprocal plots when the two binding sites
were occupied by 20 lm OAB (I
1
at 0 and 20 lm,
Fig. 7F). The intermediate noncompetitive stages indi-
cated saturation of the first binding sites of OAB. The
cross-competition kinetics in L
2
primarily show that
the binding sites of OAB, NAT and NATA are either
the same or overlapping.
Discussion
Russell’s viper venom contains a number of potent
toxins, including PLA
2
[29], coagulation factor V and
factor X activating proteases [30,31], hyaluronidase
[32], hemorrhagins [14–16], and cytotoxins [17].
Although LAAOs from several snake venoms are
known, there has been no report on LAAO from
RVV, except for one that describes the inhibitory
property of the ethanolic extract of Tamarindus indica
seeds against several toxicological and enzymatic activ-
ities of RVV [33]. Gel filtration followed by ion
exchange chromatography of RVV yielded two frac-
tions of LAAO, termed L
1
and L
2
(Fig. 1). Although
SDS ⁄ PAGE could not distinguish between L
1
and L
2
,
a difference of 3 kDa was observed in size exclusion
HPLC (Fig. 1). However, the isoforms showed differ-
ences in terms of isoelectric points and amino acid
sequences. Other characters, such as thermal and pH
stability or substrate specificity, were mostly indistin-
guishable. Thus, they may be considered as LAAO
isoenzymes according to the definition in [34]. The
presence of LAAO isoforms in snake venoms is
known, but their functional importance has yet to be
explored [23,35].
The LAAOs characterized so far from snake venoms
are dimeric, although some have been reported as
monomeric, with a degree of uncertainty [4]. The
molecular masses of purified L
1
and L
2
were deter-
mined under denaturing and nondenaturing conditions,
such as SDS ⁄ PAGE and size exclusion HPLC, where
they appeared as monomers of 60–63 kDa. The
LAAOs from different sources were reported to
contain FAD as a cofactor, except for one from Agkis-
trodon contortrix laticinctus venom, which contains
FMN instead of FAD [36]. The UV–visible absorption
spectrum and RP-HPLC analysis of the dissociated co-
factor from L
1
and L
2
indicated the presence of FAD
(Fig. 2). Mass spectral analysis of the cofactor and
standard FAD yielded [riboflavin + K]
+
with more
than 50% abundance. The ionization parameters used
for ESI MS analysis yielded parent FAD ions with
only 20% abundance, and thus the absence of any
[FAD + H]
+
in the spectrum of the cofactor may be
due to low sample concentration and fragmentation
during ionization.
Information from the literature suggests that the
majority of LAAOs from different venoms, except for
that from Naja hannah, have specificity towards hydro-
phobic amino acids [4]. This preference can be
explained on the basis of differences in side chain bind-
ing sites within the enzyme [37]. Of the hydrophobic
amino acids, only five appeared to be good substrates
for L
1
and L
2
. All these amino acids have a surface
area above 180 A
˚
and a hydrophobicity index close to
0 or above (Table 2). The inability to turn over amino
acids with more hydrophobicity and smaller surface
area suggests that both enzymes have catalytic sites
that require hydrophobic substrates with a minimum
surface area of 180 A
˚
to place the a-C within an aver-
age of 3.5 A
˚
from the flavin N-5 required for an effec-
tive hydride transfer [38].
Profiles of the inhibition of L
1
and L
2
by substrate
analogs indicate that the configurations of their cata-
lytic funnels differ from each other. A mixed inhibition
mechanism in L
1
with uncompetitive and noncompeti-
tive components is suggestive of the binding of NATA
(neutral form of Trp) at two allosteric sites instead of
the substrate-binding site (Fig. 3), whereas in L
2
,it
competed with the substrate for the substrate-binding
site (Fig. 3). Therefore, a difference between the envi-
ronments of the two substrate-binding sites in terms of
ionic character and hydrophobicity is possible. The
mixed inhibition mechanism with competitive and non-
competitive components indicates that the second site
for NATA in L
2
is an allosteric binding site that alters
the V
max
for NATA (Fig. 3). The kinetic data for
NATA do not support the existence of other allosteric
sites in L
2
, equivalent to the third inhibitor-binding site
of L
1
.
The partial N-terminal amino acid sequences of L
1
and L
2
show 68% and 64% homology with Ca. rho-
dostoma LAAO, suggesting probable structural and
functional similarities between them. The catalytic site
of that enzyme contains FAD as the prosthetic group,
S. Mandal and D. Bhattacharyya Inhibitor-binding sites of L-amino acid oxidase
FEBS Journal 275 (2008) 2078–2095 ª 2008 The Authors Journal compilation ª 2008 FEBS 2089
the FAD being deeply buried within the enzyme in a
25 A
˚
long funnel-like entrance. The funnel wall also
contains electropositive and electronegative residues
that guide the amino and carboxylate groups of the
substrate amino acid [12]. The structures of this region
also appeared to be similar in two other snake venom
LAAOs from B. moojeni and B. jararacussu [21]. The
mixed inhibitions of L
1
by NATA and NAT were simi-
lar, but the inhibition constant for the latter was
lower. This 3–4-fold reduced inhibition constant sug-
gests that the free carboxylate group of NAT facilitates
its binding as compared to NATA (Fig. 4 and
Table 3). Moreover, inhibition of L
2
by NAT with a
lower inhibition constant than that for NATA sup-
ports the notion that the binding subsites in both of
the isoforms contain hydrophobic and electrostatic sur-
faces, with the former predominating. The entire
catalytic funnel of Ca. rhodostoma LAAO has three
OAB-binding sites. The orientations of the three OAB
molecules were determined by the electrostatics of the
funnel. The outermost ligand was positioned at
10 A
˚
within the funnel, the second one at 5.5 A
˚
closer to the active site than the outermost OAB, and
the third site within the active site nearest to the iso-
alloxazine ring of FAD. The surface closest to the
carboxylate groups of those OABs was uniformly elec-
tropositive, whereas the surface most proximal to the
amino groups was predominantly electronegative [12].
A complex inhibition pattern with three points of
intersection for double reciprocal plots representing
competitive and mixed inhibition mechanisms suggests
step-by-step binding of OAB in L
1
. This took place
first at the substrate-binding site, and then at two allo-
steric sites (Fig. 5). The presence of three binding sites
in L
1
further suggests that the catalytic site, along with
the catalytic funnel, may have a degree of similarity to
that of Ca. rhodostoma LAAO. However, the surface
of the catalytic funnel wall in L
1
is predominantly
hydrophobic. The inhibitor cross-competition kinetics
between OAB, NATA and NAT in L
1
supports this,
and in addition demonstrates that the two allosteric
binding subsites are either the same or overlapping;
that is, both of the allosteric sites with predominant
hydrophobicity are situated within the catalytic funnel
(Fig. 8). On the other hand, the inhibition kinetics of
OAB suggest the existence of two ligand-binding sites
in L
2
(Fig. 6), one of which is the substrate-binding
site. Mutually exclusive binding of OAB, NAT and
NATA indicates that the binding sites of these inhibi-
tors are the same or overlapping. Taken together, all
these kinetic findings are indicative of a different cata-
lytic funnel in L
2
, having one allosteric ligand-binding
site of predominant hydrophobicity.
Binding of OAB in the substrate-binding site was
proposed to be similar to binding of the natural sub-
strate in Ca. rhodostoma LAAO [12]. Recently, a crys-
tal structure of the same enzyme combined with l-Phe
has shown similar orientation of the ligand in the cata-
lytic site. In the substrate-binding site, the carboxylate
group of the ligand was engaged in a salt bridge inter-
action with the guanidinium group of Arg90 and a
hydrogen bond with the hydroxyl group of Tyr372,
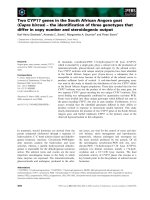
Fig. 8. Proposed catalytic funnels of L
1
and L
2
, showing inhibitor-binding and substrate-binding sites. Hydrophobic and electrostatic surfaces
have been indicated. Intensities of electrostatic surfaces are represented by the number of ‘+’ and ‘)’ signs. Intensities of shaded areas indi-
cate strength of hydrophobicity. Arrows in L
1
indicate rotation of ligand for proper orientation after pivotal anchoring at the electrostatic sur-
face. Arrows in L
2
indicate rotation of ligand after pivotal anchoring at the hydrophobic surface. This hypothesis is based on the ability of the
predominantly charged or hydrophobic substrate analogs to bind to the substrate-binding sites of L
1
and L
2
respectively.
Inhibitor-binding sites of
L-amino acid oxidase S. Mandal and D. Bhattacharyya
2090 FEBS Journal 275 (2008) 2078–2095 ª 2008 The Authors Journal compilation ª 2008 FEBS
while the amino group formed a hydrogen bond with
the carbonyl oxygen atom of Gly464. The side chain
of the ligand participated in hydrophobic interactions
with the side chains Ile430, Ile374, and Phe227 [11].
On the basis of the crystallographic data and the pres-
ent findings, we hypothesize that both L
1
and L
2
have
funnel-like catalytic sites but that the distribution and
intensity of hydrophobic and charged surfaces are dif-
ferent (Fig. 8). The inability of NAT and NATA to
bind to the substrate-binding site indicates a predomi-
nant electrostatic environment regulating substrate
binding in L
1
. Moreover, the binding of OAB with elec-
tropositive, electronegative and hydrophobic groups
indicates a pivotal anchoring on the electrostatic resi-
dues where the hydrophobic surface directs positioning
of the a-C nearest to FAD. In contrast to what was
found for L
1
,inL
2
NAT and NATA interacted at the
substrate-binding site, indicating a predominantly
hydrophobic environment regulating the pivotal
anchoring at the substrate-binding site, where proper
orientation of the amino and carboxylate groups is
determined by the respective electrostatic surfaces.
In summary, RVV contains two LAAO isoforms
that are almost indistinguishable in terms of substrate
specificity and thermal or pH stability. However, the
inhibition profiles of the substrate analogs NATA,
NAT and OAB in the presence of l-Phe as substrate
indicated that the two isoforms were inhibited by dif-
ferent mechanisms. A detailed analysis including cross-
competition between the inhibitors has provided
insights into the catalytic funnel of the two isoforms.
It revealed the differences in the environment of cata-
lytic sites in terms of hydrophobic and electrostatic
surfaces. As both L
1
and L
2
have significant sequence
similarity with the LAAO from Ca. rhodostoma, these
results have been compared with its crystal structure
complexed with OAB. The substrate specificity and
inhibition data for different substrate analogs indicate
that the critical pharmacophore (i.e. the minimal struc-
tural component required for inhibition) is a hydro-
phobic aromatic ring of surface area 180–210 A
˚
2
provided with carboxylate and amino groups attached
to two consecutive carbon atoms. This information on
inhibitor-binding sites will be helpful in the design of
effective suicide substrates for RVV LAAOs.
Experimental procedures
Materials
Russell’s viper (Daboia russelli) venom was collected from
D. Mitra, licensed trophy of Calcutta Snake Park, as desic-
cated, shining, yellow crystals. l-Amino acids, O-dianisidin
dihydrochloride and high molecular mass protein markers
(29–207 kDa) were from Sigma-Aldrich (St Louis,
MO, USA). Sephadex G-100, Sephadex G-75 and CM-
Sephadex C-50 were from Amersham Biosciences (Uppsala,
Sweden). Peroxidase (horseradish, specific activity
280 UÆmg
)1
) was from Sisco Research Laboratories Ltd
(Mumbai, India). Other reagents of analytical grade were
purchased locally. OAB was a gift from U. Halder (Jadav-
pur University, India). De-ionized water was prepared by
passing water through a resin bed (Arium 611DI, Sartorius,
Go
¨
ttingen, Germany).
Purification of L
1
and L
2
Venom crystals (21 mg, equivalent to 15 mg of protein)
were suspended in 2 mL of 20 mm potassium phosphate
buffer (pH 7.2) at 25 °C for 30 min, and the insoluble
materials were removed by centrifugation (1000 g, 10 min,
4 °C) [16]. The yellowish supernatant was applied to a
Sephadex G-100 (117 · 1.2 cm) column pre-equilibrated
with the same buffer at 4 °C. The flow rate was
16 mLÆh
)1
, and the fraction size was 3 mL. Fractions
containing LAAO activity were pooled and loaded onto
a CM-Sephadex C-50 (2 · 20 cm) column pre-equilibrated
with 20 mm potassium phosphate buffer (pH 7.2) at 4 °C.
Unabsorbed fractions devoid of LAAO activity were
removed by washing with five column volumes of buffer.
Bound fractions were eluted after application of a linear
gradient of 0–0.1 m NaCl in the same buffer
(50 + 50 mL). Elution was continued with an additional
100 mL of the final eluent. The flow rate was 0.5 mLÆ
min
)1
, and the fraction size was 3 mL. Elution was mon-
itored at 280 nm. Fractions containing LAAO activity were
pooled and concentrated by dialysis against a saturated
solution of sucrose in the phosphate buffer. The concen-
trated samples were again dialyzed against 20 mm potas-
sium phosphate buffer (pH 7.2) to remove sucrose, and
stored at 4 °C. Homogeneity of the samples were verified
by 15% SDS ⁄ PAGE and staining with silver nitrate.
Chromatofocusing
Chromatofocusing of the LAAO isoforms was carried out
essentially following the method of Amersham Pharmacia
Biotech [39]. Polybuffer exchanger (PBE 96; Sigma) was
packed into a column (0.5 · 14 cm), which was equilibrated
with 90 mL of 25 mm Tris ⁄ acetate (pH 8.3) at 4 °C. After
running 2 mL of elution buffer containing 0.0072 mmolÆ
pH unit
)1
ÆmL
)1
PBE 96 (Sigma) (pH 6), pooled fractions
from G-100 chromatography with LAAO activity were
loaded onto the column. The bound proteins were eluted
by the elution buffer with a linear flow rate of 12 mLÆh
)1
,
and 1.5 mL fractions were collected. The LAAO activity of
each fraction was assayed using the coupled assay system,
and the pH of each fraction was checked with a pH meter
S. Mandal and D. Bhattacharyya Inhibitor-binding sites of L-amino acid oxidase
FEBS Journal 275 (2008) 2078–2095 ª 2008 The Authors Journal compilation ª 2008 FEBS 2091
(pH 510; Eutech Instruments, Thermo Fisher Scientific,
Mumbai, India).
Size exclusion HPLC
Native molecular masses of L
1
and L
2
were determined
from size exclusion HPLC using a Protein-Pak 300 A
˚
column (Waters, Milford, MA, USA; fractionation range
10–400 kDa). A Waters 600 HPLC system equipped with
a Waters 2487 dual k-absorbance UV–visible detector was
used. The column was equilibrated with 10 mm potassium
phosphate buffer (pH 7.5) containing 100 mm NaCl. The
flow rate was 0.8 mLÆmin
)1
, and elution was monitored at
280 nm. The column was calibrated with the following
molecular mass markers: trypsinogen (24 kDa), carbonic
anhydrase (31 kDa), ovalbumin (45 kDa), BSA (67 kDa),
and yeast alcohol dehydrogenase (150 kDa). Linear depen-
dency was observed between log molecular mass and V
t
(elution time).
Identification of the bound cofactor
The LAAO fractions from Sephadex G-100 size exclusion
chromatography containing mixtures of L
1
and L
2
were
pooled and incubated with 0.1% SDS at 100 °C for
10 min. The dissociated ligand was separated from the
apoenzyme by passage through a Sephadex G-75
(3 · 190 mm) column pre-equilibrated with water. Eluted
fractions were monitored simultaneously at 280 nm (for
proteins) and 450 nm (for the cofactor). Fractions with
considerable absorption at 450 nm were scanned between
300 and 600 nm, using water as reference. Alternatively,
the cofactor was dissociated from the enzyme by heating
from 30 to 100 °C over 10 min, and then holding at
100 °C for 10 min. The denatured protein was removed
by centrifugation at 5500 g for 5 min. The dissociated
cofactor was separated from soluble protein by passage
through a Millipore Centricon YM 10 filter (Millipore,
Billerica, MA, USA). The cofactor was analyzed with a
Nova-Pak C
18
RP-HPLC column (3.9 · 150 mm, particle
size 4 lm), which was equilibrated with 85% solvent A
(5 mm ammonium acetate, pH 6.5) and 15% solvent B
(100% methanol) at 1 mLÆmin
)1
[40]. After application of
the sample, the column was run with the initial solvent for
5 min followed by a linear gradient of 85–25% solvent A
(which is equivalent to 15–75% solvent B) over 5–20 min.
Elution of components was followed at 450 nm. Reference
FAD and eluted cofactor were collected and lyophilized for
ESI MS analysis.
Enzyme assay
l-Amino acid oxidase activity was followed by a coupled
assay [22]. Hydrogen peroxide generated during the turn-
over of l-amino acid was estimated by horseradish peroxi-
dase in the presence of O-dianisidine. The colored product
formed was followed continuously by the increase of absor-
bance at 436 nm (e
436 nm
= 8.3 mm
)1
cm
)1
). The rate of
product formation was linear at least up to 120 s. The
assay mixture contained 15–100 lml-Phe (as substrate for
LAAO), 350 mU of horseradish peroxidase and 10 lm
O-dianisidine (as substrate for peroxidase) diluted with
0.05 m potassium phosphate buffer (pH 6.8) up to 1 mL.
The temperature of the spectrophotometer cuvette was
maintained at 25 °C by a circulating water bath (Poly-
science, USA). The reaction was initiated by the addition
of 10–20 lLofL
1
or L
2
(approximately 15–30 nm final
concentration) when the reaction rate was optimum. How-
ever, in a set of experiments where the substrate or inhibi-
tor concentration was varied, the concentration of the
enzyme remained constant. To verify the substrate specific-
ity, other l-amino acids were used in place of l-Phe under
identical assay conditions.
Inhibition kinetics
The inhibition kinetics of L
1
and L
2
were studied in the
presence of the substrate analogs NAT, NATA, and
OAB. NAT (0.0087 m) and NATA (0.0135 m) were
dissolved in dimethylsulfoxide and added to the reaction
mixture after serial dilution of the stock with buffer.
The following extinction coefficients were used: NAT,
e
279 nm
= 5580 m
)1
cm
)1
; and NATA, e
280.8 nm
=
5690 m
)1
cm
)1
. OAB was dried in vacuum desiccators
over NaOH pellets to constant weight, weighed, and dis-
solved in water to prepare a 0.1 m stock. During inhibi-
tion studies, the inhibitor, the substrate and the coupling
enzyme were added to the assay mixture, and the reac-
tions were initiated by the addition of 20 lL of LAAO.
In control sets, the inhibitors at the concentration applied
had no effect on the coupling enzyme.
Data analysis
Previous reports on the reaction mechanisms of LAAOs
from different sources indicated that this enzyme
follows Michaelis–Menten kinetics [1,41]. The kinetic con-
stants of L
1
and L
2
with l-amino acid substrates were
derived by fitting the initial rate of reaction (v) to the
double reciprocal form of the Michaelis–Menten equation
(Eqn 1):
1
v
¼
K
m
V ½S
þ
1
V
ð1Þ
where V , K
m
and [S] are maximum velocity, Michaelis–
Menten constant, and substrate concentration, respectively.
The mechanism of inhibition was analyzed by a double
reciprocal plot of the inhibition kinetics data at different
Inhibitor-binding sites of L-amino acid oxidase S. Mandal and D. Bhattacharyya
2092 FEBS Journal 275 (2008) 2078–2095 ª 2008 The Authors Journal compilation ª 2008 FEBS
inhibitor concentrations [I], using Eqns (2) and (3) for com-
petitive and mixed inhibition respectively [25,42]:
1
v
¼
1
V
þ
K
m
V
1 þ
½I
K
I
1
S
ð2Þ
1
v
¼ 1 þ
½I
K
I
K
m
V
1
S
þ
1 þ
½I
K
IS
V
ð3Þ
where K
I
is the inhibition constant for inhibitor binding to
the free enzyme, and K
IS
is the inhibition constant for
inhibitor binding to the enzyme–substrate complex. The
slopes of double reciprocal plots for competitive inhibition
were further analyzed by plotting them as a function of [I]
to determine the nature of competitive inhibition (linear,
parabolic, and hyperbolic).
The inhibitor cross-competition pattern was analyzed
graphically by using Eqn (4), which is a linear function of
1 ⁄ v versus [I
1
], as described in [28]:
1
v
¼
1
v
0
1 þ
½I
2
K
i2
þ
1
v
0
K
i1
1 þ
½I
2
aK
i2
I
1
½ ð4Þ
where v
0
is the initial rate in the absence of inhibitor, K
i1
and K
i2
are the inhibition constants for I
1
and I
2
, respec-
tively, and a is the constant defining the interaction
between the two inhibitors. Changes in [I
2
] will have a slope
effect if a is close to unity, but will be ineffective if it is infi-
nitely large. Therefore, simultaneous binding of two inhibi-
tors to the enzyme will yield reciprocal plots intercepting to
the left of the 1 ⁄ v axis. On the other hand, reciprocal plots
for mutually excluding binding of two inhibitors will be a
set of parallel lines [28,43]. All the data presented here are
means or means ± SD of three independent repeats, and
were processed using Microsoft excel.
Other methods
Optical measurements, enzyme assays and spectral scans
were done with an Analytic Jena Specord 200 recording
spectrophotometer. Protein concentrations were determined
after Lowry [44], with BSA as reference. SDS ⁄ PAGE gels
were stained with a Gel Code Glycoprotein staining kit
(Pierce, Rockford, IL, USA) for glycoprotein analysis.
ESI MS (Micromass, Rockford, IL, USA) analysis of co-
factor was carried out after dissolving in water. Parameters
used for ionization were as follows: capillary voltage
3082 V; sample cone voltage 44 V; extraction cone voltage
1 V; desolvation temperature 130 °C; and source tempera-
ture 80 °C.
N-terminal amino acid sequencing was carried out essen-
tially after [17], using an Applied Biosystem (Foster City,
CA, USA) automated protein sequencer (model Procise-
491). Briefly, approximately 100 pmol of L
1
and L
2
bands
from 10% SDS ⁄ PAGE were electrotransfered on an Immo-
bilon P
SQ
(Millipore) membrane before application to the
sequencer. The transfer buffer was 10 mm Caps (pH 11)
containing 10% methanol.
Acknowledgements
We thank Dr Anil Ghosh for amino acid sequencing
and Mr Kalyan Sarkar for MS. We also thank Dr
Basudeb Acharya for language correction of the manu-
script. S. Mandal was supported by a CSIR-NET fel-
lowship (New Delhi).
References
1 Massey V & Curti B (1967) On the reaction mechanism
of Crotalus adamanteus L-amino acid oxidase. J Biol
Chem 242, 1259–1264.
2 Porter DJT & Bright HJ (1980) Interpretation of the
pH dependence of flavin reduction in the L-amino acid
oxidase reaction. J Biol Chem 242, 2969–2975.
3 Curti B, Ronchi S & Simonetta MP (1992) D- and
L-amino acid oxidases. In Chemistry and Biochemistry
of Flavoenzymes, Vol. 3 (Muller F, ed.), pp. 69–94.
CRC Press, Boca Raton, FL.
4 Du XY & Clemetson KJ (2002) Snake venom L-amino
acid oxidases. Toxicon 40, 659–665.
5 Calderon J, Olvera L, Martinez LM & Davila G
(1997) A Neurospora crassa mutant altered in regula-
tion of L-amino acid oxidase. Microbiology 143,
1969–1974.
6 Xiao XD & Marzulf GA (1993) Amino acid substitu-
tions in the zinc finger of NIT2, the nitrogen regulatory
protein in Neurospora crassa, alter promoter element
recognition. Curr Genet 24, 212–218.
7 Suhr SM & Kim DS (1996) Identification of the snake
venom substance that induces apoptosis. Biochem
Biophys Res Commun 224, 134–139.
8 Suhr SM & Kim DS (1999) Comparison of the apopto-
tic pathways induced by L-amino acid oxidase and
hydrogen peroxidase. J Biochem 125, 305–309.
9 Ande SR, Kommoju PR, Draxl S, Murkovic M,
Macheroux P, Ghisla S & Ferrando-May E (2006)
Mechanisms of cell death induction by L-amino acid
oxidase, a major component of ophidian venom.
Apoptosis 11, 1439–1451.
10 Zhang YJ, Wang JH, Lee WH, Wang Q, Liu H, Zheng
YT & Zhang Y (2003) Molecular characterization of
Trimeresurus stejnegeri venom L-amino acid oxidase
with potential anti-HIV activity. Biochem Biophys Res
Commun 309, 598–604.
11 Moustafa IM, Foster S, Lyubimov AY & Vrielink A
(2006) Crystal structure of LAAO from Calloselasma
rhodostoma with an L-phenylalanine substrate: insights
into structure and mechanism. J Mol Biol 364, 991–
1002.
S. Mandal and D. Bhattacharyya Inhibitor-binding sites of L-amino acid oxidase
FEBS Journal 275 (2008) 2078–2095 ª 2008 The Authors Journal compilation ª 2008 FEBS 2093
12 Pawelek PD, Cheah J, Coulombe R, Macheroux P, Ghis-
la S & Vrielink A (2000) The structure of L-amino acid
oxidase reveals the substrate trajectory into an enantio-
merically conserved active site. EMBO J 19, 4204–4215.
13 Warrell DA (1995) Clinical toxicology of snakebite in
Asia. In Clinical Toxicology of Animal Venoms and Poi-
sons (Meier J & White J, eds), pp. 493–594. CRC Press,
London.
14 Chakrabarty D, Bhattacharyya D, Sarkar HS & Lahiri
SC (1993) Purification and partial characterization of a
haemorrhagin (VRH-1) from Vipera russelli russelli
venom. Toxicon 31 , 1601–1614.
15 Kole L, Chakrabarty D, Datta K & Bhattacharyya D
(2000) Purification and characterization of an organ
specific hemorrhagic toxin from Vipera russelli russelli
(Russell’s viper) venom. Indian J Biochem Biophys 37,
114–120.
16 Chakrabarty D, Datta K, Gomes A & Bhattacharyya
D (2000) Haemorrhagic protein of Russell’s viper
venom with fibrinolytic and esterolytic activities.
Toxicon 38, 1475–1490.
17 Maity G, Mandal S, Chatterjee A & Bhattacharyya D
(2007) Purification and characterization of a low molec-
ular weight multifunctional cytotoxic phospholipase A
2
from Russell’s viper venom. J Chromat B 845, 232–243.
18 Mandal S & Bhattacharyya D (2007) Ability of a small,
basic protein isolated from Russell’s viper venom
(Daboia russelli russelli) to induce renal tubular necrosis
in mice. Toxicon 50, 236–250.
19 Datta K & Bhattacharyya D (1999) In vitro hemor-
rhage like-activity of Russell’s viper (Vipera russelli)
venom from Eastern India with mice organs. Curr Sci
(India) 77, 1673–1677.
20 Maity G & Bhattacharyya D (2005) Assay of snake
venom phospholipase A2 using scattering mode of spec-
trofluorimeter. Curr Sci (India) 89, 1004–1008.
21 Franca SC, Kashima S, Roberto PG, Marins M, Ticli
FK, Pereira JO, Astolfi-Filho S, Stabeli RG, Magro AJ,
Fontes MRM et al. (2007) Molecular approaches for
structural characterization of Bothrops L-amino acid
oxidases with anti protozoal activity: cDNA cloning,
comparative sequence analysis, and molecular modeling.
Biochem Biophys Res Commun 355, 302–306.
22 Fersht A (1999) Structure and Mechanism in Protein
Science, pp. 280–286. W. H. Freeman, New York.
23 Geyer A, Fitzpatrick TB, Pawelek PD, Kitzing K, Vrie-
link A, Ghisla S & Macheroux P (2001) Structure and
characterization of the glycan moiety of L-amino-acid
oxidase from the Malayan pit viper Calloselasma rho-
dostoma. Eur J Biochem 268, 4044–4053.
24 Coles CJ, Edmondson DE & Singer TP (1977) Reversible
inactivation of L-amino acid oxidase. Properties of the
three conformational forms. J Biol Chem 252, 8035–8039.
25 Roberts DV (1977) Enzyme Kinetics, pp. 48–82. Cam-
bridge University Press, London.
26 Engel PC (1977) Enzyme Kinetics: The Steady-State
Approach, pp. 26–36. Chapman and Hall, London.
27 Plowman KM (1972) Enzyme Kinetics, pp. 56–75.
McGraw-Hill Book Company, New York, NY.
28 Tian G, Ghanekar SV, Aharony D, Shenvi AB, Jacobs
RT, Liu X & Greenberg BD (2003) The mechanism of
c-secretase multiple inhibitor binding site for transition
state analogs and small molecule inhibitors. J Biol
Chem 278, 28968–28975.
29 Kasturi S & Gowda TV (1989) Purification and charac-
terization of a major phospholipase A2 from Russell’s
viper (Vipera russelli) venom. Toxicon 27, 229–237.
30 Tokunaga F, Nagasawa K, Tamura S, Miyata T,
Iwanaga S & Kisiel W (1988) The factor V activating
enzyme (RVV-V) from Russell’s viper venom. Identifi-
cation of isoproteins RVV-V alpha, -V beta and -V
gamma and their complete amino acid sequences. J Biol
Chem 263, 17471–17481.
31 Gowda DC, Jackson CM, Preston H & Davidson EA
(1994) Factor X-activating glycoprotein of Russell’s
viper venom polypeptide: composition and characteriza-
tion of the carbohydrate moieties. J Biol Chem 269,
10644–10650.
32 Pukrittayakamee S, Warrell DA, Desakorn V, McMich-
ael AJ, White NJ & Bunnang D (1988) The hyaluroni-
dase activities of some south east Asian snake venoms.
Toxicon 26, 629–637.
33 Ushanandini S, Nagaraju S, Harish K, Vedavathi M,
Machiah DK, Kemparaju K, Vishwanath BS, Gowda
TV & Girish KS (2006) The Anti-snake venom proper-
ties of Tamarindus indica (Leguminosae) seed extract.
Phytother Res 20, 851–858.
34 Latner AL & Skillen AW (1968) Isoenzymes in Biology
and Medicine. Academic Press, New York.
35 Stiles BG, Sexton FW & Weinstein SA (1991) Antibac-
terial effects of different snake venoms: purification and
characterization of antibacterial proteins from Pseudoe-
chis australis (Australian king brown or mugla snake)
venom. Toxicon 29, 1129–1141.
36 Souza DHF, Eugenio LM, Fletcher JE, Jiang M,
Garratt RC, Oliva G & Selistre-de-Araujo HS (1999)
Isolation and structural characterization of a cytotoxic
L-amino acid oxidase from Agkistrodon contortrix lati-
cinctus snake venom: preliminary crystallographic data.
Arch Biochem Biophys 368, 285–290.
37 Ponnudurai G, Chung MC & Tan NH (1994) Purifica-
tion and properties of L-amino acid oxidase from Mala-
yan pit viper (Calloselasma rhodostoma) venom. Arch
Biochem Biophys 313, 373–378.
38 Fraaije MW & Mattevi A (2000) Flavoenzymes: diverse
catalysts with recurrent features. Trends Biochem Sci 25,
126–132.
39 Amersham Pharmacia Biotech (2001) Chromatofocusing
with Polybuffer and PBE, pp. 15–24. Amersham Phar-
macia Biotech AB, Uppsala.
Inhibitor-binding sites of L-amino acid oxidase S. Mandal and D. Bhattacharyya
2094 FEBS Journal 275 (2008) 2078–2095 ª 2008 The Authors Journal compilation ª 2008 FEBS
40 Lewis JA & Escalante-Semerena JC (2006) The FAD
dependent tricarballylate dehydrogenase (TcuA) enzyme
of Salmonella enterica converts tricarballylate into cis-
aconitate. J Bacteriol 15, 5479–5486.
41 Koster JF & Veeger C (1968) The relation between tem-
perature inducible allosteric effects and the activation
energies of amino acid oxidases. Biochem Biophys Acta
167, 48–63.
42 Copeland RA (1996) Enzymes: A Practical Introduction
to Structure, Mechanism and Data Analysis, pp. 187–
224. VCH Publishers, New York, NY.
43 Knappenberger KS, Tian G, Ye X, Sobotka-Briner C,
Ghanekar SV, Greenberg BD & Scott CW (2004)
Mechanism of c -secretase cleavage action: is c-secretase
regulated through autoinhibition involving the presen-
lin-1 exon 9 loop? Biochemistry 43, 6208–6218.
44 Lowry OH, Rosebrough NJ, Farr AI & Randall RJ
(1951) Protein measurement with folin phenol reagent.
J Biol Chem 193, 265–275.
45 Kyte J & Doolittle RF (1982) A simple method for dis-
playing the hydropathic character of a protein. J Mol
Biol 157, 105–132.
S. Mandal and D. Bhattacharyya Inhibitor-binding sites of L-amino acid oxidase
FEBS Journal 275 (2008) 2078–2095 ª 2008 The Authors Journal compilation ª 2008 FEBS 2095