Báo cáo khoa học: Gene expression silencing with ‘specific’ small interfering RNA goes beyond specificity – a study of key parameters to take into account in the onset of small interfering RNA off-target effects potx
Bạn đang xem bản rút gọn của tài liệu. Xem và tải ngay bản đầy đủ của tài liệu tại đây (1.04 MB, 16 trang )
Gene expression silencing with ‘specific’ small interfering
RNA goes beyond specificity – a study of key parameters
to take into account in the onset of small interfering RNA
off-target effects
Se
´
bastien Vankoningsloo
1
, Franc¸oise de Longueville
2
, Ste
´
phanie Evrard
2
, Pierre Rahier
2
, Andre
´
e
Houbion
1
, Antoine Fattaccioli
1
,Me
´
lanie Gastellier
1
, Jose
´
Remacle
2
, Martine Raes
1
, Patricia Renard
1
and Thierry Arnould
1
1 Laboratoire de Biochimie et Biologie Cellulaire, University of Namur (F.U.N.D.P), Belgium
2 Eppendorf Array Technologies, Namur, Belgium
RNA interference (RNAi) is a recently discovered
gene-silencing pathway [1] triggered by dsRNA-
derived molecules such as small interfering RNAs
(siRNAs) or microRNAs, leading to the degradation
of a particular mRNA (slicing) or to repression of
translation [2,3]. Thereafter, the use of chemically
synthesized siRNAs as a new loss-of-function strategy
exploded during the last decade, mainly because the
RNAi pathway is believed to apply to all genes in
several species. Therefore, siRNAs became useful
tools for the silencing of genes playing a role in many
biological processes.
The extensive use of siRNAs, designed to match
perfectly with a particular mRNA target, is based on
the assumption of their high specificity. Indeed, it was
initially suggested that only one mismatch could abol-
ish the siRNA-induced slicing activity [4]. However,
several studies using DNA microarray and ⁄ or compu-
tational approaches have shown that siRNAs can
generate side effects, by inducing the degradation of
nontarget mRNAs sharing sequence homology with
the siRNA seed region, or by repressing the translation
of unintended proteins [5–10]. Indeed, in some circum-
stances, and especially in immune cells, siRNAs are
Keywords
cell type; gene expression; off-target
effects; silencing; siRNA
Correspondence
T. Arnould, Laboratoire de Biochimie et
Biologie Cellulaire, University of Namur
(F.U.N.D.P), 61 rue de Bruxelles, 5000
Namur, Belgium
Fax: +32 81 724125
Tel: +32 81 724129
E-mail:
(Received 10 January 2008, revised 12
March 2008, accepted 19 March 2008)
doi:10.1111/j.1742-4658.2008.06415.x
RNA-mediated gene silencing (RNA interference) is a powerful way to
knock down gene expression and has revolutionized the fields of cellular
and molecular biology. Indeed, the transfection of cultured cells with small
interfering RNAs (siRNAs) is currently considered to be the best and easi-
est approach to loss-of-function experiments. However, several recent stud-
ies underscore the off-target and potential cytotoxic effects of siRNAs,
which can lead to the silencing of unintended mRNAs. In this study, we
used a low-density microarray to assess gene expression modifications in
response to five different siRNAs in various cell types and transfection con-
ditions. We found major differences in off-target signature according to:
(a) siRNA sequence; (b) cell type; (c) duration of transfection; and (d)
post-transfection time before analysis. These results contribute to a better
understanding of important parameters that could impact on siRNA side
effects in knockdown experiments.
Abbreviations
DF, DharmaFECT1; IFN, interferon; IRF, interferon responsive factor; LAMP2, lysosome-associated membrane protein 2; NT, nontargeting;
RISC, RNA-induced silencing complex; RNAi, RNA interference; siRNA, small interfering RNA; SREBF1, sterol-responsive element-binding
protein 1; TLR3, Toll-like receptor 3.
2738 FEBS Journal 275 (2008) 2738–2753 ª 2008 The Authors Journal compilation ª 2008 FEBS
also able to trigger an ‘interferon (IFN) response’
through the activation of cytosolic proteins such as
dsRNA-dependent protein kinase and ⁄ or membrane
receptors such as Toll-like receptor 3 (TLR3), leading
to a general repression of translation [11]. An inflam-
matory response was also observed in primary human
chondrocytes transfected with siRNAs [12]. These con-
siderations cast some doubts on the validity of several
results previously published – particularly on the strict
specificity for targets supposed to be responsible for a
biological response – and highlight the importance of
studies intended to increase our understanding of the
extent of siRNA nonspecific effects and the conditions
under which they occur.
In this work, we used a low-density DNA micro-
array that allows gene expression analysis of 273 genes,
in order to determine the off-target effects generated
by five siRNAs in different cell types and experimental
conditions. We first studied the side effects of two
different siRNAs targeting the sterol-responsive
element-binding protein 1 (SREBF1) mRNA encoding
a transcription factor, two different siRNAs targeting
the lysosome-associated membrane protein 2 (LAMP2)
mRNA encoding a lysosomal glycoprotein, and a non-
targeting (NT) siRNA. Gene expression profiles were
determined for each siRNA in transiently transfected
human osteosarcoma 143B cells, lung adenocarci-
noma A549 cells, and lung IMR-90 fibroblasts.
Furthermore, in 143B cells, we studied the effects of
different transfection and post-transfection periods on
the modifications in gene expression triggered by
siRNA.
Results
Verification of siRNA efficiency
We used two siRNAs designed to specifically knock
down expression of the transcription factor SREBF1
(SREBF1 ⁄ siRNA1 and SREBF1 ⁄ siRNA2), and two
siRNAs targeting the transcript coding for the lyso-
somal glycoprotein LAMP2, which is not known to be
directly involved in transcription events (LAMP2 ⁄ siR-
NA1 and LAMP2 ⁄ siRNA2). The particular targets
were chosen on the basis of their interest for other
research programmes in our laboratory. The efficiency
of these siRNAs at concentrations ranging from 5 nm
to 100 nm was first demonstrated by real-time PCR in
143B, A549 and IMR-90 cells (Fig. 1). The choice of
these cell types was based on the selection of trans-
formed or nontransformed cells expressing or not
expressing the siRNA-responsive TLR3 receptor.
Indeed, 143B and A549 are tumor-derived cell lines,
the latter being reported to express TLR3 [13], whereas
IMR-90 is a nonimmortalized cell type. We observed
that the transfection reagent DharmaFECT1 (DF) has
no or little effect on the abundance of SREBF1
(Fig. 1A,B) or LAMP2 (Fig. 1C) transcript in these
cell types. The SREBF1-specific siRNAs (100 nm) were
both very efficient at decreasing SREBF1 transcript
abundance, with reductions of 81%, 66% and 69% for
SREBF1 ⁄ siRNA1 and reductions of 79%, 78% and
71% for SREBF1 ⁄ siRNA2 in 143B, A549 and IMR-
90 cells, respectively (Fig. 1A). Under these conditions,
the effect of the SREBF1-targeting siRNA was pro-
longed, at least, up to 72 h post-transfection, as dem-
onstrated in 143B (Fig. 1B). Both LAMP2-specific
siRNAs (100 nm) were also efficient, as the abundance
of the corresponding transcript was decreased by 89%,
78% and 86% for LAMP2 ⁄ siRNA1 and by 64%, 58%
and 66% for LAMP2 ⁄ siRNA2 in 143B, A549 and
IMR-90 cells, respectively (Fig. 1C). In contrast, an
siRNA with an NT sequence did not dramatically alter
the abundance of SREBF1 or LAMP2 mRNAs in
these conditions. The main observed effect was even a
slight increase in the abundance of SREBF1 transcript
in each cell type.
The efficiency of SREBF1 ⁄ siRNA1 was also investi-
gated at the protein level by western blotting analysis
of SREBF1 abundance in 143B cells (Fig. 2). We
found a concentration-dependent and time-sustained
decrease in SREBF1 protein abundance in 143B cells.
The signals present at 48 h and 72 h after cell transfec-
tion with SREBF1 ⁄ siRNA1 (100 nm), apparently not
correlated with mRNA levels (Fig. 1B), probably result
from differences in exposure times during western blot-
ting. We also observed a slight increase in SREBF1
protein level triggered in the presence of the NT
siRNA, in agreement with the slight increase in
SREBF1 mRNA observed under the same conditions
(Fig. 1A,B).
Off-target signatures elicited by five siRNAs in
three different cell types
We next studied the effects of DF and of the five
siRNAs at 100 nm on gene expression. The side effects
of these siRNAs were systematically investigated in
143B (Fig. 3), A549 (Fig. 4) and IMR-90 cells (Fig. 5)
transiently transfected for 24 h before total RNA
extraction and microarray analysis. Please note that
the scales are different for each heat map. Each experi-
ment was performed on biological triplicates, and the
complete lists of relative transcript level values and
corresponding standard deviations are provided in sup-
plementary Tables S1–S12. Several transcripts were
S. Vankoningsloo et al. siRNA off-target effects in different cell types
FEBS Journal 275 (2008) 2738–2753 ª 2008 The Authors Journal compilation ª 2008 FEBS 2739
0.0
0.5
1.0
1.5
2.0
2.5
Relative SREBF1 mRNA abundance
2407248 2407248 2407248
DF
SREBF1/siRNA1
(100 n
M)
NT siRNA
(100 nM)
Time post-transfection (h)
0.0
0.2
0.4
0.6
0.8
1.0
1.2
1.4
1.6
0.0
0.2
0.4
0.6
0.8
1.0
1.2
1.4
1.6
Relative SREBF1 mRNA abundance
DF 100 20 5
SREBF1
siRNA1
(n
M)
100 20 5
SREBF1
siRNA2
(n
M)
100 20 5
NT siRNA
(n
M)
DF 100 20 5
SREBF1
siRNA1
(n
M)
100 20 5
SREBF1
siRNA2
(n
M)
100 20 5
NT siRNA
(n
M)
DF 100 20 5
SREBF1
siRNA1
(n
M)
100 20 5
SREBF1
siRNA2
(n
M)
100 20 5
NT siRNA
(n
M)
143B
A549 IMR90
Relative LAMP2 mRNA abundance
143B
A549 IMR90
DF 100 20 5
LAMP2
siRNA1
(n
M)
100 20 5
LAMP2
siRNA2
(n
M)
100 20 5
NT siRNA
(n
M)
DF 100 20 5
LAMP2
siRNA1
(n
M)
100 20 5
LAMP2
siRNA2
(n
M)
100 20 5
NT siRNA
(n
M)
DF 100 20 5
LAMP2
siRNA1
(n
M)
100 20 5
LAMP2
siRNA2
(n
M)
100 20 5
NT siRNA
(n
M)
A
B
C
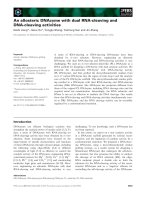
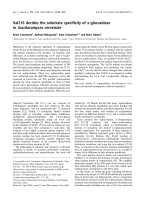
Fig. 1. Effect of the SREBF1-targeting and the LAMP2-targeting siRNAs on SREBF1 and LAMP2 mRNA levels analyzed by real-time PCR in
143B, A549 and IMR-90 cells. (A) 143B, A549 and IMR-90 cells were incubated for 24 h with DF or transfected for 24 h with SREBF1 ⁄ siR-
NA1, SREBF1 ⁄ siRNA2 or the NT siRNA at the indicated concentrations before RNA extraction, reverse transcription, and amplification in the
presence of SYBR Green and specific primers. (B) 143B cells were incubated for 24 h with DF or transfected for 24 h with SREBF1 ⁄ siRNA1
or the NT siRNA at 100 n
M. RNA was extracted 0, 24, 48 and 72 h post-transfection and processed for real-time PCR analysis. (C) 143B,
A549 and IMR-90 cells were incubated for 24 h with DF or transfected for 24 h with LAMP2 ⁄ siRNA1, LAMP2 ⁄ siRNA2 or the NT siRNA at
the indicated concentrations before RNA extraction and processing for real-time PCR analysis. TBP was used as a housekeeping gene for
data normalization. Results are expressed as relative SREBF1 or LAMP2 transcript abundance in treated cells as compared to untreated con-
trol cells (n = 1).
siRNA off-target effects in different cell types S. Vankoningsloo et al.
2740 FEBS Journal 275 (2008) 2738–2753 ª 2008 The Authors Journal compilation ª 2008 FEBS
not detected, most probably because of their absence
or low abundance: depending on the experiment, the
total number of mRNAs detected ranged between 185
and 260 out of 273. The results discussed here below
are only related to genes for which mRNA relative
abundance in siRNA-transfected cells was found to be
significantly different when compared with the mRNA
abundance determined in DF-treated cells.
First, we observed that treatment with DF alone
affected the expression of a few genes, especially in
IMR-90 cells, such as IGFBP3 (insulin-like growth fac-
tor-binding protein 3) (3.3-fold decrease), ICAM1
(intercellular adhesion molecule 1) (1.9-fold decrease)
and PCNA (proliferating cell nuclear antigen) (1.8-fold
decrease) (supplementary Table S9). Second, we estab-
lished gene expression profiles for the five siRNAs in
the three cell types. The number of genes differentially
expressed in response to siRNAs with statistical signifi-
cance ranged between one and 12, according to the
condition. The main conclusion drawn from these
experiments is that each siRNA is associated with a
unique molecular signature on gene expression. For
example, transcripts that are downregulated by
LAMP2 ⁄ siRNA2 in A549 cells, such as JUN (jun
oncogene), PLAU (plasminogen activator, urokinase),
PLAUR (plasminogen activator, urokinase receptor),
RRM1 (ribonucleotide reductase M1 polypeptide),
TERF1 (telomeric repeat binding factor 1) and
TGFBR2 (transforming growth factor, beta recep-
tor II) (Fig. 4), were not systematically downregulated
by either LAMP2 ⁄ siRNA1, SREBF1 ⁄ siRNA1,
SREBF1 ⁄ siRNA2 or the NT siRNA. Importantly, the
fact that two different siRNAs targeting the same tran-
script do not provide the same gene expression profiles
(see Venn diagrams in Figs 3–5) rules out potential
secondary effects due to target knockdown, and indi-
cates that the unintended mRNA downregulations
observed are most probably siRNA off-target effects.
To some extent, the signatures of siRNAs also seem
to be dependent on the cell type in which siRNAs are
introduced. Indeed, whereas several mRNAs were con-
sistently downregulated by a given siRNA in every cell
type, we found that the abundance of some transcripts
was clearly differently affected by siRNA according to
the cell type, as illustrated by the 2.3-fold downregula-
tion of SOD2 (superoxide dismutase 2) found exclu-
sively in IMR-90 cells transfected with
SREBF1 ⁄ siRNA2. A global analysis of all data cross-
ing siRNAs and cell types revealed that about 60% of
the siRNA off-target effects observed in this study
appear to be cell type-specific.
Finally, in order to validate these data with another
method, we performed real-time PCR analyses for
some selected transcripts (CTGF, JUN, PLAU ,
SPARC, TGFBR2) on samples used for microarray
experiments (RNAs extracted directly after a 24 h
transfection of 143B or A549 cells with SREBF1 ⁄ siR-
NA2 or LAMP2 ⁄ siRNA2) (supplementary Table S13).
We observed that mRNA abundances were modified
similarly with both methods, attesting to the reliability
of the results.
Kinetics of off-target effects induced by siRNA
In order to determine the time-course of siRNA side
effects in 143B cells transfected for 24 h with
SREBF1 ⁄ siRNA1 or the NT siRNA (100 nm), gene
expression data obtained at 0, 24 and 48 h post-trans-
fection were compared in experiments performed on
biological triplicates (Fig. 6). Again, we observed that
the transfection reagent alone induced only small vari-
ations in the abundance of gene transcripts, no matter
what the post-transfection time was (Fig. 6, col-
umns 1–3). In contrast, the relative abundance of sev-
eral mRNAs (between two and 15) was significantly
modified in response to the introduction of
SREBF1 ⁄ siRNA1 (Fig. 6, columns 4–6) or the NT
siRNA (Fig. 6, columns 7–9) into 143B cells. In these
conditions, the highest number of modifications was
observed 24 h post-transfection (Fig. 6, columns 5 and
CTL DF 100 50 20 5 100 50 20 5
SREBF1
siRNA1 (n
M)
NT
siRNA (nM)
SREBF1
α
-tubulin
SREBF1
α
-tubulin
SREBF1
α
-tubulin
SREBF1
α
-tubulin
0 h post-
transfection
24 h post-
transfection
48 h post-
transfection
72 h post-
transfection
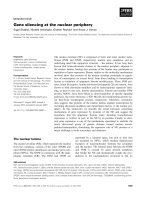
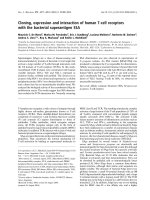
Fig. 2. Effect of the SREBF1-targeting siRNA on SREBF1 protein
level analyzed by western blotting in 143B cells. 143B cells were
incubated for 24 h with DF or transfected for 24 h with
SREBF1 ⁄ siRNA1 or the NT siRNA at the indicated concentrations.
Clear cell lysates were prepared 0, 24, 48 or 72 h post-transfection.
SREBF1 abundance was determined by western blotting on 25 lg
of protein, and immunodetection of a-tubulin was used as a loading
control.
S. Vankoningsloo et al. siRNA off-target effects in different cell types
FEBS Journal 275 (2008) 2738–2753 ª 2008 The Authors Journal compilation ª 2008 FEBS 2741
8) (see also supplementary Tables S1 and S14). Repre-
sentative results are presented in Fig. 7, which summa-
rizes and illustrates each kind of kinetic profile that we
obtained. As shown in Fig. 7A a moderate but sus-
tained upregulation of CDKN1B (cyclin-dependent
kinase inhibitor 1B, also known as p27
Kip1
) was
observed after the transfection of 143B cells with
SREBF1 ⁄ siRNA1. In Fig. 7B, we illustrate the upregu-
lation of PLAU (plasminogen activator urokinase) in
cells responding to either SREBF1-specific or the NT
siRNA. A similar profile was also obtained for
SPARC (secreted protein acidic cysteine-rich, also
known as osteonectin). The abundance of several tran-
scripts was also decreased in cells transfected with
SREBF1 ⁄ siRNA1, such as CCND2 (cyclin D2)
(Fig. 7C), UNG (uracil-DNA glycosylase), ALDOA
(aldolase A), CENPF (centromere protein F), CKB
(brain creatine kinase) or CTGF (connective tissue
growth factor). The NT siRNA also downregulated
the expression of several genes, such as EGFR (epider-
mal growth factor receptor) (Fig. 7D), MAP2K1 (also
known as MEK1, mitogen-activated protein kinase
kinase 1) and RAF1 (murine leukemia viral oncogene
homolog 1). Finally, downregulation of IGFBP3 was
observed in cells transfected with either SREBF1 ⁄
siRNA1 or the NT siRNA (Fig. 7E).
Effect of duration of transfection period on siRNA
off-target signature
To assess the putative effect of the transfection period
on the siRNA nonspecific effects, gene expression pro-
files in 143B cells transfected for 24 or 48 h with
SREBF1 ⁄ siRNA1 or the NT siRNA at 100 nm were
next determined in three independent experiments.
RNA extractions were performed between 0 and 48 h
post-transfection (see also supplementary Tables S14
and S15). As shown in Fig. 8, the number of genes
differentially expressed was higher after a 48 h than
after a 24 h transfection period. The heat map (Fig. 9)
compares, in all tested conditions, the relative
abundances of mRNAs differentially expressed in at
least one condition. In the presence of SREBF1 ⁄
siRNA1, we usually observed higher upregulation or
SPARC
NT_siRNA
SREBF1-siRNA2
SREBF1-siRNA1
DF
NT_siRNA
LAMP2-siRNA1
LAMP2-siRNA2
DF
PLAU
CCND3
CANX
CAV1
MAP2K1
IGFBP3
RAF1
TNFRSF10B
UNG
YWHAZ
CCND1
PLAUR
EGFR
DUSP1
CTGF
JUN
SPARC
CCND3
CCND1
CANX
CAV1
MAP2K1
IGFBP3
RAF1
TNFRSF10B
UNG
YWHAZ
PLAU
PLAUR
EGFR
DUSP1
CTGF
JUN
AB
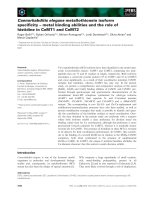
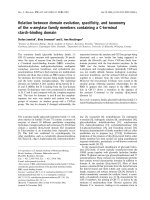
Fig. 3. Effect of the SREBF1-targeting and the LAMP2-targeting siRNAs on gene expression profiles analysed by microarray in 143B cells.
Cells were incubated for 24 h with DF or transfected for 24 h with SREBF1 ⁄ siRNA1, SREBF1 ⁄ siRNA2 (A), LAMP2 ⁄ siRNA1, LAMP2 ⁄ siRNA2
(B) or the NT siRNA at 100 n
M before RNA extraction, reverse transcription, and processing for microarray analysis. Expression plots present
the genes displaying significant differences in relative transcript level between siRNA-transfected cells and DF-treated cells (n = 3). Color
key: green, downregulation; red, upregulation. A scale for heat maps as minimum and maximum fold differences is presented. The Venn
diagrams present the numbers of mRNAs differentially expressed with statistical significance in the presence of the indicated siRNAs in
143B cells. The numbers of transcripts differentially expressed in the presence of both siRNAs specific for the same target are indicated in
diagram intersections.
siRNA off-target effects in different cell types S. Vankoningsloo et al.
2742 FEBS Journal 275 (2008) 2738–2753 ª 2008 The Authors Journal compilation ª 2008 FEBS
downregulation magnitudes after a 48 h transfection
(Fig. 9, columns 7 and 8) than after a 24 h transfection
(Fig. 9, columns 5 and 6). Similar conclusions can be
drawn from data obtained for cells transfected with
the NT siRNA (Fig. 9, columns 11 and 12 versus 9
and 10). Therefore, it seems that the longer the trans-
fection period, the stronger the off-target effects of
siRNA on gene expression.
mRNA homology with siRNA seed region
Perfect mRNA ⁄ siRNA pairing is not necessary for
siRNA off-target effects. Indeed, homology between
mRNA and siRNA seed region (encompassing nucleo-
tides 2–8 or 2–7 of the antisense strand) was shown to
be sufficient to induce off-target silencing [6,7,10].
Hence, we searched for regions of sequence homology
between the guide strands of the five siRNAs used in
this study and their respective unspecific targets
(Fig. 10). The transcripts used for this analysis were
found to be significantly downregulated in 143B, A549
and IMR-90 cells transfected for 24 h with the siRNAs
(Figs 3–5 and supplementary Tables S1–S12). For sev-
eral mRNAs, we found small stretches of sequence
identity with the 3¢-end of siRNA sense sequences
(5¢-end of antisense sequences). However, only 65% of
them (21 of 33) can lead to perfect mRNA pairing
with siRNA seed regions, as defined above. Therefore,
an important proportion (about 35%) of the siRNA
side effects observed here cannot be directly explained
by seed homology. This analysis was also repeated
with the siRNA passenger strands, but no perfect seed
match was found in these conditions (data not shown).
Discussion
It is now well established that off-target silencing is a
fundamental feature of siRNAs [5,6,9,14]. The present
investigation was conducted in order to increase our
knowledge about siRNA off-target effects under vari-
ous experimental conditions. Molecular signatures of
siRNAs were determined with a commercial low-
density microarray designed for siRNA side effect
studies. This microarray comprises 273 capture probes
0.50
2.10
0.50
2.00
00 12
SREBF1
s
iRNA1
SREBF1
s
iRNA2
80 10
LAMP2
s
iRNA1
LAMP2
s
iRNA2
NT_siRNA
SREBF1-siRNA2
SREBF1-siRNA1
DF
RAF1
GPX1
TERF1
MAP2K1
IGFBP3
CTNNB1
TGFBR2
YWHAZ
CCND1
RRM1
PLAUR
IL8
JUND
CDKN1A
PLAU
BIN1
MYC
JUN
CSF1
GADD45A
EGFR
NT_siRNA
LAMP2-siRNA2
LAMP2-siRNA1
DF
RAF1
GPX1
MAP2K1
TGFBR2
TERF1
RRM1
CTNNB1
IGFBP3
YWHAZ
CCND1
PLAUR
IL8
JUND
CDKN1A
PLAU
BIN1
MYC
JUN
CSF1
GADD45A
EGFR
AB
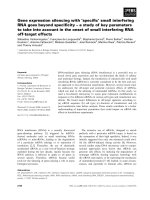
Fig. 4. Effect of the SREBF1-targeting and the LAMP2-targeting siRNAs on gene expression profiles analyzed by microarray in A549 cells.
Cells were incubated for 24 h with DF or transfected for 24 h with SREBF1 ⁄ siRNA1, SREBF1 ⁄ siRNA2 (A), LAMP2 ⁄ siRNA1, LAMP2 ⁄ siRNA2
(B) or the NT siRNA at 100 n
M before RNA extraction, reverse transcription, and processing for microarray analysis. Expression plots present
the genes displaying significant differences in relative transcript level between siRNA-transfected cells and DF-treated cells (n = 3). Color
key: green, downregulation, red, upregulation. A scale for heat maps as minimum and maximum fold differences is presented. The Venn
diagrams present the numbers of mRNAs differentially expressed with statistical significance in the presence of the indicated siRNAs in
A549 cells. The numbers of transcripts differentially expressed in the presence of both siRNAs specific for the same target are indicated in
diagram intersections.
S. Vankoningsloo et al. siRNA off-target effects in different cell types
FEBS Journal 275 (2008) 2738–2753 ª 2008 The Authors Journal compilation ª 2008 FEBS 2743
allowing the expression analysis, at the transcriptomic
level, of genes mainly involved in cell responses to
IFN challenge, apoptosis, DNA repair, cell cycle, and
metabolism.
The few effects of DF on gene expression were
found to be dependent on cell type. Indeed, whereas
variations observed in both 143B and A549 cells incu-
bated with DF alone were generally negligible, they
were more numerous in IMR-90 cells, as illustrated by
the slight but reproducible downregulation of ADPRT
(ADP-ribosyltransferase), CCNB1 (cyclin B1), DDIT3
(DNA-damage-inducible transcript 3), ICAM1, IG-
FBP3, PCNA, PRKDC (protein kinase, DNA-acti-
vated, catalytic polypeptide), SERPINE1 ⁄ PAI-1
(serpin peptidase inhibitor 1 ⁄ plasminogen activator
inhibitor-1), TFDP1 (transcription factor Dp-1),
TNFRSF10B (tumor necrosis factor receptor super-
family, member 10b) and TYMS (thymidylate synthe-
tase). This transfection reagent might therefore alter
some cellular processes in a cell type-dependent man-
ner. For instance, an increase in the cell cycle timing
could be expected following the downregulation of
PCNA, coding for a protein involved in the control of
DNA replication and CDK2-cyclin A activity [15].
In most cases (about 70%), and as expected,
DF-induced effects on gene expression were also
observed in the presence of any tested siRNA, as illus-
trated by the comparable downregulation of ADPRT
in IMR-90 cells in the presence of DF alone
(0.68 ± 0.25) or in combination with LAMP2 ⁄
siRNA2 (0.64 ± 0.17) or the NT siRNA (0.64 ± 0.12)
(supplementary Table S12; see also supplementary
Tables S9–S11). However, additional or antagonistic
effects of DF and siRNAs were also observed. For
example, the SERPINE1 mRNA level was reduced by
DF alone (0.65 ± 0.08) but was increased with statisti-
cal significance by LAMP2 ⁄ siRNA1 (2.24 ± 0.82) in
IMR-90 cells (supplementary Table S11).
The four targeting siRNAs used in this study pro-
vide efficient knockdown of their respective targets at
100 nm. This concentration might seem rather high,
but was chosen in order to generate side effects allow-
ing a comparative study of the importance of siRNA
sequence, cell type, transfection period and post-trans-
fection time before analysis. The differences in siRNA
on-target efficiencies observed between 143B, A549
and IMR-90 cells (Fig. 1), as previously found for
other cell lines [16], could probably be explained by
0.
35
1.50
0.35
2.40
703
SREBF1
siRNA1
SREBF1
siRNA2
90 1
LAMP2
siRNA1
LAMP2
siRNA2
NT_siRNA
SREBF1-siRNA2
SREBF1-siRNA1
DF
NT_siRNA
LAMP2-siRNA2
LAMP2-siRNA1
DF
MYBL2
BAD
UNG
MADH3
WARS
SERPINE1
ICAM1
IGFBP3
HIST1H3I
TGFBR2
HSPCA
MAPK1
SOD2
EGFR
JUND
MYBL2
BAD
UNG
MADH3
WARS
SERPINE1
ICAM1
IGFBP3
HIST1H3I
TGFBR2
HSPCA
MAPK1
SOD2
EGFR
JUND
AB
Fig. 5. Effect of the SREBF1-argeting and the LAMP2-targeting siRNAs on gene expression profiles analyzed by microarray in IMR-90 cells.
Cells were incubated for 24 h DF or transfected for 24 h with SREBF1 ⁄ siRNA1, SREBF1 ⁄ siRNA2 (A), LAMP2 ⁄ siRNA1, LAMP2 ⁄ siRNA2 (B)
or the NT siRNA at 100 n
M before RNA extraction, reverse transcription, and processing for microarray analysis. Expression plots present
the genes displaying significant differences in relative transcript level between siRNA-transfected cells and DF-treated cells (n = 3). Color
key: green, downregulation; red, upregulation. A scale for heat maps as minimum and maximum fold differences is presented. The Venn
diagrams present the numbers of mRNAs differentially expressed with statistical significance in the presence of the indicated siRNAs in
IMR-90 cells. The numbers of transcripts differentially expressed in the presence of both siRNAs specific for the same target are indicated
in diagram intersections.
siRNA off-target effects in different cell types S. Vankoningsloo et al.
2744 FEBS Journal 275 (2008) 2738–2753 ª 2008 The Authors Journal compilation ª 2008 FEBS
the expression level of the RNAi pathway components
in each cell type and ⁄ or by different transfection effi-
ciencies. These hypotheses highlight the importance of
the cellular environment in the determination of both
efficiency and specificity of siRNA molecules, not only
for in vitro studies, but also when siRNA-based thera-
peutic approaches are considered. Moreover, it was
suggested that the cellular background could modify
the degree of siRNA off-target effects elicited through
12 34 56 78 9
PLAU
NT_48h
NT_24h
NT_0h
SREBF1_48h
SREB1F_24h
SREB1F_0h
DF_48h
DF_24h
DF_0h
SPARC
CTGF
CDKN1B
HSPB1
MLH1
IGFBP2
BCL2L1
HSPCB
BIN1
K-ALPHA-1
ADPRT
ALDOA
CKB
CENPF
HPRT1
UNG
CCND2
CANX
CASP3
RAF1
UBE2V1
MAP2K1
EGFR
PLAUR
IGFBP3
A
B
Fig. 6. Kinetics of the gene expression profiles induced by
SREBF1 ⁄ siRNA1 in 143B cells. (A) Design of the experiment. The
24 h transfection period is indicated on a gray background. (B)
143B cells were incubated for 24 h with DF or transfected for 24 h
with SREBF1 ⁄ siRNA1 or the NT siRNA at 100 n
M. RNA was
extracted 0, 24 or 48 h post-transfection, reverse transcribed, and
processed for microarray analysis. Expression plots present the
genes displaying significant differences in relative transcript level
between siRNA-transfected cells and DF-treated cells (n = 3). Color
key: green, downregulation; red, upregulation. A scale for heat
maps as minimum and maximum fold differences is presented.
0.0
0.2
0.4
0.6
0.8
1.0
1.2
1.4
1.6
A
B
C
D
E
Rel. mRNA abundance
0 h 24 h 48 h
0 h 24 h 48 h
0 h 24 h 48 h
0 h 24 h 48 h
0 h 24 h 48 h
0.0
0.5
1.0
1.5
2.0
2.5
3.0
3.5
Rel. mRNA abundance
0.0
0.2
0.4
0.6
0.8
1.0
1.2
0.0
0.2
0.4
0.6
0.8
1.0
1.2
0.0
0.2
0.4
0.6
0.8
1.0
1.2
1.4
Rel. mRNA abundance
Rel. mRNA abundance
Rel. mRNA abundance
Fig. 7. Representative kinetic profiles of gene expression in 143B
cells incubated with DF (circles) or transfected with SREBF1 ⁄ siR-
NA1 (squares) or the NT siRNA (triangles). Gene expression was
analyzed by microarray 0, 24 and 48 h post-transfection, and pro-
files are illustrated for CDKN1B (A), PLAU (B), CCND2 (C), EGFR
(D) and IGFBP3 (E).
S. Vankoningsloo et al. siRNA off-target effects in different cell types
FEBS Journal 275 (2008) 2738–2753 ª 2008 The Authors Journal compilation ª 2008 FEBS 2745
an IFN response pathway, as the IFN response was
found to be stronger in TLR3-expressing cells [11] and
in nontumor cells [17]. However, genes classically asso-
ciated with the siRNA-induced IFN response, such as
IFITM2 (interferon-induced transmembrane protein 2),
IFNAR1 (interferon receptor 1) or IRF1 (interferon-
responsive factor 1), were not upregulated in the
presence of siRNAs, even in the TLR3-expressing
A549 cells or in the nonimmortalized IMR-90 cells.
We showed that two different siRNAs designed to
knock down SREBF1 can also modify the expression
of unintended genes in 143B, A549 and IMR-90 cells.
Interestingly, the sets of misregulated genes are not the
same for each siRNA. This lack of overlapping effects
rules out an indirect effect resulting from the silencing
of the transcription factor SREBF1, which would
modify gene expression in an siRNA-independent
manner. Therefore, these variations in mRNA abun-
dance can be considered as real siRNA off-target
effects. Similar conclusions can be drawn from experi-
ments performed with two other siRNAs targeting the
LAMP2 transcript. Furthermore, we observed that an
NT siRNA, used as a negative control in our experi-
ments, unexpectedly altered the expression of several
genes affected or not affected by the siRNAs targeting
SREBF1 or LAMP2. Thus, the unique nonspecific
molecular signature generated by each siRNA supports
previous studies showing that off-target effects are
dependent on siRNA sequence [6,7]. The role of
sequence pairing in siRNA side effects is also
supported by data showing that these effects can be
dramatically reduced in the presence of another con-
trol, the RNA-induced silencing complex (RISC)-free
siRNA (data not shown). Unlike the NT siRNA, this
negative control is not loaded onto RISC, is unable to
interact with mRNA, and thus cannot direct slicing. It
is also important to note that the unexpected effects of
the NT siRNA on gene expression underline the diffi-
culty of choosing the most relevant control in RNAi
experiments in order to obtain reliable results, as
emphasized recently [18].
The seed region is particularly important in siRNA
side effects, because mRNA ⁄ siRNA pairing in this
short region may be sufficient to induce mRNA deg-
radation [6,19]. Thus, we investigated whether siRNA
seed regions share homology with the sequences of
mRNAs downregulated directly after cell transfection
with SREBF1 ⁄ siRNA1, SREBF1 ⁄ siRNA2, LAMP2 ⁄
siRNA1, LAMP2 ⁄ siRNA2 or the NT siRNA. We
determined that about 35% of these downregulated
mRNAs do not show perfect sequence matching with
the seed region of the corresponding siRNA, suggest-
ing that these off-target effects are not directed by
seed pairing. These results might seem inconsistent
with the current description of siRNA off-targeting
mechanisms, in which seed regions play a predomi-
nant role [6,10]. It is possible that these 35% of seed-
independent variations represent a secondary effect
resulting from the downregulation of the 65% seed-
matching off-targets. However, as these variations
were observed at the earliest tested time point (0 h
post-transfection), we could not establish whether
these two categories of genes have different kinetics,
and thus could not determine the mechanisms gener-
ating all siRNA side effects, a point that will require
further investigation.
Sequence-dependent side effects of siRNAs on gene
expression are expected to be identical in different cell
types. Gene expression profiles obtained for 143B,
A549 and IMR-90 cells allow a cell type-to-cell type
comparison of siRNA side effects, but only for
0 h 24 h 48 h 72 h
0 h 24 h 48 h 72 h
Trans-
A
B
fection
Extraction
24 h post-T
Extraction
48 h post-T
20 genes
10 genes
4 genes
3 genes
SREBF1/siRNA1
NT siRNA
Trans-
fection
Extraction
0 h post-T
Extraction
24 h post-T
26 genes
27 genes
12 genes
15 genesNT siRNA
SREBF1/siRNA1
Fig. 8. Effect of two different transfection periods on gene expres-
sion profiles in 143B cells transfected with SREBF1 ⁄ siRNA1 or the
NT siRNA at 100 n
M. (A) Twenty-four hours of transfection and
RNA extraction 24 or 48 h post-transfection. (B) Forty-eight hours
of transfection and RNA extraction 0 or 24 h post-transfection.
Design of the experiments and number of genes differentially
expressed in siRNA-transfected cells when compared with
DF- treated cells.
siRNA off-target effects in different cell types S. Vankoningsloo et al.
2746 FEBS Journal 275 (2008) 2738–2753 ª 2008 The Authors Journal compilation ª 2008 FEBS
0.35
5.60
IGFBP5
DF_T24_E24
DF_T24_E48
DF_T48_E0
DF_T48_E24
SREBF1_T24_E24
SREBF1_T24_E48
SREBF1_T48_E0
SREBF_T48_E24
NT_T24_E24
NT_T24_E48
NT_T48_E0
NT_T48_E24
SPARC
MMP2
BCL6
S100A4
FOS
TFRC
ENPP1
PLAU
IGFBP
4
CTGF
CDH11
GSN
HSPB1
ITGA5
MMP14
CDKN1B
FGF2
PCNA
DHFR
UNG
KIF23
HSPCB
MLH1
IGFBP2
CAV1
EF21
BCL2L1
CDC42
PRAME
MADH1
BAX
CANX
MAPK9
UBE2C
RAD51
TFDP1
ADPRT
BIN1
K-ALPHA-1
CKB
ALDOA
CDK2
CENPF
TFDP2
TERT
TGFBR2
FGFR1
CASP3
CTSL
ABL1
UBE2V1
RAF1
BSG
TIMP1
COL6A2
MAP2K1
EGFR
CDH13
PLAUR
JUN
ITGA6
HPRT1
PLAT
WARS
TNFRSF10B
CCND2
TK1
DUSP1
Fig. 9. Effect of two different transfection
periods on gene expression profiles in 143B
cells transfected with SREBF1 ⁄ siRNA1 or
the NT siRNA at 100 n
M. 143B cells were
incubated for 24 h (T24) or 48 h (T48) with
DF or transfected for 24 h (T24) or 48 h
(T48) with SREBF1 ⁄ siRNA1 or the NT siRNA
at 100 n
M. RNA was extracted 0 h (E0),
24 h (E24) or 48 h (E48) post-transfection,
reverse transcribed, and processed for
microarray analysis. Expression plots pres-
ent the genes displaying significant differ-
ences in relative transcript level between
siRNA-transfected cells and DF-treated cells
(n = 3). Color key: green, downregulation;
red, upregulation. A scale for heat maps as
minimum and maximum fold differences is
presented.
S. Vankoningsloo et al. siRNA off-target effects in different cell types
FEBS Journal 275 (2008) 2738–2753 ª 2008 The Authors Journal compilation ª 2008 FEBS 2747
mRNAs abundant enough to be detected by the micro-
array in all cell types. Thus, after removing mRNAs
only detected in one or two cell types, we ended up
with a list of 33 mRNAs that are significantly down-
regulated by at least one of the five siRNAs in at least
one of the three cell types (supplementary Table S16).
We found that about 40% of these mRNAs (13 of 33)
were consistently downregulated in all cell types,
although statistical significance was only found for one
or two cell types. This could be a consequence of large
standard deviations, lack of standard deviations,
and ⁄ or insufficient number of replicates. Nevertheless,
the most interesting observation is that about 60% of
siRNA off-target effects are dependent on the cell type
(supplementary Table S16). These unexpected results
might imply that cell type-specific factors influence the
sets of transcripts affected by an siRNA of interest in
a particular cellular background.
It is also interesting to stress that siRNAs induce
reproducible upregulation of several mRNAs, although
the underlying mechanisms are unclear. siRNAs can
activate dsRNA-dependent protein kinase and TLR3
pathways, leading to the activation of transcription
factors involved in the IFN response, such as IRFs
and nuclear factor-jB [11,20]. However, as mentioned
above, no IFN response was observed in 143B, A549
or IMR-90 cells. In fact, the IFN response is activated
by dsRNAs longer than 21 bp, particularly in immune
cells [11]. Another explanation for gene upregulation
could be that siRNAs silence a transcript encoding a
transcriptional repressor, leading to the upregulation
of some transcripts controlled by this repressor.
In order to evaluate the time lapse during which
siRNA side effects can be observed, we established the
kinetics of the modifications in gene expression at 0,
24 and 48 h post-transfection in 143B cells transfected
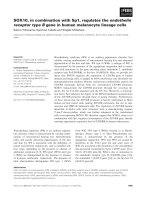
Fig. 10. Sequence alignments between siR-
NA sense strands and mRNAs downregulat-
ed by these siRNAs after 24 h of
transfection. Identical nucleotides in mRNA
and siRNA sequences are indicated on a
gray background, and mismatched nucleo-
tides on a white background. The degree of
sequence identity to siRNAs is indicated as
number of contiguous identical nucleo-
tides ⁄ total number of identical nucleotides.
Homology stretches fitting exactly with
siRNA seed regions (nucleotides 2–7 of the
siRNA antisense strand) are labeled ‘yes’ in
the seed region column.
siRNA off-target effects in different cell types S. Vankoningsloo et al.
2748 FEBS Journal 275 (2008) 2738–2753 ª 2008 The Authors Journal compilation ª 2008 FEBS
with SREBF1 ⁄ siRNA1 or the NT siRNA. A general
observation is that the strongest effect on untargeted
gene expression was found at 24 h post-transfection,
and it decreased thereafter. Thus, according to our
data, the undesired effects of siRNA seem to appear in
a transient way.
Another key parameter to take into account could
be the length of the transfection period. Although 24 h
of transfection has been frequently reported in the lit-
erature [21,22], a longer transfection period could be
chosen in order to improve or prolong siRNA action.
Therefore, we next compared the effect of a 24 h or
48 h transfection period on the siRNA off-target sig-
nature in 143B cells, and found a higher number of
genes differentially expressed with statistical signifi-
cance after a 48 h transfection. Moreover, as shown
for IGFBP4, IGFBP5, JUN or SPARC, the upregula-
tion or downregulation of several genes already
observed for a 24 h transfection time was enhanced
after a 48 h transfection. These data suggest that the
shortest transfection time should be preferred in order
to minimize the extent of siRNA side effects.
It is known that siRNA side effects are concentration-
dependent [8], and the lowest efficient concentration of
siRNA is usually recommended to prevent saturation of
the RNAi machinery and off-targeting. We also
observed that, when the siRNA concentration was low-
ered from 100 nm to 20 nm, the number of genes differ-
entially expressed with statistical significance and the
magnitude of gene upregulation and downregulation in
143B cells transfected with SREBF1 ⁄ siRNA1 were
reduced (supplementary Table S1). It is therefore
important to keep the siRNA concentration as low as
possible. However, off-target silencing can still be
observed for siRNA concentrations as low as 4 nm [7].
Hence, this parameter alone does not seem to be suffi-
cient to completely prevent the siRNA nonspecific
activity. A promising alternative strategy to decrease
siRNA side effects is the use of chemically modified
molecules such as 2¢-O-methylated siRNAs [23].
In conclusion, we have shown that the signature of
siRNAs on gene expression depends not only on
siRNA sequence but also on the cell type of interest,
and that important parameters must be considered in
order to minimize siRNA undesired effects: transfec-
tion period, time between transfection and analysis,
and siRNA concentration. Interestingly, 35% of the
observed effects cannot be explained by complete seed
pairing.
When analyzed directly after the transfection period,
the number of mRNAs differentially expressed in
response to each siRNA and in each cell type ranges
between one and 12 out of 273 genes, according to the
condition (between 0.4% and 4.4% of the genes that
can be analyzed by the microarray). A more restrictive
calculation excluding the transcripts that were not
detected in each condition leads to a range of 0.5–
6.3% of unintended mRNA variations. These results
cannot be extended to a genome-wide scale, because
the microarray is not representative of the whole gen-
ome; instead, its design is focused on cellular responses
to siRNA, IFN, DNA damage and apoptotic stimuli.
However, 6.3% of misregulated genes represents an
important proportion that could reflect numerous
modifications in gene expression at the transcriptomic
level. If these unintended modifications observed at the
transcript level were reflected at the protein level, it
would become likely, as recently observed [24], that
siRNA off-target effects would result in uncontrolled
impairment of cell physiology.
Experimental procedures
siRNA transfection
siRNA transfection experiments were performed using
dsRNA synthesized by Dharmacon (Lafayette, CO, USA).
Four siRNAs were designed for the specific silencing of
SREBF1 (NM_004176) and LAMP2 (NM_002294) tran-
scripts. Sense sequences for SREBF1 ⁄ siRNA1, SREBF1 ⁄
siRNA2, LAMP2 ⁄ siRNA1 and LAMP2 ⁄ siRNA2 are 5¢-
UGACUUCCCUGGCCUAUUUUU-3¢,5¢-ACAUUGAGC
UCCUCUCUUGUU-3¢,5¢-GAUAAGGUUGCUUCAGU
UAUU-3¢ and 5¢-ACAGUACGCUAUGAAACUAUU-3¢,
respectively. As a negative control, we used an NT siRNA
(5¢-UAGCGACUAAACACAUCAA-3¢) or a RISC-free
siRNA (proprietary sequence) from Dharmacon. Cells were
transfected with DF (T-2001; Dharmacon) at 1.5 lLÆlg
)1
siRNA. The transfection efficiency in 143B cells plated on
coverslips was determined using fluorescein isothiocyanate-
labeled siRNA (Silencer siRNA Labeling kit; Ambion,
Austin, TX, USA) and evaluated as 90–95% after 24 h by
cell counting using a confocal microscope (Leica, Wetzlar,
Germany) (data not shown).
siRNA efficiency for SREBF1 and LAMP2 expression
was determined by either real-time PCR using specific prim-
ers or by western blotting analysis. 143B, IMR-90 and
A549 cells were seeded in culture plates (Corning, Lowell,
MA, USA) at 25 000 cellsÆcm
)2
(143B and IMR-90) or
50 000 cellsÆcm
)2
(A549) 24 h before being transfected with
DF for 24 h with 100, 50, 20 or 5 nm siRNA. Media were
replaced and gene silencing was verified 0, 24, 48 or 72 h
post-transfection. For DNA microarray experiments, 143B,
IMR-90 and A549 cells were seeded as above and then
transfected with DF for 24 or 48 h with 100 or 20 nm
siRNA. Total RNA was extracted 0, 24 or 48 h post-
transfection and then processed for microarray analysis.
S. Vankoningsloo et al. siRNA off-target effects in different cell types
FEBS Journal 275 (2008) 2738–2753 ª 2008 The Authors Journal compilation ª 2008 FEBS 2749
Real-time PCR
After cell transfection with siRNAs, total RNA was
extracted using the Total RNAgent extraction kit (Pro-
mega, Madison, WI, USA). mRNA contained in 5 lgof
total RNA was reverse transcribed using SuperScript II
Reverse Transcriptase (Invitrogen, Carlsbad, CA, USA)
according to the manufacturer’s instructions. Forward and
reverse primers for SREBF1 (forward, 5¢-GGCCCAG
GTGACTCAGCTATT-3¢; reverse, 5¢-AGGGCATCCGA
GAATTCCTT-3¢), LAMP2 (forward, 5¢-TCAGCATTGC
AAATAACAATCTCA-3¢; reverse, 5¢-CAGTCTGCTCT
TTGTTGCACATATAA-3¢), CTGF (forward, 5¢-CA
AGCTGCCCGGGAAAT-3¢; reverse, 5¢-GGACCAGGCA
GTTGGCTCTA-3¢), JUN (forward, 5¢-GGATCAAGGC
GGAGAGGAA-3¢;reverse,5¢-TCCAGCCGGGCGATT-3¢),
PLAU (forward, 5¢-CTGTGACCAGCACTGTCT
CAGTTT-3¢; reverse, 5¢ -CCCAGTGAGGATTGGATGA
ACTA-3¢), SPARC (forward, 5¢-GAGACCTGTGACCT
GGACAATG-3¢; reverse, 5¢-GGAAGGAGTGGATTTAG
ATCACAAGA-3¢), TGFBR2 (forward, 5¢-TGGACCCT
ACTCTGTCTGTGGAT-3¢; reverse, 5¢-TTCTGGAGC
CATGTATCTTGCA-3¢) and TBP ⁄ TFIID (forward,
5¢-CCTCACAGGTCAAAGGTTTACAGTAC-3¢; reverse,
5¢
-GCTGAGGTTGCAGGAATTGAA-3¢) were designed
using primer express 1.5 software (Applied Biosystems,
Foster City, CA, USA). Amplification reaction assays con-
tained SYBR Green PCR Mastermix (Applied Biosystems)
and primers (Applied Biosystems) at 300 nm. A hot start at
95 °C for 5 min was followed by 40 cycles at 95 °C for 15 s
and 65 °C for 1 min using an ABI PRISM 7000 SDS ther-
mal cycler (Applied Biosystems). TBP ⁄ TFIID was used as
the reference gene for normalization and relative mRNA
steady-state level quantification. Melting curves were gener-
ated after amplification, and data were analyzed using the
thermal cycler software. Each sample was tested in
duplicate.
Clear cell lysate preparation and western blotting
analysis
143B cells were transfected in 12-well plates (Corning) as
described above. Cells were then rinsed with 1.5 mL of
NaCl ⁄ P
i
and lysed in 200 lL of cold lysis buffer (20 mm
Tris, pH 7.4, 150 mm NaCl, 1 mm EDTA, 1% Triton
X-100) containing protease inhibitors (Roche, Basel,
Switzerland). Clear cell lysates were prepared, and protein
contents were determined by the Bradford method (Pierce,
Rockford, IL, USA).
Samples corresponding to 25 lg of protein were prepared
in Laemmli SDS loading buffer, resolved on 10%
SDS ⁄ PAGE, and transferred to poly(vinylidene difluoride)
membranes (Millipore, Billerica, MA, USA). For SREBF1,
LAMP2 and a-tubulin detection, membranes were blocked
for 2 h in NaCl ⁄ Tris-T (20 mm Tris, pH 7.4, 150 mm NaCl,
0.1% Tween-20) containing 2% dry milk (Amersham, Pis-
cataway, NJ, USA) and incubated for 2 h (SREBF1) or 1 h
(a-tubulin) with either mouse anti-SREBF1 IgG (BD
Pharmingen, Mississauga, Canada) at a 1 : 5000 dilution or
mouse anti-a-tubulin IgG (Sigma, Saint Louis, MO, USA)
at a 1 : 30 000 dilution. The blots were washed and pro-
teins were visualized with horseradish peroxidase-conju-
gated anti-(mouse IgG) (Dako, Glostrup, Denmark) and an
ECL system (Amersham). Equal protein loading was
checked by the immunodetection of a-tubulin.
Low-density DNA microarray
Array design
We used a low-density DNA microarray (DualChip human
RNAi side effect; Eppendorf, Westbury, NY, USA) allow-
ing gene expression analysis for 273 genes, including genes
related to IFN response, apoptosis, proliferation, DNA
repair, metabolism, and intracellular signaling (see supple-
mentary Table S17 for the list of genes and supplementary
Fig. S1 for the array design). Results from reliable and vali-
dated low-density arrays were reported elsewhere [25–28].
The method is based on a system with two arrays on a
glass slide and three identical subarrays (triplicate spots)
per array. The reliability of hybridizations and experimental
data was evaluated using several positive and negative
hybridization controls, as well as detection controls spotted
on the microarray.
RNA reverse transcription and cDNA hybridiza-
tion
After cell transfection with siRNAs, total RNA was
extracted with the Total RNAgents extraction kit (Pro-
mega), quality was checked with a bioanalyzer (Agilent
Technologies, Santa Clara, CA, USA), and 10 lg (143B
cells) or 20 lg (IMR-90 and A549 cells) was used for
reverse transcription in the presence of biotin-11-dCTP,
biotin-11-dATP (Perkin-Elmer, Waltham, MA, USA) and
Superscript II Reverse Transcriptase (Invitrogen), as
described previously [25]. Six synthetic poly(A)-tailed RNA
standards (Eppendorf) were spiked into the purified RNA
in order to quantify the experimental variation introduced
during labeling and analysis. For each condition, three
independent experiments were performed in triplicate, pro-
viding hybridizations on nine arrays carried out as
described by the manufacturer and reported previously [25].
Detection was performed with cyanin 3-conjugated
anti-biotin IgG (Jackson Immuno Research Laboratories,
West Grove, PA, USA). Fluorescence of hybridized arrays
was scanned using the Packard ScanArray (Perkin-Elmer)
at a resolution of 10 lm. To maximize the dynamic range
of detection, the same arrays were scanned with different
photomultiplier gains in order to quantify both the high-
siRNA off-target effects in different cell types S. Vankoningsloo et al.
2750 FEBS Journal 275 (2008) 2738–2753 ª 2008 The Authors Journal compilation ª 2008 FEBS
copy and low-copy expressed genes. The scanned 16-bit
images were imported into imagene 5.5 software (BioDis-
covery, El Segundo, CA, USA) to quantify signal intensi-
ties. The fluorescence intensity of each DNA spot (median
intensity of all pixels present within the spot) was calculated
using local mean background subtraction. A signal was
only accepted when the average intensity after background
subtraction was at least two times higher than the local
background around the spot. Intensity values of triplicate
fluorescent signals were averaged and used to calculate the
intensity ratio between the test and the reference.
Data normalization and statistical analysis
The data were normalized in a two-step procedure. First, a
correction was applied using a factor calculated from the
intensity ratios of internal standards in the test and refer-
ence samples. The presence of the internal standard probes
at different locations of the array allowed quantification of
the local background and evaluation of the array homoge-
neity, which is taken into account in the normalization.
Furthermore, in order to consider the purity and quality of
the mRNA, a second normalization step was performed on
the basis of the average of fluorescence intensities measured
for a set of housekeeping genes (between three and 10,
according to the experiment).
All experiments were carried out in triplicate (n = 3), and
ratios representing the relative transcript levels are presented
as the mean ± standard deviation. Statistical analyses were
performed using sigmastat 3.1 software, in order to test
the significance of the differences between relative transcript
levels in siRNA-transfected cells and in DF-treated cells.
anova1s with an a-level of 0.050 were performed by the
Holm–Sidak test after a systematic check of the normality
test and the equal variance test. Transcript level variations
were considered to be statistically significant for P < 0.05.
Hierarchical clustering of gene expression profiles was per-
formed using the online epclust software (http://www.
bioinf.ebc.ee/EP/EP/EPCLUST/). Genes were clustered
using average linkage with the Manhattan distance metric.
Sequence alignments
cDNA sequences from NCBI database and siRNA sense
sequences were aligned using fasta 3.4 [29] with the
settings described previously [6].
Acknowledgements
The authors are grateful to Eppendorf’s group (Ham-
burg, Germany) and staff members for careful reading,
comments and suggestions. This work was supported
by the ‘Region Wallonne’ (Ministry for Research and
New Technologies and International Relations,
Program ST4772-QUIV ⁄ ML, Namur, Belgium). The
authors also acknowledge financial support through
the Belgian Program on Interuniversity Attraction
Poles (IAP 6 ⁄ 02) and the ‘Action de Recherche
Concerte
´
e’ (ARC) funded by the ‘Gouvernement de la
Communaute
´
Wallonie-Bruxelles’.
References
1 Fire A, Xu S, Montgomery MK, Kostas SA, Driver SE
& Mello CC (1998) Potent and specific genetic interfer-
ence by double-stranded RNA in Caenorhabditis
elegans. Nature 391, 806–811.
2 Chu CY & Rana TM (2007) Small RNAs: regulators and
guardians of the genome. J Cell Physiol 213, 412–419.
3 Martin SE & Caplen NJ (2007) Applications of RNA
interference in mammalian systems. Annu Rev Genomics
Hum Genet 8, 81–108.
4 Elbashir SM, Martinez J, Patkaniowska A, Lendeckel
W & Tuschl T (2001) Functional anatomy of siRNAs
for mediating efficient RNAi in Drosophila melanogaster
embryo lysate. EMBO J 20, 6877–6888.
5 Summerton JE (2007) Morpholino, siRNA, and
S-DNA compared: impact of structure and mechanism
of action on off-target effects and sequence specificity.
Curr Top Med Chem 7, 651–660.
6 Jackson AL, Burchard J, Schelter J, Chau BN, Cleary
M, Lim L & Linsley PS (2006) Widespread siRNA
‘off-target’ transcript silencing mediated by seed region
sequence complementarity. RNA 12, 1179–1187.
7 Jackson AL, Bartz SR, Schelter J, Kobayashi SV,
Burchard J, Mao M, Li B, Cavet G & Linsley PS
(2003) Expression profiling reveals off-target gene regu-
lation by RNAi. Nat Biotechnol 21, 635–637.
8 Persengiev SP, Zhu X & Green MR (2004) Nonspecific,
concentration-dependent stimulation and repression of
mammalian gene expression by small interfering RNAs
(siRNAs). RNA 10, 12–18.
9 Snove O & Holen T (2004) Many commonly used
siRNAs risk off-target activity. Biochem Biophys Res
Commun 319, 256–263.
10 Birmingham A, Anderson EM, Reynolds A, Ilsey-Tyree
D, Leake D, Fedorov Y, Baskerville S, Maksimova E,
Robinson K, Karpilow J et al. (2006) 3¢-UTR seed
matches, but not overall identity, are associated with
RNAi off-targets. Nat Methods 3, 199–204.
11 de Veer MJ, Sledz CA & Williams BR (2005) Detection
of foreign RNA: implications for RNAi. Immunol Cell
Biol 83, 224–228.
12 Klatt AR, Klinger G, Zech D, Paul-Klausch B, Renno
JH, Schmidt J, Malchau G & Wielckens K (2007)
RNAi in primary human chondrocytes: efficiencies,
kinetics, and non-specific effects of siRNA-mediated
gene suppression. Biologicals 35, 321–328.
S. Vankoningsloo et al. siRNA off-target effects in different cell types
FEBS Journal 275 (2008) 2738–2753 ª 2008 The Authors Journal compilation ª 2008 FEBS 2751
13 Hou YF, Zhou YC, Zheng XX, Wang HY, Fu YL,
Fang ZM & He SH (2006) Modulation of expression
and function of Toll-like receptor 3 in A549 and H292
cells by histamine. Mol Immunol 43, 1982–1992.
14 Zeng Y, Yi R & Cullen BR (2003) MicroRNAs and
small interfering RNAs can inhibit mRNA expression
by similar mechanisms. Proc Natl Acad Sci USA 100,
9779–9784.
15 Maga G & Hubscher U (2003) Proliferating cell nuclear
antigen (PCNA): a dancer with many partners. J Cell
Sci 116, 3051–3060.
16 Bantounas I, Phylactou LA & Uney JB (2004) RNA
interference and the use of small interfering RNA to
study gene function in mammalian systems. J Mol
Endocrinol 33, 545–557.
17 Stojdl DF, Lichty B, Knowles S, Marius R, Atkins H,
Sonenberg N & Bell JC (2000) Exploiting tumor-specific
defects in the interferon pathway with a previously
unknown oncolytic virus. Nat Med 6, 821–825.
18 Sarov M & Stewart AF (2005) The best control for the
specificity of RNAi. Trends Biotechnol 23, 446–448.
19 Lim LP, Lau NC, Garrett-Engele P, Grimson A, Schel-
ter JM, Castle J, Bartel DP, Linsley PS & Johnson JM
(2005) Microarray analysis shows that some microR-
NAs downregulate large numbers of target mRNAs.
Nature 433, 769–773.
20 Alexopoulou L, Holt AC, Medzhitov R & Flavell RA
(2001) Recognition of double-stranded RNA and acti-
vation of NF-kappaB by Toll-like receptor 3. Nature
413, 732–738.
21 Zerr-Fouineau M, Chataigneau M, Blot C & Schini-
Kerth VB (2007) Progestins overcome inhibition of
platelet aggregation by endothelial cells by down-regu-
lating endothelial NO synthase via glucocorticoid recep-
tors. FASEB J 21 , 265–273.
22 Chung S, Brown JM, Provo JN, Hopkins R & McIn-
tosh MK (2005) Conjugated linoleic acid promotes
human adipocyte insulin resistance through NFkappaB-
dependent cytokine production. J Biol Chem 280,
38445–38456.
23 Snove O & Rossi JJ (2006) Chemical modifications
rescue off-target effects of RNAi. ACS Chem Biol 1,
274–276.
24 Fedorov Y, Anderson EM, Birmingham A, Reynolds
A, Karpilow J, Robinson K, Leake D, Marshall WS
& Khvorova A (2006) Off-target effects by siRNA can
induce toxic phenotype. RNA 12, 1188–1196.
25 de Longueville F, Surry D, Meneses-Lorente G,
Bertholet V, Talbot V, Evrard S, Chandelier N, Pike A,
Worboys P, Rasson JP et al. (2002) Gene expression
profiling of drug metabolism and toxicology markers
using a low-density DNA microarray. Biochem Pharma-
col 64, 137–149.
26 de Longueville F, Atienzar FA, Marcq L, Dufrane S,
Evrard S, Wouters L, Leroux F, Bertholet V, Gerin B,
Whomsley R et al. (2003) Use of a low-density micro-
array for studying gene expression patterns induced by
hepatotoxicants on primary cultures of rat hepatocytes.
Toxicol Sci 75, 378–392.
27 Debacq-Chainiaux F, Borlon C, Pascal T, Royer V,
Eliasers F, Ninane N, Carrard G, Friguet B, de Long-
ueville F, Boffe S et al. (2005) Repeated exposure of
human skin fibroblasts to UVB at subcytotoxic level
triggers premature senescence through the TGF-beta1
signaling pathway. J Cell Sci 118, 743–758.
28 Vankoningsloo S, Piens M, Lecocq C, Gilson A,
De Pauw A, Renard P, Demazy C, Houbion A, Raes
M, Arnould T et al. (2005) Mitochondrial dysfunction
induces triglyceride accumulation in 3T3-L1 cells: role of
fatty acid beta-oxidation and glucose. J Lipid Res 46
,
1133–1149.
29 Pearson WR & Lipman DJ (1988) Improved tools for
biological sequence comparison. Proc Natl Acad Sci
USA 85, 2444–2448.
Supplementary material
The following supplementary material is available
online:
Fig. S1. DualChip Human RNAi side effect design.
Table S1. Effects of DharmaFECT1 (DF), SREBF1 ⁄
siRNA1 at 100 nm (S100) or 20 nm (S20) and the non-
targeting (NT) siRNA at 100 nm (N100) or 20 nm
(N20) on gene expression in 143B cells analyzed 0 h
post-transfection (transfection duration of 24 h).
Table S2. Effects of DharmaFECT1 (DF), SREBF1 ⁄
siRNA2 at 100 nm (S100) and the nontargeting (NT)
siRNA at 100 nm (N100) on gene expression in 143B
cells analyzed 0 h post-transfection (transfection dura-
tion of 24 h).
Table S3. Effects of DharmaFECT1 (DF), LAMP2 ⁄
siRNA1 at 100 nm (L100) and the nontargeting (NT)
siRNA at 100 nm (N100) on gene expression in 143B
cells analyzed 0 h post-transfection (transfection dura-
tion of 24 h).
Table S4. Effects of DharmaFECT1 (DF), LAMP2 ⁄
siRNA2 at 100 nm (L100) and the nontargeting (NT)
siRNA at 100 nm (N100) on gene expression in 143B
cells analyzed 0 h post-transfection (transfection dura-
tion of 24 h).
Table S5. Effects of DharmaFECT1 (DF), SREBF1 ⁄
siRNA1 at 100 nm (S100) and the nontargeting (NT)
siRNA at 100 nm (N100) on gene expression in A549
cells analyzed 0 h post-transfection (transfection dura-
tion of 24 h).
Table S6. Effects of DharmaFECT1 (DF), SREBF1 ⁄
siRNA2 at 100 nm (S100) and the nontargeting (NT)
siRNA at 100 nm (N100) on gene expression in A549
siRNA off-target effects in different cell types S. Vankoningsloo et al.
2752 FEBS Journal 275 (2008) 2738–2753 ª 2008 The Authors Journal compilation ª 2008 FEBS
cells analyzed 0 h post-transfection (transfection dura-
tion of 24 h).
Table S7. Effects of DharmaFECT1 (DF), LAMP2 ⁄
siRNA1 at 100 nm (L100) and the nontargeting (NT)
siRNA at 100 nm (N100) on gene expression in A549
cells analyzed 0 h post-transfection (transfection dura-
tion of 24 h).
Table S8. Effects of DharmaFECT1 (DF), LAMP2 ⁄
siRNA2 at 100 nm (L100) and the nontargeting (NT)
siRNA at 100 nm (N100) on gene expression in A549
cells analyzed 0 h post-transfection (transfection dura-
tion of 24 h).
Table S9. Effects of DharmaFECT1 (DF), SREBF1 ⁄
siRNA1 at 100 nm (S100) and the nontargeting (NT)
siRNA at 100 nm (N100) on gene expression in
IMR90 cells analyzed 0 h post-transfection (transfec-
tion duration of 24 h).
Table S10. Effects of DharmaFECT1 (DF), SREBF1 ⁄
siRNA2 at 100 nm (S100) and the nontargeting (NT)
siRNA at 100 nm (N100) on gene expression in
IMR90 cells analyzed 0 h post-transfection (transfec-
tion duration of 24 h).
Table S11. Effects of DharmaFECT1 (DF), LAMP2 ⁄
siRNA1 at 100 nm (L100) and the nontargeting (NT)
siRNA at 100 nm (N100) on gene expression in
IMR90 cells analyzed 0 h post-transfection (transfec-
tion duration of 24 h).
Table S12. Effects of DharmaFECT1 (DF), LAMP2 ⁄
siRNA2 at 100 nm (L100) and the nontargeting (NT)
siRNA at 100 nm (N100) on gene expression in
IMR90 cells analyzed 0 h post-transfection (transfec-
tion duration of 24 h).
Table S13. Validation of microarray data by real-time
PCR.
Table S14. Effects of DharmaFECT1 (DF), the
SREBF1-specific siRNA at 100 nm (S100) and the
nontargeting (NT) siRNA at 100 nm (N100) on gene
expression in 143B cells analyzed 24 h or 48 h post-
transfection (transfection duration of 24 h).
Table S15. Effects of DharmaFECT1 (DF), the
SREBF1-specific siRNA at 100 nm (S100) and the
nontargeting (NT) siRNA at 100 nm (N100) on gene
expression in 143B cells analyzed 0 h or 24 h post-
transfection (transfection duration of 48 h).
Table S16. List of high-copy mRNAs downregulated
in the presence of the siRNAs.
Table S17. List of genes analyzed with the DualChip
Human RNAi Side Effect microarray.
This material is available as part of the online article
from
Please note: Blackwell Publishing are not responsible
for the content or functionality of any supplementary
materials supplied by the authors. Any queries (other
than missing material) should be directed to the corre-
sponding author for the article.
S. Vankoningsloo et al. siRNA off-target effects in different cell types
FEBS Journal 275 (2008) 2738–2753 ª 2008 The Authors Journal compilation ª 2008 FEBS 2753