Study on Strategic Evaluation on Transport Investment Priorities under Structural and Cohesion funds for the Programming Period 2007-2013 docx
Bạn đang xem bản rút gọn của tài liệu. Xem và tải ngay bản đầy đủ của tài liệu tại đây (4.8 MB, 87 trang )
Study on Strategic Evaluation on
Transport Investment Priorities
under Structural and Cohesion
funds for the Programming Period
2007-2013
N
o
2005.CE.16.0.AT.014
Country Report Latvia
Final Report
Client: European Commission, DG-REGIO
ECORYS Nederland BV
Rotterdam, September 2006
ECORYS Nederland BV
P.O. Box 4175
3006 AD Rotterdam
Watermanweg 44
3067 GG Rotterdam
The Netherlands
T +31 (0)10 453 88 00
F +31 (0)10 453 07 68
E
W www.ecorys.com
Registration no. 24316726
ECORYS Transport
T +31 (0)10 453 87 59
F +31 (0)10 452 36 80
Table of contents
1 Introduction 7
1.1 Background 7
1.2 The Strategic Evaluation 8
1.3 The Country Report 8
1.4 Structure of the report 8
2 Transport Sector: current situation 10
2.1 Introduction 10
2.2 Latvia 10
2.3 Situation per mode of transport 12
2.3.1 Roads and road transport 12
2.3.2 Railways 14
2.3.3 Urban transport 17
2.3.4 Inland waterway transport 17
2.3.5 Sea ports 17
2.3.6 Airports 19
2.3.7 Trends and indicators 20
2.4 Conclusions: SWOT analysis transport system 23
3 Accessibility analysis 25
3.1 Introduction 25
3.2 Methodology: Accessibility Problem Index 25
3.3 Transport needs 26
4 Previous support programmes 32
4.1 National public funding for transport infrastructure 32
4.2 EU funding 33
4.3 Other sources of financing 34
5 National Transport Strategy 37
5.1 Introduction 37
5.2 Long term National Transport Strategy and Planning 37
5.3 Operational programme 2007-2013 40
6 Prioritisation of Transport Investments (2007-2013) 43
6.1 Introduction 43
6.2 Community Strategic Guidelines 44
6.3 Additional factors for the prioritisation of transport investments 45
7 Assessment of Impacts 49
7.1 Introduction 49
7.2 Methodology 49
7.3 Scenarios 51
7.4 Impact assessment 57
7.5 European effects 68
8 Conclusions on investment priorities 73
8.1 Introduction 73
8.2 Transport investment priorities 2007-2013 73
8.2.1 National and Regional and Local Needs 73
8.2.2 Needs per sub-sector 74
Annex A: TEN-T priorities 77
Annex B: Accessibility “red flag” analysis 83
7
1 Introduction
1.1 Background
The recent enlargement of the EU to 25 Member States clearly creates a new challenge
for its Cohesion Policy. Disparity levels within the EU have increased substantially and
will further increase with the accession of Bulgaria and Romania in 2007. This is an
explicit point of attention as the Treaty states that, in order to strengthen its economic and
social cohesion, the Community shall aim at reducing the disparities between the levels of
development of various regions and the backwardness of the least favoured regions or
islands, including rural areas. This aim lies at the core of the Commission’s regional
policy.
One of the key elements of the cohesion policy of the Commission is the contribution of
the development of new transport infrastructure to regional economic development.
Extensive spending has taken place in this domain under ERDF, Cohesion Fund and
ISPA.
One of the prominent initiatives in the European Union in this respect is the development
of the Trans-European transport networks (TEN-T). In 2003 the Commission has
identified the 30 priority projects of the TEN-T up to 2020.
1
The priority projects include:
“the most important infrastructures for international traffic, bearing in mind the general
objectives of the cohesion of the continent of Europe, modal balance, interoperability and
the reduction of bottlenecks”.
For the new programming period 2007-2013 the Commission seeks to strengthen the
strategic dimension of cohesion policy to ensure that Community priorities are better
integrated into national and regional development programmes. In accordance with the
draft Council Regulation (article 23), the Council establishes Community Strategic
Guidelines for cohesion policy to “give effect to the priorities of the Community with a
view to promote balanced, harmonious and sustainable development”
2
.
To assess the impact of programmes in relation to Community and national priorities the
Commission has indicated that evaluations on a strategic level should be undertaken. The
present evaluation should be seen as one of these specific strategic evaluations. The
strategic evaluation should feed in the process of determining transport investment
priorities and the preparation of the national strategic reference frameworks and
1
Decision 884/2004/EC of 29 April 2004. The total investment of the 30 priority projects amounts to € 225 billion at the 2020
horizon.
2
COM(2004)492
8
operational programmes. As such, it should serve to enhance the quality, effectiveness
and consistency of Fund assistance.
1.2 The Strategic Evaluation
The strategic evaluation is directed the transport sector.
Three specific objectives have been formulated for this strategic evaluation:
• To provide an analysis of the situation in selected fields relevant to transport, using
structural indicators across Member States, plus Romania and Bulgaria;
• To assess the contribution of Structural and Cohesion funds relative to the current
and previous programming periods and draw lessons of relevance for the purpose of
the study in terms of identification of potential shortcomings in the development of
transport priority projects that might have hampered the utilization of those funds or
their expected benefits;
• To identify and evaluate needs in the selected fields and identify potential investment
priorities of structural and cohesion funds for the programming period 2007-2013.
1.3 The Country Report
The strategic evaluation results in specific country reports for all 15 countries and a
synthesis report. The current report is the Country Report for Latvia. Its main aim is to
give a more detailed indication of the strengths and weaknesses of the transport system in
the country and to address areas for future intervention. Where relevant this accompanied
by recommendations with respect to the overall transport policy of the country. The
country reports feed into the joint programming effort with the Member States for the
next period, as will be detailed in the National Strategic Reference Frameworks and the
subsequent Operational Programmes.
1.4 Structure of the report
The report is structured around three building blocks.
• First a needs assessment is presented based on an analysis of the current transport
systems and a modelling analysis which reveals the current (relative) level of
accessibility per region. This leads to first conclusions strengths and weaknesses
of the current transport system and related transport investment needs (Part A).
• Next an overview is presented of the transport investment priorities in the past
period (Part B).
• Finally, future areas for priority transport investments are identified. This builds
on the needs assessment in the first part but also addresses other factors such as
the contribution to EU and national policy objectives, the availability of other
sources of funding and the administrative capacity of the country (Part C).
9
Part A: Needs assessment current situation
10
2 Transport Sector: current situation
2.1 Introduction
This chapter describes the current transport situation and policy in Latvia. After a brief
introduction on the geographical and economic characteristics of the country, it first
describes the situation per mode of transport. The analysis of the current situation is
summarized in a SWOT table on the main strengths and weaknesses. The assessment of
the transport system is followed by an analysis of the key transport policy issues in
Latvia.
2.2 Latvia
Located in the north-eastern of Europe, geographically Latvia could be considered as
being located at the periphery of the European Union. However, bordering the Baltic Sea
on one side and located between its two fellow Baltic States - Estonia to the north and
Lithuania to the south - and Russia and Belarus to the east, Latvia is at a strategic
geographical location in the North-east of Europe.
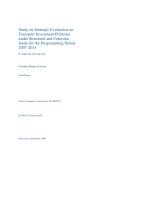
Figure 2.1 Map of Latvia
Most of the country is composed of fertile, low-lying plains, with some hills in the east.
There are not many natural barriers, except for the rivers, especially the biggest one – the
Daugava. Latvia’s coastline is 494 kilometres and it has three important ice-free sea ports.
These conditions favour Latvia as an important transit corridor to Russia and other CIS
11
countries. The backbone of Latvia's multi-modal transport corridor are the east-west
railway and pipeline systems concluding at the major ports.
Latvia is involved in the priority project number 27: ‘Rail Baltica’ axis Warsaw-Kaunas-
Riga-Tallinn-Helsinki.
Basic data
Population 2.3 million
Total area 64,589 km
2
Population density 37 inh/km
2
Main cities Riga, Daugavpils, Liepāja, Jelgava
Source: Eurostat
The population is about 2.3 million inhabitants. One third of the population lives in the
only large city – the capital Riga. The rest of the country has a very low population
density, one of the lowest in the EU.
Economic data
GDP (PPP, 2004) 20,6 bn€
Government debt as % of GDP (2004) 14,6
Government deficit as % of GDP (2004) 0,9
GDP per capita, Latvia (2004) 9,700 €
GDP per capita, EU15 (2004) 25,700 €
GDP per capita, EU25 (2004) 22,600 €
Source: Eurostat
Latvia is among the poorest in the EU (only 43% of the EU average in GDP per capita)
and that might be one of the reasons that the level of passenger traffic is rather low.
According to official data Latvia’s GDP has increased by an average 7.7% annually since
2000. This is the highest growth rate among the EU New Member states. Real per capita
GDP has grown by more than 50% compared to its 1995 level and it is expected that the
annual growth rates of about 6% in medium term. At the same time, current account
deficit (ranging from 7% to 10% in the past 3 years) remains one of the key
vulnerabilities of the Latvian economy.
Due to Latvia's geographic location, the transport sector, particularly freight transit, plays
a key role in the economy of the country. Transport, storage and communications
comprise approximately 16% of the GDP. The transport and communications sector is
one of the most dynamic and accounts for about 30% of all direct foreign investment
3
.
Freight shipments between Russia and the CIS, and the West, are the core of the transit
industry in Latvia. Freight shipments from Russia and other CIS countries to the West are
the core of the transit industry in Latvia. The centres of the freight transit industry are the
seaports of Riga, Ventspils and to a lesser extent Liepaja.
3
Finanšu ministrija, Reference Framework for assistance from the Cohesion Fund 2004-2006
12
2.3 Situation per mode of transport
2.3.1 Roads and road transport
The Latvian State Roads performs the management of the state road network,
administration of the State Road Fund and organisation of public procurement for the
state road network. Maintenance and development of parish, company and household
roads is supervised, as well.
Infrastructure
Latvia has a quite dense network of roads. In 2005 there were 6,962 km of highways
(main roads (A) and 1
st
class roads (P)), 13,264 km of secondary roads, and 31.500 km of
municipal roads in Latvia.
Table 2.1 Length of road network in Latvia (1994-2004) in kms
1995 2005
% change
State roads: 20.400 20.227 -0,8%
Main roads (A) Na 1.622
1
st
class roads (P) Na 5.340
2
nd
class roads (V) Na 13.264
Local (municipal) roads
30.800 31.500 2,3%
Source: Eurostat; SCB, 2006
Most of the roads in Latvia are outworn and in need of renovation. Latvia is working on
the reconstruction of state and first class roads and a number of bridges in order to
increase the road bearing capacity. Besides the bad condition of the state roads, Latvia
has a problem due to the many unpaved roads. These are not accessible throughout the
year for all road vehicles and have a decreased visibility. The focus in important state
programmes lies on road maintenance and the promotion of further inclusion of Latvian
roads into the European road network. The upgrading of road sections, often financed by
with European (co)funding, is also covered by the state programmes
The average density of the Latvia (state) road network is 315 km per 1000 sq. km, which
can be considered as sufficient, taking into account the population and territory.
Therefore, construction of new roads is foreseen only for eliminating of bottlenecks
(bypasses of cities etc.).
The main national roads connect the road network of the Republic of Latvia with the road
networks of other countries, as well as, the capital city Riga with district administrative
centres.
13
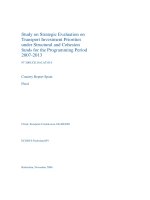
Figure 2.2 Motorway network in Latvia
Source: Latvian State Roads, 2006
Demand
Car ownership in Latvia has grown from 106 cars/ 1000 inhabitants in 1990 to 297 in
2004. Although there was a large growth in car ownership, there still is a large gap with
EU average (EU25 = 459).
Table 2.2 Car ownership Latvia
Latvia (2004) EU15 (2002) EU25 (2002)
Cars/1000 inh 297 491 459
Source: Eurostat; SCB, 2006
Road traffic conditions in rural areas and smaller cities and towns are not bad, –and could
be evaluated as Level of Service (LOS) B and C, which means basically unrestricted and
fluent traffic flow. In towns and in the capital of Latvia, Riga, the problem is more serious
due to the extensive enlargement of the private car fleet. The annual increase of the traffic
intensity is estimated at 2-5 % per year up to 2005, and 1-3 % from 2006 to 2015. 87% of
the State main roads are the elements of TEN-T network.
Table 2.3 Number of vehicles 1994-2004 (in 1000 vehicles)
1994 2004 Percentage change
Cars 251,6 686,1 173%
Trucks < 3.5 tons - 38,07 -
Trucks > 3.5 tons 59,4 107,6 81%
Source: Eurostat; SCB, 2006
The increase in car ownership is reflected in the modal split of passenger transport. In
2003, 73% of all passenger kilometres were performed by car. For the EU as a whole, the
share of passenger cars is 83%. Busses and coaches represent the second largest means of
passenger transportation with a share of 19%.
14
In freight transport, there was a large increase in the number of heavy trucks. This
expansion is largely due to the expanding transportation of timber. The increase
negatively influences both road quality and road safety.
Road charging
Currently, there are no pay roads in Latvia, and there are no plans for pay roads in the
future. Latvia has set up legislation to accommodate PPP. Although the government
actively promotes PPP, it foresees no infrastructure charging.
2.3.2 Railways
Infrastructure
Latvia has a relatively large railway network compared to its population (a relatively
dense network in relation to the population and population density). However, compared
to the the average railway density in the other EU member states (67/km2), the density of
Latvian railways (35/km2) is relatively small.
Table 2.4 Railway density, 2003
Railway line/1000 km
2
Railway line/100,000 inh
Latvia 35
100
EU 67
42
Source: Eurostat; SCB, 2006
The railway network is oriented at freight traffic along major transit cargo corridors that
mainly run in east – west direction from the Russian hinterland to the three major ports at
the Baltic Sea. The main corridors are:
• Moscow – Rezekne – Krustpils
• Vitebska – Daugavpils – Krustpils
• European transport corridor I: Tallinn-Valga – Ieriķi- Riga – Meitene – Sauli -
Warsaw
• St. Petersburg – Karsava –Rezekne – Daugavpils
Currently, Latvia is also involved in priority project number 27: ‘Rail Baltica’ axis
Warsaw-Kaunas-Riga-Tallinn-Helsinki.
The majority of the network consists of single track (incl. broad gauge). Latvian railways
operate with 1524mm wide gauge. Only at 11% of the network, some 257 km of the lines
is electrified. The majority of these lines are located in the vicinity of Riga and mainly
used for passenger transport.
15
Figure 2.3 Railway network and rail electrification Latvia
Source: Latvijas Dzelzceļš, 2005
The Latvian rail network needs considerable restoration or upgrading. Large parts of the
network are deteriorated. It is estimated that 30 %, or 605 km, of the main railways need
to be reconstructed. The shortage of resources for maintenance and development of the
existing rail system leads to wear of infrastructure and rolling stock as well as to the
incapability of performing rehabilitation works in due time. This decreases both
efficiency and safety level.
Latvia has relatively high number of railway transportation means. However, the main
part of the rolling stock is also outdated and should be modernized or replaced.
Means
Maintenance, development, and administration of railway infrastructure, organisation and
management of rail traffic are mostly covered by payments from private railway
operators through the Railway Infrastructure Fund in accordance with the Law on
Railways. The amount of investments for maintenance and development of the railway
infrastructure has decreased. On the one hand this decrease is due to the decrease of the
income level from freight carriage and on the other hand due to the fact that part of this
income is still used for cross-subsidising unprofitable passenger rail transport and not for
renewal of fixed assets.
According to the latest amendment to the Law on Railway there are two regulatory bodies
in the Latvian railway transport sector, the ‘State Railway Administration’ and the
independent ‘Public Utilities Commission’.
The State Railway Administration is responsible for issueing cargo transportation
licences. The Public Utilities Commission is responsible for issueing passenger
transportation licences and for infrastructure charging. It determines both the
16
methodology for infrastructure charging and these charges, thus ensuring a compliance
with the requirements of EU directives. The last amendments to the Law on Railway
make the State Railway Administration responsible for infrastructure capacity allocation
in cases where a railway infrastructure manager is also railway operator. Currently this is
the case for “Latvijas Dzelzceļš” (Latvian Railways) which is both infrastructure manager
and also a railway operator at the same time, although with separate accounting.
Latvijas Dzelzceļš is the main state railway operator in Latvia (apart from its role as
infrastructure manager). It is a joint stock company that is 100% owned by the state.
Since 2003, Latvijas Dzelzceļš only operates freight trains and owns all its diesel
locomotives. Other operations (e.g. passenger operations and their rolling stock repairs
and maintenance are being carried out by several subsidiary companies). International rail
cargo transportation services are provided by three companies, but their service tariffs are
not regulated.
Passenger trains are operated by subsidiary "Pasazieru Vilciens" ("Passenger Trains").
"Pasazieru Vilciens" is the, also 100% state-owned, domestic passenger services joint
stock company. It was not given any rolling stock assets from “Latvijas Dzelzcels” upon
creation but is negotiating for this transfer now. Although the passenger train market is
open to other parties, the entry of new carriers into this market is problematic, as the
market seems not very profitable at the moment.
Demand
Rail transport in Latvia is heavily dominated by freight transport demand. Latvia’s
geographical position favours the development of transit traffic. At current levels 55% to
60% of freight transit transport (in ton-km) is done via railways. Most of the annual cargo
volumes transported on railways flows in East-West direction, mainly from Russia (48.2
% of total transit shipments in 2002) and Belarus (37.4 % in 2002) to the Baltic ports.
Freight transport by rail is dominated by a very small number of shippers. Furthermore,
rail freight-traffic consists almost entirely of full wagonloads; consolidated cargoes use
road transport. It comprises a very large share of goods transported in the Baltic States.
Rail passenger transport is much less significant than freight and comprises almost
exclusively domestic traffic. At this moment the number of performed passenger
kilometres is at very low levels and still decreasing. Despite of the relatively high rail
network density, passenger rail can not compete with passenger cars and bus transport
that can provide more frequent services to the sparsely populated rural areas. Passenger
transport by rail is competitive only in Riga region.
17
2.3.3 Urban transport
Table 2.5 Urban public transport network in Latvia
Urban public
transport:
1994 1995 1996 1997 1998 1999 2000 2001 2002 2003 2004
Tram network km 163 163 162 162 162 161 162 162 162 162 162
Light rail (trolley)
network km
217 217 218 218 218 218 218 218 218 211 212
Source: Eurostat; SCB, 2006
Public transport has a very high share in passenger transport in Latvia. As mentioned
before, Latvia has a low share of private car us (62%). Therefore public transport is very
important. Two thirds of transport passenger-kilometres are made by buses and coaches.
There is well developed market of private bus transportation services, especially in
regions where buses are the main and most efficient mean of public transportation.
More than 100 companies perform regular commercial passenger services on urban,
regional, inter-city, and international routes. Most of them are private, but approximately
15 % are owned by municipalities or joint-stock companies. There are 39 entrepreneurs
operate long-distance bus services, of which 14 on international routes.
About a third of the passengers in public transport travel by national and urban rail
(Riga).In some regions the railway is an integral part of the local public transport system
(especially for Riga’s commuting traffic). Only in Latvia’s three biggest cities (Riga,
Daugavpils and Liepaja) an electric urban transport network (trolley and tram lines) has
been developed.
The motorisation trend is strongly against public transport, and it will be difficult to
maintain the high share of public transport. The urban region of Riga is the only region
where there are serious congestion problems. Here public transport has a real chance to
maintain or even expand its share.
2.3.4 Inland waterway transport
There is hardly any inland water traffic in Latvia. Latvia has a very small merchant fleet
(most Latvian ships operate under a foreign flag, there are no data on these available)
2.3.5 Sea ports
There are three large ports in Latvia (Ventspils, Riga, Liepaja) that are all part of TEN-T
and seven small ports (Salacgriva, Skulte, Lielupe, Engure, Mersrags, Roja, Pavilosta).
The major ports profit from their favourable geographical position, serving as ice-free
ports that are well connected through rail, for the Russian hinterland.
Ports of Riga and Ventspils are operating as Freeports for already 10 years. Port of
Liepaja is part of the Liepaja Specialized Economic Zone. Companies working in
Freeports and SEZ can receive up to 80% tax discount. The amount of rebate depends on
investments made during the tax year.
18
The larger ports are mainly involved in processing transit freight – around 80% of transit
freight transported through Latvia is handled through these ports. Latvian ports are highly
export-oriented, mostly shipping cargo for transit and export from Latvia. The volume of
cargo reloaded
4
at the ports of Latvia in 2005 was 60 mln tons, an increase of 4.6 %
compared to 2004, according to the Central Statistical Bureau. In 2005, 55.9 mln tons of
cargo were loaded at ports, 3.3% more than in 2004. The volume of cargo unloaded at
ports in 2005 was 4.1 mln tons, 25.8% more than the previous year.
Table 2.6 (international) Cargo handled in ports (in 1000 tons)
Total
Loaded in Latvia
Unloaded in Latvia
1990
36171
30386
5785
1995 38985
36370
2651
2000 51843
49276
2567
2004 57400
54101
3299
Source: SCB, 2006
Regarding cargo turnover, the Ventspils Free Port is currently the leading port on the
Baltic Sea and is included in the list of the 15 most important European ports. The
terminals handling crude oil, oil products and liquid chemical products operating in the
Ventspils port are amongst the largest in the Baltic Sea region.
The smaller ports have local significance. They are mainly engaged in the shipment of
timber and receipt of fishing products. In the summer season they are also used as
sailboat terminals. A very small share of passenger transport is being performed by a few
ferries.
According to the rail freight forwarders, the machinery in the Latvian ports for handling
cargo coming by rail is old and in bad condition. For example, the container terminal at
Riga port can handle only eight wagons at the same time, and thus, as the cargo volumes
on rail increase annually, there is a need for increasing the cargo-handling-capacity at the
terminal.
4
Reloaded cargo includes loaded plus unloaded cargo.
19
Figure 2.4 Composition of cargo flows
Source: SCB, 2006
Traditionally, crude oil and oil products have been the most import cargo for the Latvian
ports
5
. However, in the last few years there has been a large decrease in the flow of crude
oil and oil products and there has been a major increase in the handling of coal.
Particularly, the volume of crude oil loaded has decreased substantially. In 2005, 0.4 mln
tons of crude oil was transported from ports, which is 5.2 times less compared to 2004.
The volume of cargo in containers accounted for the bulk of cargo unloaded. The volume
of this cargo unloaded has increased by 12.9% in comparison with 2004.
Although the port of Ventspils has faced difficulties due to reduction of oil transit from
Russia, other ports have shown very good economic results over the past few years.
2.3.6 Airports
Infrastructure
In Latvia there are several airports, the largest one being the “Riga International Airport”.
Smaller airports are located in Liepaja, Ventspils and Daugavpils. Riga International
Airport is the leading airport of the three Baltic States. There are several major airlines
operating and recently also low cost airlines started operating from Riga Airport.
The State Joint Stock Company of Air Space Utilization and Air Traffic Organisation
“Latvijas Gaisa Satiksme” provides flight control services in the air space of Latvia.
During the last years the air traffic control system has seen drastic improvement.
Substantial investments in the airport were made and the number of destinations has
increased.
Over the last decade air passenger traffic has steadily increased. The airlines have
recently turned profitable after years of negative results.
5
This amount is still accounted for only by crude oil transported to the ports by rail.
20
Figure 2.5 Traffic development, Riga International Airport
0
2000
4000
6000
8000
10000
12000
14000
16000
18000
1
9
94
1
9
9
5
1
9
9
6
19
9
7
19
9
8
1999
2
0
00
2
0
0
1
2
0
0
2
2
0
0
3
20
0
4
2005
Passenger arrivals and departures - total, 1000
Cargoes loaded and unloaded (including mail) - total, tonne
Source: SCB, 2006 ; Riga International Airport
Passenger turnover at “Riga airport” is still growing rapidly. In 2005, there were almost
1.9 million passenger arrivals at and departures from the airport. One million of these
arrived and departed with foreign airlines; an increase of 2.3 times compared to 2004.
With 366 thousand passengers the largest passenger turnover volume was secured by the
German airports, followed by British airports with 310 thousand passengers.
Air cargo and/or the express package services have also grown rapidly over the past five
years, but remain of relatively low importance.
Ventspils and Liepaja airport are the second and third biggest airports that are certified
for international air traffic. At the moment both airports serve charter, business and
general aviation flights airport. Currently, both regional airports are meeting their
operational and exploitation targets. The potential for further develop these airports to
serve the steady growing tourist and trade flows between the East and the West Baltic Sea
coasts and eventually serve as a stepping stone for budget airline entrants in the Baltic
market still needs to be determined. One regional airport feasibility study for both airports
has already been commissioned by the Latvian ministry of transport in February 2006.
2.3.7 Trends and indicators
Modal split
The comparison of the modal split in passenger travel demand reveals the importance of
public transport. Road density is at about EU level and bus transport has a very dominant
position. Also tram and metro have a high share in passenger transport compared to the
EU average. Rail passenger numbers are decreasing, and the share of rail is below EU
average. Car ownership in Latvia has not reached EU averages yet, but motorisation
levels are rising fast. For the moment, the number of passenger kilometres by car is far
below the EU15 average.
21
Table 2.7 Modal split passenger transport (share % in passenger kilometres, 2003)
Situation 2003
Passenger cars Buses Railways Tram & metro
Latvia 73.2
18.7
5.6
2.5
EU25 74.4
8.1
5.8
1.2
EU15 84.1
8.4
6.3
1.2
Source: Eurostat; SCB, 2006
The share of the road in freight is the lowest of the EU (only 22.4% of the ton-km). This
is due to the high transit volumes operated by rail. The share of railways in total freight
transport (ton-km) is the highest in the EU (55%). Rail freight has substantial increased
during the past decade. The growth rate reached some 7% annually on the average.
Nevertheless, the modal share of rail freight, although still high, is gradually decreasing.
Table 2.8 Modal split freight transport (share % in ton kilometres, 2004)
Situation 2004
Road Rail Inland Waterways Pipeline
Latvia 25.3
63.5
-
11.3
EU25 72.6
16.4
5.6
5.4
EU15 75.7
13.2
6.5
4.5
Source: Eurostat; SCB, 2006
Figure 2.6 Development of the modal split in freight transport
Infrastructure charging
Roads: There are no pay-roads existing in Latvia, and it is not planned to introduce a
form of toll in the near future in Latvia.
Railways: As already mentioned in section 2.3.2, both the methodology for infrastructure
charging and the infrastructure charges are determined by the Public Utilities
Commission as independent regulator, since the infrastructure manager, LDz, is also
railway operator. The charge system is based on four principles:
22
1. To satisfy the financial needs of the public railway infrastructure for 100%
2. To establish (gradually) the same conditions for competition in freight and
passenger transport
3. To achieve the optimal conditions for intermodal competition, taking into account
social costs, environmental issues, and the economic interests of the country
4. To achieve the maximal utilization of the public railway infrastructure capacity
The charge for the usage itself is
based on the principle of full cost
recovery. The Stock Company
LDz does not receive any State
budget financing to carry out its
tasks as infrastructure manager.
The level of charge that rail
infrastructure users have to pay
depends on the type of operator
(freight or passenger) and the
type of line (3 categories).
Furthermore, there are discounts
depending on the type of
individual train category and for
freight operators there are
discounts depending on train
kilometres travelled by all freight
forwarders during the year.
The charge highly depends on
the actual traffic volume,
creating incentives for efficient use of the infrastructure. On the other hand, charges will
be very sensitive to traffic volume variation and the actual charges are relatively high, as
full cost recovery is aimed for (and rail infrastructure management in Latvia is relatively
costly).
Fuel prices
Table 2.9 Excise duty and VAT on transport fuels in Latvia
Fuel for propellant
use
Minimum agreed Excise duty rate
(Directive 2003/96/EC)
National Excise duty
rate (as at 1.1.2005)
VAT %
Leaded Petrol 421 €/1000 l 420.97 €/1000 l 18
Unleaded Petrol 359 €/1000 l 287.64 €/1000 l *) 18
Source: European Commission, Excise duties and transport, environment and energy taxes
Together with Cyprus, Lithuania and Estonia, Latvia has the lowest fuel prices and fuel
excise duties in Europe. There is almost no distinction in the price of petrol and diesel. In
May 2005 fuel prices were at about 80 cents per litre (Source: www.oeamtc.at). There is
no tax exemption for biofuels in Latvia.
It is expected that Latvia will have to introduce some sort of fiscal incentives in the
future, or increase energy and fuel taxes or introduce infrastructure charging. According
to Council directive 2004/74/EC Latvia is allowed to apply a transitional period until 1
23
January 2011 to adjust its national level of taxation on gas oil and kerosene as propellant
to a new minimum level of 302 Euro per 1,000 litres and until 1 January 2013 to reach
330 Euro. Similarly Latvia is allowed to apply a transitional period until 1 January 2011
to adjust its national level of taxation on unleaded petrol used as propellant to a new
minimium level of 359 Euro per 1,000 litres.
Traffic safety
Decreasing the number of road and railway accidents is one of the priorities under the
NTDP. Reportedly measures for improvement of road safety are the pre-requisite for
approval for financing for all road infrastructure investment projects.
Figure 2.7 Road Traffic Accidents
Source: CSDD
Latvia has the highest traffic death toll rate per million inhabitants (205) and per million
cars (814) in the EU. In average each year approximately 500 people are killed in road
accidents and approximately 6000 people are injured. Compared with other European
countries, for example Sweden and Finland, the number of deaths in road accidents per 1
million inhabitants is three to five times higher.
One of the main reasons for the high rate of accidents is very low quality of roads. Road
infrastructure in Latvia is outworn and with the available financial resources of the last
ten years it was not possible to plan for and perform duly the rehabilitation of outworn
asphalt pavement and gravel road and bridge repairs. At the same time a rapid increase in
the number of road vehicles has been observed in Latvia (the number of cars per 1000
inhabitants increased from 106 in 1990 to 264 in 2002).
2.4 Conclusions: SWOT analysis transport system
For some means of transportation, the infrastructure in Latvia is well developed. Due to
substantial investments, international air traffic has a high standard and an increasing
passenger flow. Latvia also has a dense railway network and a large share of freight
24
transport is conducted by rail (approximately 60%). The railway stock however is
outworn and in bad condition. This significantly hinders rail passenger transport.
Due to large economic growth, car ownership in Latvia has significantly increased over
the last ten years. The large growth in both passenger cars and road freight transport can
damage the state roads, which are already in a bad condition. Latvia therefore must focus
on improving road quality and optimizing the road and railway network.
In conclusion the following SWOT analysis has been made for the transport sector in
Latvia.
Strengths Weaknesses
• High standards and increasing passenger flow of the
international air traffic
• A strong railway system - approximately 60 % of the
cargo is carried by the railways.
• Access to ice-free Baltic Sea ports throughout the
winter season.
• The majority of the roads are in a poor technical
condition (lighting, traffic signs, etc).
• A high number of road fatalities which remains the
highest in EU.
• The rolling stock of the railways is worn out and old.
The railway transportation is slow, which hinders the
passenger transportation.
• The ferry services are poorly developed in Latvia
Opportunities Threats
• To improve the safety on Latvian roads via improved
road quality.
• To optimise the network of railways and auto transport
roads and further coordinate with the territorial
planning.
• Develop the public transport system, particularly in
Riga with an appropriate pricing policy.
• To develop logistic services to ensure Latvia becomes
more significant transit route for cargo from Asia to
Europe.
• The potential of regional airports (Baltic hub) should
be assessed and developed.
• The rapidly growing number of passenger km (210.6 in
1993 and 815.6 in 2004) and cargo tons (28.9 thou tons
in 1993 and 41.8 thou tons in 2003) can cause a further
damage to the roads.
• Increasing pressure upon the urban centres’ transport
system.
• The workforce emigration.
• Political changes, particularly in regarding the transit
sector
25
3 Accessibility analysis
3.1 Introduction
This chapter presents a more quantitative transport needs assessment on a regional level.
It clearly complements Chapter 2 in which the current situation of the transport system is
described where potential deficiencies are addressed. The analysis on the current situation
together with the analysis of transport needs from a cohesion perspective form a basis for
identifying possible investment priorities.
In this chapter, first a description of the needs assessment methodology is presented.
Especially the determination of the composite Accessibility Problem Index (API), which
has a central role in the approach, is explained. A higher value of the index indicates a
higher need for intervention. This approach has been labelled as the “red flag” analysis.
This composite Accessibility Problem Index is a combined measure, which addresses
transport network quality, population density and regional disparity (a more elaborate
explanation is provided in Annex C). As such the accessibility analysis is much more
linked to cohesion policy than a more traditional accessibility analysis. Next, results of
the application for Latvia are illustrated and analysed. This analysis identifies main areas
for intervention in rail and road transport for the current situation (2006).
3.2 Methodology: Accessibility Problem Index
To determine the need for transport investments, the SASI model has been used to assess
the present situation of the road and rail systems in each country without the national
transport projects to be examined later. For this the accessibility provided by the road and
rail systems in each country was evaluated from both a national and a European
perspective. This was used to identify regions with serious accessibility deficits that
should be addressed by European transport policy taking account of the stated EU goals
competitiveness and territorial cohesion. In the SASI model accessibility, which is
directly influenced by transport policy and investments, is judged to play a crucial role in
promoting the realisation of the cohesion objectives.
To determine the appropriate assessment of transport investment need from the cohesion
policy perspective an agreement on the indicator of accessibility to be used is required.
Traditional accessibility indicators are not useful for this. They measure the total effect of
both geographical location (periphery v. core) and quality of transport provided by the
transport system. As a result they always show a steep gradation in accessibility from the