Process Variations and Probabilistic Integrated Circuit Design pot
Bạn đang xem bản rút gọn của tài liệu. Xem và tải ngay bản đầy đủ của tài liệu tại đây (5.36 MB, 261 trang )
Process Variations and Probabilistic Integrated
Circuit Design
Manfred Dietrich • Joachim Haase
Editors
Process Variations and
Probabilistic Integrated
Circuit Design
123
Editors
Manfred Dietrich
Design Automation Division EAS
Fraunhofer-Institut Integrierte Schaltungen
Zeunerstr. 38, 01069 Dresden
Germany
Joachim Haase
Design Automation Division EAS
Fraunhofer-Institut Integrierte Schaltungen
Zeunerstr. 38, 01069 Dresden
Germany
ISBN 978-1-4419-6620-9 e-ISBN 978-1-4419-6621-6
DOI 10.1007/978-1-4419-6621-6
Springer New York Dordrecht Heidelberg London
Library of Congress Control Number: 2011940313
© Springer Science+Business Media, LLC 2012
All rights reserved. This work may not be translated or copied in whole or in part without the written
permission of the publisher (Springer Science+Business Media, LLC, 233 Spring Street, New York,
NY 10013, USA), except for brief excerpts in connection with reviews or scholarly analysis. Use in
connection with any form of information storage and retrieval, electronic adaptation, computer software,
or by similar or dissimilar methodology now known or hereafter developed is forbidden.
The use in this publication of trade names, trademarks, service marks, and similar terms, even if they are
not identified as such, is not to be taken as an expression of opinion as to whether or not they are subject
to proprietary rights.
Printed on acid-free paper
Springer is part of Springer Science+Business Media (www.springer.com)
Preface
Continued advances in semiconductor technology play a fundamental role in fueling
every aspect of innovation in those industries in which electronics is used. In
particular, one cannot fail to appreciate the benefits these advances offer in either
reducing the dimensions into which an electronic system can be built or increasing
the sheer complexity and overall functionality of the individual circuits. In general,
industry tends more to take advantage of the opportunity of offering additional
features and capability within a given space that reducing the overall size.
Whereas the manufacturing industry has matched the advances in the semicon-
ductor industry so that failure rates during fabrication at each stage have been
maintained at the same rate per element, the number of elements has increased
astronomically. As a result, unless measures are not taken, the overall failure rates
during production will increase dramatically. There are certain factors that will
compound this trend, for example the fact that semiconductor technologyyields may
be a function of factors other than simple manufacturing ability and may become
unacceptable as functional density increases.
It is thus essential to investigate which parameters of the various manufacturing
processes are the most sensitive in the production failure equation, and to explore
how their influence can be reduced.
If one focuses on the integrated circuit itself, one might consider either address-
ing the parameters associated with the silicon processing, the disciplines involved
in the design activity flow, or better still, both! In fact they are combined in a new
design approach referred to as statistical analysis. This is heralded by many as the
next-generation
EDA technology and is currently oriented specifically at addressing timing
analysis and power sign-off. Research into this field commenced about five years
ago and saw significant activity during the period since that start, although there are
indications of reduced interest of late. This decline in activity may be partly due
to the fact that the results of the work have been slow to find application. Perhaps
the key direction identified during this period has been the need to develop and
optimize statistical models for integrated circuit library components, and it is in this
v
vi Preface
area that effort will probably concentrate in the near future. This book will present
some results from research into this area and demonstrate how the manufacturing
parameter variations impact the design flow.
On the one hand, it is the objective of this book to provide designers with a
qualitative understanding of how process variations influence circuit behavior and to
indicate the most dominant parameters. On the other hand, from a practical point of
view, it must also acknowledge that designers need appropriate tools and strategies
to evaluate process variants and extract the modeling parameters.
It is true that certain modeling methods have been employed over the years
and constitute the framework under which submicron integrated circuits have been
developed to date. These have concentrated on evaluating a myriad of electrical
model parameters and their variation. This has led to an accurate determination of
the inter-dependence of these parameters under given conditions and does provide
the circuit developer with certain design information. For example, the designer can
determine whether the leakage current of a given cell or circuit is greater than a key
threshold specification, and similar determinations of power and delay can be made.
In fact, this modeling approach can include many parameters of low order effect yet
can be defined in such a way that many may be easily monitored and optimized in
the fabrication technology.
However, this specific case and corner analysis cannot assess such key factors
as yield and is too pessimistic and still too inaccurate to describe all variation
effects, particularly those than involve parameters with non-linear models and non-
Gaussian distributions. It is only from an appreciation of these current problems that
one can understand that the benefits of advanced technologies can only be realized
using an alternative approach such an advanced statistical design. It is an initial
insight into these new methods that the editors wish to present in these pages. It
is not the objective to look at the ultimate potential that will be achieved using
these methods, rather to present information on the research already complete. The
start-point is the presentation of key mathematical and physical fundamentals, an
essential basis for an appreciation of the subsequent chapters. It is also important
that the reader understand the main causes of parameter variations during production
and to appreciate that appropriate statistical methods must be accommodated in the
design flow.
This discussion leads into an overview of the current statistical methods and
methodologies which are presented from the designer’s perspective. Thus the text
leans towards the forms of analysis and their use rather than a derivation of the
underlying algorithms. This discussion is supported by some examples in which the
methods are used to improve circuit designs
Above all, through presenting the subject of process variation in the present form,
the editors wish to stimulate further discussion and recapture the earlier interest and
momentum in academic research. Without such activity, the strides made to date
towards developing methods to estimate such factors as yield and quality at the
design stage will be lost, and realizing the potential advantages of future technology
nodes may escape our grasp. To engender this interest in such a broad field, the core
of the book will limit its scope to:
Preface vii
• exploring the impact of production variations from various points of view,
including manufacturing, EDA methods and circuit design techniques
• explaining the impact through simple reproducible examples.
Within this framework, the editors aim to present material that emphasizes the
problems that arise because of intrinsic parameter variations, illustrates the differ-
ences between the various methods used to address the variations, and indicates the
direction in which one must set course to find general solutions.
The core material for the book came from many sources – from consultation
with many experts in the semiconductor and EDA industries, from research centers,
and from university staff. It is only from such a wide canvas that the book could
genuinely represent the broad spectrum of views that surround this subject. The
heart of the book is thus that of these contributors, experts in the field who have
embodied their frustrations and practical experience in each page.
Certain chapters of the book use results obtained during two German re-
search projects which received funding from the German Federal Ministry of
Education and Research (BMBF). These projects are entitled ”Sigma 65: Tech-
nologiebasierte Modellierung und Analyseverfahren unter Bercksichtigung von
Streuungen im 65nm-Knoten” (Technology based modeling and analyzing meth-
ods considering variations within 65nm technology) and ”ENERGIE: Technolo-
gien fr energieeffiziente Computing-Plattformen”(Technologies for energy-efficient
computing platforms; the subproject is part of the the Leading-Edge Cluster
CoolSilicon)
1
. Both projects address technology nodes beyond 65nm.
All contributors would like to thank the Springer Publishing Company for giving
them the opportunity to write this book and have it published. Special thanks go
to our Editor, Charles Glaser, for his understanding, encouragement, and support
during the conception and composition of this book. We also thank very much
Elizabeth Dougherty and Pasupathy Rathika for their assistance, efforts and patience
during the preparation of the print version.
Last but not least, we cannot close without thanking also the management and
our colleagues at the Fraunhofer-Gesellschaft (Design Automation Division of the
Institute for Integrated Circuits) without whose support this book would not have
been possible. Being able to work within the infrastructure of that organization
and the having available a willing staff to prepare illustrations, tables, and overall
structure have been invaluable.
Manfred Dietrich
Joachim Haase
1
These activities were supported by the German Federal Ministry of Education and Research
(BMBF). The corresponding content is the sole responsibility of the authors. Funding initials are
01 M 3080 (Sigma65) and 13 N 10183 (ENERGIE).
Contents
1 Introduction 1
Joachim Haase and Manfred Dietrich
2 Physical and Mathematical Fundamentals 11
Bernd Lemaitre, Christoph Sohrmann, Lutz Muche,
and Joachim Haase
3 Examination of Process Parameter Variations 69
Emrah Acar, Hendrik Mau, Andy Heinig, Bing Li,
and Ulf Schlichtmann
4 Methods of Parameter Variations 91
Christoph Knoth, Ulf Schlichtmann, Bing Li, Min Zhang,
Markus Olbrich, Emrah Acar, Uwe Eichler, Joachim Haase,
Andr
´
e Lange, and Michael Pronath
5 Consequences for Circuit Design and Case Studies 181
Alyssa C. Bonnoit and Reimund Wittmann
6Conclusion 215
Manfred Dietrich
Appendix A Standard Formats for Circuit Characterization 223
Appendix B Standard Formats for Simulation Purposes 235
Glossary 245
Index 247
ix
Acronyms
ACM Advanced Compact Model
ADC Analog-to-Digital Converter
ANOVA Analysis of variance
ASIC Application-specific integrated circuit
BSIM Berkley short-channel IGFET model
CCS Composite current source model
CD Critical Dimension
CDF Cumulative distribution function
CGF Cumulant generating function
CLM Channel length modulation
CMC Compact Model Council
CMCal Central moment calculation method
CMP Chemical-mechanical polishing
CMOS Complementary metal-oxide-semiconductor
CPF Common power format
CPK Process capability index
CSM Current source model
DAC Digital-to-Analog Converter
DCP Digital Controlled Potentiometer
DF Distribution function
DFM Design for manufacturability
DFY Design for yield
DIBL Drain-induced barrier lowering
DNL Differential Nonlinearity
DoE Design of Experiments
ECSM Effective current source model
EKV Enz–Krummenacher–Vittoz model
FET Field-effect transistor
FinFET “Fin” field-effect transistor
GBD Generalized beta distribution
xi
xii Acronyms
GEM Generic Engineering Model
GDS II Graphic Data System format II
GLD Generalized lambda distribution
GIDL Gate-induced drain leakage current
GPD General Pareto distribution
HiSIM Hiroshima university STARC IGFET Model
HOS Higher-order sensitivity
HCI Hot carrier injection
IC Integrated Circuit
ICA Independent component analysis
IGFET Insulated-gate field-effect transistor
ITRS International Technology Roadmap for Semiconductors
INL Integral Nonlinearity
IP core Intellectual Property Core
JFET Junction gate field-effect transistor
LHS Latin hypercube sampling
LOCOS Local oxidation of silicon
LSM Least square method
LSB Least Significant Bit
MOSFET Metal-oxide-semiconductor field-effect transistor
MPU Microprocessor unit
MC Monte Carlo
ML Maximum likelihood
MSB Most Significant Bit
NBTI Negative bias temperature instability
NLDM Nonlinear Delay Model
NLPM Nonlinear Power Model
NQS Non-Quasi Static
OASIS Open Artwork System Interchange Standard
OPC Optical Proximity Correction
OCV On-chip variation
PCA Principal Component Analysis
PDF Probability density function
PDK Process Design Kit
POT Peak over threshold
PSP Penn-State Philips CMOS transistor model
PVT Process-Voltage-Temperature
RDF Random doping fluctuations
RSM Response Surface Method
SAE Society of Automotive Engineers
SAR Successive Approximation Register (ADC type)
SAIF Switching Activity Interchange Format
SDF Standard Delay Format
SOI Silicon on insulator
SPA Saddle point approximation
Acronyms xiii
SPE Surface Potential Equation
SPEF Standard Parasitic Exchange Format
SPDM Scalable Polynomial Delay Model
SPICE Simulation program with integrated circuit emphasis
STA Static timing analysis
STARC Semiconductor Technology Academic Research Center
SSTA Statistical static timing analysis
STI Shallow Trench Isolation
SVD Singular value decomposition
UPF Unified power format
VCD Value change dump output format
VLSI Very-large-scale integration
VHDL Very High Speed Integrated Circuit Hardware Description
Language
VHDL-AMS Very High Speed Integrated Circuit Hardware Description
Language – Analog Mixed-Signal
List of Mathematical Symbols
R
n
Euclidean space of dimension n
a
Vector
A
A
A Matrix
k
B
Boltzmann constant
q Elementary charge
V
th
Threshold voltage
V
fb
Flat-band voltage
V
T
Thermal voltage k
B
T/q
I
ds
Drain-source current
I
gs
Gate-source current
V
dd
Supply voltage
V
gs
Gate-source voltage
V
ds
Drain-source voltage
V
sb
Source-bulk voltage
I
leak
Leakage current
I
GIDL
Gate-induced drain leakage current
I
sub
Subthreshold leakage current
I
gate
Gate oxide leakage current
I
ds,V
th
Drain-source current at V
gs
= V
th
and V
ds
= V
dd
g
ds
Drain-source conductance
I
dsat
Drain saturation current
T
ox
Oxide thickness
C
ox
Oxide capacitance
μ
eff
Effective mobility
L
eff
Effective channel length
ε
F
Fermi level
k
B
Boltzmann constant
J
J
J Jacobian matrix
X Random variable X (one dimensional)
x Sample point of a one-dimensional random variable x
xv
xvi List of Mathematical Symbols
X Random vector X
x Sample point of a random vector x
Σ
Covariance matrix
Σ
N(
μ
,
σ
2
) Univariate normal distribution with mean value
μ
and
variance
σ
N(
μ
,
Σ
) Multivariate normal distribution with mean
μ
and covariance
matrix
Σ
I
I
I
m
Identity matrix of size m
0
Null vector or zero vector
E [X] Expected value of the random variable X
cov(X,Y) Covariance of random variables X and Y
var(X) Variance of random variable X
erfx Valu e Erf x of Gaussian error function
φ
(x) Valu e
φ
(x) of PDF of the N(0,1) normal distribution function
Φ
(x) Va lue
Φ
(x) of CDF of the N(0, 1) normal distribution function
Prob(X ≤x
limit
) Probability for X ≤ x
limit
ρ
X,Y
Correlation coefficient of random variables X and Y
Chapter 1
Introduction
Joachim Haase and Manfred Dietrich
During the last years, the field of microelectronics has been moving to nanoelec-
tronics. This development provides opportunities for new products and applications.
However, development is no longer possible by simply downscaling technical
parameters as used in the past. Approaching the physical and technological limits of
electronic devices, new effects appear and have to be considered in the design pro-
cess. Due to the extreme miniaturization in microelectronics, even small variations
in the manufacturing process may lead to parameter variations which can make a
circuit unusable. A new aspect for digital designers is the occurrence of essential
variations not only from die to die but also within a die. Therefore, inter-die and
intra-die variations have to be taken into account not only in the design of analog
circuits as already done, but also in the digital design process. The great challenge is
to assure the functionality of high complex digital circuits with respect to physical,
technological, and economic boundary conditions. In order to evaluate design
solutions within an acceptable time and with acceptable efforts the methods applied
in the design process must support the analysis of design solutions as accurate as
necessary and as simple as possible. As a result, the expected yield will be achieved
and circuits can be manufactured economically. In this context, CMOS technology
will remain the most important driving force for microelectronics over the next years
and will be responsible for most of the innovations and new applications. For this
reason, the subsequent paragraph will focus on this technology. The first chapter
provides an introduction to the outlined problems.
J. Haase () • M. Dietrich
Design Automation Division EAS, Fraunhofer-Institut Integrierte Schaltungen, Zeunerstr. 38,
01069 Dresden, Germany
e-mail: ;
M. Dietrich and J. Haase (eds.), Process Variations and Probabilistic
Integrated Circuit Design, DOI 10.1007/978-1-4419-6621-6
1,
© Springer Science+Business Media, LLC 2012
1
2 J. Haase and M. Dietrich
1.1 Development of CMOS Semiconductor Technology
Technology progress in IC design and semiconductor manufacturing has resulted in
circuits with more functionality at lower prices for the last decades. The number of
components on a chip especially in digital CMOS circuits doubled roughly every 24
months as predicted by Moore’s Law. This trend was mostly driven by decreasing
the minimum feature sizes used in the fabrication process. The requirements in the
context of this development have been summarized in the International Technology
Roadmap for Semiconductors (ITRS) for years [1]. For a long time, the progress has
been expressed by moving from one technology node to the next. The technology
nodes were characterized by the half pitch item of DRAM staggered-contacted
metal bit lines as shown in Fig. 1.1. The 2009 ITRS document adds new criteria
for further developments. Nevertheless, the half-pitch definition anymore indicates
the direction of the expected future progress. In the case of MPUs and ASICs it
measures the half-pitch of M1 lines. For flash memories, it is the half-pitch of un-
conducted polysilicon lines.
In this way, the 130 nm-, 90 nm-, 65nm-, 45 nm-nodes, and so on were defined.
The half-pitch is scaled by a factor S ≈ 0.7 ≈ 1/
√
2 = 1/
α
moving from one node
to the next. Over two cycles, the scaling factor is 0.5. In accordance with this devel-
opment, the device parameters, line parameters, and electrical operating conditions
were scaled. The result was a decrease of the delay time of digital components with
simultaneous decrease of the their sizes. Thus, faster chips with more components
could be developed that enabled a higher functionality. For more than 35 years, the
fundamental paper by Robert H. Dennard and others [2] could be used as a compass
for research and development in this area (see Tables 1.1 and 1.2,
α
=
√
2).
Fig. 1.1 2009 Definition of
pitches [1]
1 Introduction 3
Table 1.1 Scaling of device
parameters [2, 3]
Parameter Scaling factor
Channel length L 1/
α
Channel width W 1/
α
Oxide thickness t
ox
1/
α
Body doping concentration N
a
α
Threshold voltage V
th
(<)1/
α
Gate capacitance C
g
∼
κ
ox
t
ox
W ·L 1/
α
Table 1.2 Scaling for
interconnection lines [2, 3]
Parameter Scaling factor
Wire pitch 1/
α
Wire spacing s
w
1/
α
Wire width W
w
1/
α
Wire length L
w
1/
√
α
Wire thickness t
w
1/
√
α
Line resistance R
L
∼
L
w
W
w
t
w
α
Line response time ∼R
L
C 1
Wire-to-wire capacitance ∼
κ
isolation
s
w
t
w
L
w
1
Table 1.3 Scaling for circuit
performance [2, 3]
Parameter Scaling factor
Supply voltage 1/
α
Depending voltages V 1/
α
Current I 1/
α
Delay time (of a component) 1/
α
Power dissipation ∼VI (of a component) 1/
α
2
Power density ∼VI/A ∼
1/
α
2
1/
α
2
1
Normalized voltage drop of lines ∼IR
L
/V
α
Line current density ∼
I
t
w
W
w
Increasing with
α
The scaling rules assured not only the functional progress. Performance was
increased while reducing power per circuit components. The power density retained
stable (see Table 1.3).
However, for instance downscaling the threshold voltage V
th
and oxide thickness
t
ox
results in higher subthreshold leakage and gate leakage currents resp. [4]. Thus,
power consumption became more and more a problem. “Dennard’s Law” could no
longer be followed [5]. To overcome the limits, new materials, new devices, and
new design concepts have been investigated [6]. In parallel, process variations have
to be considered in order to predict performance and yield of VLSI designs.
Further trends include, on the one hand, geometrical and equivalent scaling and,
on the other hand, a functional diversification. The first trend is announced as “More
Moore” while the second is discussed as “More than Moore” [1]. At the end, system-
level performance has to be improved [7]. In order to compare different solutions,
reliable methods to predict the system behavior are becoming necessary.
4 J. Haase and M. Dietrich
1.2 Consequences of Silicon Technology Challenges
Reducing the channel length of the CMOS devices, short-channel effects such as
velocity saturation and drain-induced barrier lowering have to be considered. The
threshold voltage V
th
strongly depends on the effective channel length L
eff
and the
operational voltages. These and other effects have to be considered in the transistor
models in order to predict performance and power consumption sufficiently exact.
Scaling of the threshold voltage V
th
leads to a point where the subthreshold
leakage current I
sub
∼ e
−
V
th
nV
T
with slope factor n ≈ 1.5 and thermal voltage V
T
∼
temperature T becomes a dominant factor for the power consumption of a circuit.
Thus, a further scaling of the threshold voltage is difficult. Furthermore, the signal
swing given by the difference of gate source voltage V
GS
andV
th
cannot be decreased
under a critical limit without compromising the robust circuit behavior. This fact
furthermore limits the scaling of the supply voltage.
Further contributions to the transistor leakage are the band-to-band-tunneling
leakage and the gate leakage current I
gate
∼ e
−
t
ox
β
1
,where
β
1
is a fitting coefficient.
The value strongly depends on the gate thickness t
ox
. The gate leakage results from
tunneling of electrons through the gate dielectric [8]. The gate capacitance must
be maintained over a limit while shrinking the geometry in order to assure the
controllability of the channel current. Thus, shrinking of the gate thickness could be
avoided by a gate material with high permittivity known as high-k material. “High”
notes that the permittivity is greater than that of silicon oxide SiO
2
.
Shrinking the geometry also influences the interconnection of components. The
delay of local wires between gates remains constant (see Table 1.2). However, global
wires such as busses and clock networks tend to follow the chip dimensions. Wires
can be considered as distributed RC lines. The delay depends on the product of line
resistance times line capacitance. Thus in order to reduce the delay, interconnect
materials with lower resistance and dielectrics with lower permittivity (low-k
materials) have been investigated. For instance, a lower resistance can be achieved
by using copper instead of aluminium for interconnect lines. A lower permittivity
reduces also the parasitic wire-to-wire capacitance. However, it is suspected that
modifications of the dielectric material could lead to an inacceptable leakage.
Looking at the RC product, it follows that the delay of the interconnect lines
increases quadratically with its length. Thus, splitting the long interconnect lines and
inserting repeaters is a reasonable strategy to reduce the overall delay [9]. However,
this is paid by higher energy costs per transition because of the inserted drivers.
There is a tradeoff between speed and energy consumption. Reducing the signal
swing is an effective method to save energy. However, the robustness of the signal
transmission against supply noise, crosstalk, and variations of the line parameters
must be assured.
With scaling also the impact of the variations increases. It can be distinguished
between those that are coming from the manufacturing process as, for instance,
the lithography and those that are due to fundamental physical limitations as, for
1 Introduction 5
instance, given by energy quantization. The variations are classified into different
manners. Front-end variability is variability that impacts the devices. Back-end
variability results from steps creating the interconnects. Furthermore, it should be
distinguished between variations from die-to-die and variations within a die. They
are called inter-die and intra-die variations, respectively. The inter-die variations
impact all devices and interconnects of a die in (nearly) the same way. We will try
to describe them using correlated random variables, whereas intra-die variations
can be described by uncorrelated or weak spatial correlated random variables.
Downscaling the CMOS technology intra-die variations become more important.
The parameter P can be represented by a sum of its nominal value P
nom
as well as
random variables characterizing the inter-die variation P
inter
and intra-die variation
P
intra
contributions [10]
P = P
nom
+ P
inter
+ P
intra
. (1.1)
Besides these variations, changes of the environment a circuit operates in must
also be considered. The temperature, supply voltages, and input signals have
an impact on the circuit performance. These variations are called environmental
variations. The functionality of a circuit must be guaranteed within specified limits.
Last but not least the functionality over time must be assured. Aging effects such
as electromigration and negative bias temperature instability are further sources of
variations.
Furthermore, shrinking device geometry while scaling device parameters and
operating conditions in accordance makes the transistor performance more sensitive
to variations. This trend due to short-channel effects can be noticed for leakage
currents and speed. For instance, the sensitivity of the I
on
current that depends on the
effective channel length L
eff
, the supply voltage, and the effective carrier mobility
μ
eff
that depends on the channel doping N
ch
increases over technology generations
[11] and makes the delay times more sensitive against parameter variations.
In order to reduce the consequences of these developments, new technology
innovations and device architectures as strained silicon, silicon-on-insulator, very
high mobility devices, and for instance trigate transistors have been developed (see
more information, for instance, in [6,9, 12]).
1.3 Impact on the Design Process
1.3.1 An Example Concerning Inter-Die and Intra-Die Variations
Let us discuss the impact of parameter variations on the design process with the help
of a simple example. The map between a performance value y and the parameter
values x
i
shall be given by a function f
f : R
n
→ R,(x
1
,x
2
,···, x
n
) →y. (1.2)
6 J. Haase and M. Dietrich
Let X
i
be a random variable that describes variations of the ith parameter and Y
describes the associated variation of the performance value
Y = f (X
1
,X
2
,···, X
n
). (1.3)
Knowledge of the map f and the probability distributions of the X
i
would allow to
determine the probability distribution of Y with the help of Monte Carlo simulation
studies. Using a simplified approach, expected tolerances of the performance
parameter can be estimated. f is replaced by its first-order Taylor series at the
operating point. The parameters shall be Gaussian distributed, where
μ
i
is the mean
or nominal value of the ith parameter and
σ
i
is its standard deviation. Thus for
“small” parameter variations, Y can be approximated by a first-order Taylor series
Y ≈ y
nom
+
n
∑
i=1
a
i
·(X
i
−
μ
i
), (1.4)
where y
nom
is the nominal value of the investigated performance parameter and a
i
=
d f
dx
i
are the first-order derivatives or parameter sensitivities at the nominal values
of the parameters. Then Y is also Gaussian distributed with mean value y
nom
and
standard deviation
σ
Y
where 3
σ
Y
measures the tolerance. The variance is given by
σ
Y
2
=
n
∑
i=1
a
i
2
σ
i
2
+ 2·
n
∑
i=1
n
∑
j=i+1
ρ
i, j
a
i
a
j
σ
i
σ
j
, (1.5)
where
ρ
i, j
is the correlation coefficient of the ith and jth parameter.
Let us now built up the sum of n parameters with the same Gaussian distribution
N(
μ
,
σ
) and defining in this way a special performance variable Y
∗
:
Y
∗
=
n
∑
i=1
X
i
∗
. (1.6)
Y
∗
can for instance be interpreted as the delay time of a chain of n gates with same
delay distribution. If all delay times of the individual gates are strongly correlated
(all correlation coefficients
ρ
i, j
equal 1), it follows from (1.5)
σ
Y
∗
,correlated
=
n ·
σ
2
+ 2·
n ·(n −1)
2
·
σ
2
= n·
σ
. (1.7)
If all delay times of the individual gates are strongly uncorrelated (all correlation
coefficients
ρ
i, j
equal 0), it follows from (1.5)
σ
Y
∗
,uncorrelated
=
√
n ·
σ
. (1.8)
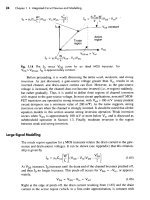
1 Introduction 7
Fig. 1.2
σ
n
of a sum of n variables divided by the standard deviation
σ
of one variable
σ
n
(r)
σ
Let us now assume that the variations of the parameters result from strongly cor-
related inter-die variations with variance r ·
σ
2
and uncorrelated intra-die variations
with variance (1−r)·
σ
2
. The intra-die and inter-die variations are also uncorrelated.
Thus, the overall variance of an individual parameter retains
σ
2
.Thenweget
σ
Y
∗
,mixed
=
σ
n
(r)=
n
2
·r+n ·(1−r)·
σ
(1.9)
Static timing analysis (STA) is widely used in the design flow for timing
verification. It assumes a full correlation of process parameters within a die. Thus,
it neglects the characteristics of intra-die variations and only considers inter-die
variations. The behavior is checked for “corner cases.” “Worst case,” “typical case,”
and “best case” are investigated for associated parameter sets of the transistor
models [13].
However, Fig. 1.2 shows that, for instance, the delay time may be overestimated
in this way. The procedure brings to much pessimism into the design flow. The
more intra-die variations have to be taken into account, the more improvements on
analysis methods are necessary.
8 J. Haase and M. Dietrich
1.3.2 Consequences for Methods to Analyze Designs
Design methods for nanoscale CMOS have to consider the variability and uncer-
tainty of parameters predicting the behavior of a circuit. There is an impact of
challenges in nanoscale technology on EDA tool development [14]. A number of
methods are available to take variability into consideration.
The compact device models represent a link between the characteristics of the
manufacturing process and the methods that shall predict the behavior of a semi-
conductor circuit. Interactions that are understood can be expressed in a systematic
way by deterministic mathematical models. Phenomena that are poorly understood
are often described by stochastic models. Thus, the choice of an appropriate model is
essential for the subsequent conclusions. The Berkeley Short-channel IGFET Mod-
els are state-of-the-art compact MOS models. BSIM3 was a first industry-wide used
model. It was extended to the BSIM4 model in order to describe MOSFET physical
effects in the sub-100nm regime. These models are based on threshold voltage
formulations. The new PSP model is a surface-potential based model. It promises
an accurate description of the moderate inversion region that becomes a larger part
of the voltage swing as the supply voltage is scaled down [15]. The behavior in the
time domain as well as the leakage behavior must be covered by the models in use.
Several methods have been developed and implemented to extract parameters of
compact models either from measurement or based on device simulations [16]. For
statistical design methods, the knowledge of the probability characteristics of the
parameters is necessary. Various methods have been developed to determine these
characteristics of the transistor parameters [17]. Important sources of variations
of the transistor behavior in the 65-nm process are, for instance, variations of
gate length, threshold voltage, and mobility [18]. The determination may base
on TCAD approaches or measurements of process variations using test chips or
circuits. Transistor arrays and ring oscillators are typical test structures for this
purpose [19]. However, there are only a few publications on real data concerning
process variations [20]. For future technology nodes, predictive transistor models
have been developed [11,21,22]. They enable to study future developments in a very
early stage. To map random process variability onto designer-controllable variables,
simple approaches have been investigated [23].
Several mathematical methods can be applied in order to describe the parameter
variations. In most cases, it can be and is assumed that the parameters are Gaussian
distributed. The dependency of the parameters can be expressed in these cases by
correlation matrices. However, if these parameters are not linearly mapped on the
performance variables, these variables are in general not Gaussian distributed. This
is for instance possible if the map (1.4) cannot be applied. Thus, it is also necessary
to consider methods for describing non-Gaussian random variables. Basic relations
between parameters and performance variables can be investigated using techniques
that analyze variances. In the case of Gaussian distributed parameters, principal
component analysis can be used to reduce the number of basic random variables.
Correlated non-Gaussian parameters can be transformed to statistically independent