Báo cáo khoa học: Prediction of missing enzyme genes in a bacterial metabolic network Reconstruction of the lysine-degradation pathway ofPseudomonas aeruginosa doc
Bạn đang xem bản rút gọn của tài liệu. Xem và tải ngay bản đầy đủ của tài liệu tại đây (350.54 KB, 12 trang )
Prediction of missing enzyme genes in a bacterial
metabolic network
Reconstruction of the lysine-degradation pathway of Pseudomonas
aeruginosa
Yoshihiro Yamanishi
1
, Hisaaki Mihara
2
, Motoharu Osaki
2
, Hisashi Muramatsu
3
, Nobuyoshi Esaki
2
,
Tetsuya Sato
1
, Yoshiyuki Hizukuri
1
, Susumu Goto
1
and Minoru Kanehisa
1
1 Bioinformatics Center, Institute for Chemical Research, Kyoto University, Japan
2 Division of Environmental Chemistry, Institute for Chemical Research, Kyoto University, Japan
3 Department of Biology, Graduate School of Science, Osaka University, Japan
Most biological functions involve the coordinated
actions of many proteins, and the complexity of living
systems arises as a result of such interactions. It is there-
fore important to understand biological systems by
analyzing the relationships among many proteins. A
challenge in recent genome science is to computationally
predict the systemic functional behaviors of proteins
from genomic and molecular information for industrial
and other practical applications [1,2]. Recent sequence
projects and developments in biotechnology have con-
tributed to an increasing amount of high-throughput
genomic data for biomolecules and their interactions.
These data are useful sources from which to computa-
tionally infer many types of biological networks [3–6].
Keywords
kernel methods; lysine degradation
pathway; metabolic network; missing
enzymes; network inference
Correspondence
Y. Yamanishi, Bioinformatics Center,
Institute for Chemical Research, Kyoto
University, Gokasho, Uji, Kyoto 611-0011,
Japan
Fax: +81 774 38 3269
Tel: +81 774 38 3270
E-mail:
(Received 6 December 2006, revised 17
February 2007, accepted 1 March 2007)
doi:10.1111/j.1742-4658.2007.05763.x
The metabolic network is an important biological network which consists
of enzymes and chemical compounds. However, a large number of meta-
bolic pathways remains unknown, and most organism-specific metabolic
pathways contain many missing enzymes. We present a novel method to
identify the genes coding for missing enzymes using available genomic and
chemical information from bacterial genomes. The proposed method con-
sists of two steps: (a) estimation of the functional association between the
genes with respect to chromosomal proximity and evolutionary association,
using supervised network inference; and (b) selection of gene candidates for
missing enzymes based on the original candidate score and the chemical
reaction information encoded in the EC number. We applied the proposed
methods to infer the metabolic network for the bacteria Pseudomonas aeru-
ginosa from two genomic datasets: gene position and phylogenetic profiles.
Next, we predicted several missing enzyme genes to reconstruct the lysine-
degradation pathway in P. aeruginosa using EC number information. As a
result, we identified PA0266 as a putative 5-aminovalerate aminotransferase
(EC 2.6.1.48) and PA0265 as a putative glutarate semialdehyde dehydro-
genase (EC 1.2.1.20). To verify our prediction, we conducted biochemical
assays and examined the activity of the products of the predicted genes,
PA0265 and PA0266, in a coupled reaction. We observed that the predi-
cted gene products catalyzed the expected reactions; no activity was seen
when both gene products were omitted from the reaction.
Abbreviations
OGC, ortholog gene cluster; ROC, receiver operating curve.
2262 FEBS Journal 274 (2007) 2262–2273 ª 2007 The Authors Journal compilation ª 2007 FEBS
The metabolic network is an important class of biolo-
gical network, consisting of enzymes and chemical com-
pounds. Recent developments in pathway databases,
such as KEGG PATHWAY [7] and EcoCyc [8], enable
us to analyze known metabolic networks. Unfortu-
nately, most organism-specific metabolic networks con-
tain many ‘missing enzymes’ in their known pathways.
Because the experimental determination of metabolic
networks remains challenging, even for the most basic
organisms, there is a need to develop methods to infer
the unknown parts of metabolic networks and identify
genes coding for missing enzymes in known metabolic
pathways [9–11]. Thanks to the development of homol-
ogy detection tools [12–14], enzyme genes can be easily
found from fully sequenced genomes using comparative
genomics [15], but it can be difficult to assign them a
precise biological role within a pathway.
Missing enzymes are an obstacle to understanding
the functional behavior of enzymes in metabolic path-
ways. There are two research directions for finding the
genes of missing enzymes. The first is to use genomic
information to predict candidate genes coding for the
missing enzymes. Examples include using information
about the gene order along the chromosome in bacter-
ial genomes [16], gene fusion [17,18], genomic context
[19,20], gene-expression patterns [21,22], statistical
methods [23] and multiple genomic datasets [5,6,24].
The second approach is to use information about the
chemical compounds with which the enzymes are
involved. An example is the path-computation
approach [25], in which all possible paths between two
compounds are searched by losing the substrate-specif-
icity restriction. However, this system tends to produce
too many candidates and it is difficult to select reliable
paths. It is more natural to use both genomic data and
chemical information simultaneously, rather than to
use each individually.
This study presents a novel method to identify genes
coding for missing enzymes from genomic data and
chemical information for bacterial genomes. First, we
designed kernel-similarity measures [26] between genes
based on gene positions and phylogenetic profiles. This
is motivated by the interesting observation that func-
tionally related genes tend to be closely located along
bacterial chromosomes [16,27] or evolve in a correlated
manner [28–30]. Next, we predict a global gene net-
work applying supervised network inference using the
kernels based on the genomic datasets, which are
based on a previously developed network inference
algorithm [24,31]. Finally, we collect genes that have
potential functional relations with enzyme genes adja-
cent to the target missing enzyme using the original
candidate score, and select genes based on the enzyme
commission (EC) numbers of the target enzymes in the
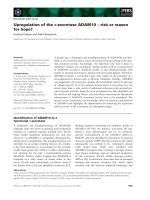
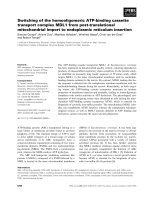
pathway. Figure 1 illustrates this procedure.
We applied the proposed method to the metabolic
network of Pseudomonas aeruginosa and attempted to
find several missing enzyme genes. We focused on the
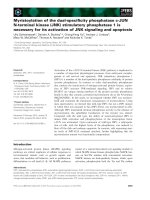
lysine-degradation pathway of P. aeruginosa (Fig. 2)
because it contains many missing enzymes for which
the coding genes have not yet been identified. Our sur-
vey of missing enzymes in the KEGG PATHWAY
database suggests that the lysine-degradation pathway
map for P. aeruginosa is missing 28 of its 62 enzymes
(45%). Lysine catabolism is notable for its biochemical
diversity across organisms. Enzymatic reactions in the
lysine pathway in bacteria are completely different
from those seen in eukaryotes and archaea, and there
is also variation within bacteria. We also focused on
the lysine-degradation pathway because the substrates
and intermediates of the pathway are structurally sim-
ple, and so the reactions can be easily examined bio-
chemically. Thus, the computational prediction of
missing enzymes can be verified using relatively simple
biochemical experiments.
We selected gene candidates for some of the missing
enzymes in the lysine-degradation pathway based on
the candidate scores, which in turn were based on
association scores with known enzymes that catalyzed
similar reactions based on EC number. For example,
we identified PA0266 as a putative 5-aminovalerate
aminotransferase (EC 2.6.1.48) and PA0265 as a
putative glutarate semialdehyde dehydrogenase
(EC 1.2.1.20). To verify the prediction, we conducted
wet-lab experiments, in which PA0265 and PA0266
genes were cloned and expressed in Escherichia coli,
and the proteins purified. The activity of PA0265
and PA0266 was examined, and we found that the
enzymes catalyzed the expected reactions. Therefore,
we concluded that PA0265 is glutarate semialdehyde
dehydrogenase and PA0266 is 5-aminovalerate amino-
transferase. This is how we successfully reconstructed
the metabolic pathway for lysine degradation.
Results
Inference of potential gene network
First, we attempted to infer a global network consist-
ing of the potential functional relationship between the
genes of P. aeruginosa from two genomic datasets: the
gene position along the genome, and phylogenetic pro-
files. Details of our network inference method are
given in the Experimental procedures and the original
references [24,31]. In previous studies, the usefulness of
the network inference method was confirmed by a
Y. Yamanishi et al. Prediction of missing enzyme genes
FEBS Journal 274 (2007) 2262–2273 ª 2007 The Authors Journal compilation ª 2007 FEBS 2263
cross-validation experiment which attempted to recover
the metabolic network in the KEGG PATHWAY
database as follows. In each cross-validation step, the
known enzyme genes were randomly divided into two
sets: the training set and the test set, in the proportion
of nine to one. First, we used the training dataset for a
learning process. Second, we predicted the network
involving the enzyme genes in the test set. Finally, we
evaluated the accuracy of the prediction using ROC
scores, defined as the area under the receiver operating
curve (ROC), that is, the area under the plot of true
positives as a function of false positives, normalized
to 1 for a perfect prediction and 0.5 for a random
prediction.
To evaluate the biological relevance of the gene
position and the phylogenetic profile with metabolic
networks, we computed ROC scores by applying the
cross-validation test as in previous studies. Table 1
shows the ROC scores for gene position, phylogenetic
profile, and the integration of both datasets. Both gene
position and phylogenetic profile seemed to capture
information for reconstructing the metabolic network.
We evaluated the biological relevance of each data
source by ROC score ) 0.5, and used them to weight
the data integration process. The resulting weights for
gene position and phylogenetic profile are 0.48 and
0.52, respectively, where the sum of the weights is nor-
malized to 1. We also observed a significant effect of
integrating the two genomic datasets into a single set
via the sum of the kernel-similarity matrices. Finally,
we predicted a global network for all the genes of
P. aeruginosa. In the inference process, we used all the
current knowledge about the metabolic network as
training data. The predicted network enabled us to
predict unknown functional relations between genes.
The results of the predicted gene network can be
obtained from />yoshi/pae/. A web server to carry out the network
inference procedure is in preparation.
Missing enzyme gene prediction
There are many missing enzymes whose coding genes
have not been identified in known pathways. In this
study, we focused on the reconstruction of the lysine-
degradation pathway of P. aeruginosa, because this
pathway contains many missing enzymes and our
understanding of the detailed enzymatic behavior
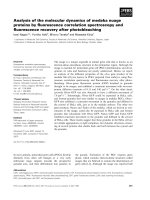
in this pathway is far from complete. Figure 2 shows
the lysine-degradation pathway stored in the
KEGG PATHWAY database, where a green box
indicates that the enzyme’s gene has been identified for
1
2
9
3
4
8
6
5
7
Gene Location
Predicted Gene Network
PATHWAY Database
Phylogenetic Profile
Gene 1 (1 0 1 0 0 0 1 0 1 1 1 0)
Gene 2 (1 0 1 0 0 0 1 0 1 1 1 0)
Gene 3 (1 0 1 0 0 0 1 0 1 1 1 0)
Gene 4 (1 0 1 0 0 0 1 0 1 1 1 0)
Gene 5 (0 0 0 0 0 0 1 0 1 1 1 0)
Gene 6 (1 1 1 1 1 1 1 1 1 1 1 0)
Gene 7 (1 0 1 0 0 1 1 1 1 1 1 1)
Gene 8 (1 0 1 0 0 0 0 0 0 0 1 0)
Gene 9 (1 0 1 0 0 0 0 0 0 0 1 0)
+
1.1.1.60
1.1.1.79
4.1.1.40
1.1.1.77
5
6
8
7
4
3
1
9
2
???
Fig. 1. Procedure for predicting missing enzyme genes. First, we estimated the functional associations between genes by predicting a global
gene network from the chromosomal proximity and phylogenetic profiles, using the supervised network inference method. Second, we
looked for sets of genes sharing high association scores with the neighbors of missing enzymes. Finally, we selected candidates for the
missing enzymes based on the chemical reaction information encoded in the first three digits of the EC numbers.
Prediction of missing enzyme genes Y. Yamanishi et al.
2264 FEBS Journal 274 (2007) 2262–2273 ª 2007 The Authors Journal compilation ª 2007 FEBS
P. aeruginosa, and the red color indicates missing
enzymes for which genes have yet to be identified.
Based on the predicted gene network, we attempted to
predict the candidate genes corresponding to missing
enzymes in this pathway. There are two paths from
l-lysine to glutarate in the lysine-degradation pathway:
l-lysine fi 5-amino pentanamide fi 5-amino pen-
tanoate fi glutarate semialdehyde fi glutarate and
l-lysine fi cadaverine fi 1-piperideine fi 5-amino
pentanoate fi glutarate semialdehyde fi glutarate.
The second pathway is known to exist for P. aerugi-
nosa [32]. However, several of the enzyme genes
involved have not been identified, therefore we foc-
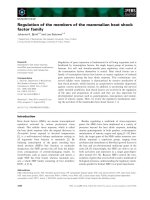
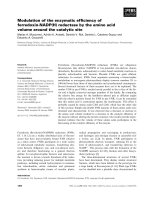
used on the second pathway, which is illustrated in
Fig. 3.
We used PA1586 (EC 2.3.1.61) and PA0447
(EC 1.3.99.7) as seed genes, because they are adjacent
to the missing enzymes. These enzyme genes PA1586
and PA0447 are known to work in the lysine-degrada-
tion pathway. We looked for genes with high graphical
association scores to PA1586 and PA0447 in our pre-
dicted gene network, using our original candidate score
(see Experimental procedures for more details).
Table 2 shows a list of the top 50 high-scoring genes.
Several of these high-scoring genes may be functionally
related to PA1586 and PA0447. Taking into account
the first three digits of the EC numbers, we assigned
the high-scoring genes to each missing enzyme. For
example, the first three digits of the EC number for
PA1589 (EC 6.2.1.5) are the same as those for the
missing enzyme (EC 6.2.1.6), therefore we predicted
that PA1589 is a candidate for the enzyme gene corres-
ponding to EC 6.2.1.6. In a similar manner, we predi-
cted PA0265 (EC 1.2.1.16) and PA0266 (EC 2.6.1.19)
as enzyme gene candidates for EC 1.2.1.20 and
EC 2.6.1.48. The chemical reactions between cadave-
rine, 1-piperideine and 5-amino pentanoate have not
been assigned an EC number in the International
Table 1. Prediction accuracy for gene network inference: ROC
scores.
Method ROC score
Gene position only 0.65
Phylogenetic profile only 0.7
Integration of the genomic data 0.79
LYSINE DEGRADATION
Penicillins and cephalos-
porins biosynthesis
2-Oxoadipate
S -Glutaryl-
dihydrolipoamide
Crotonoyl-
CoA
2.6.1.39 1.2.1.31
1.5.3.7
1.5.1.21
1.4.3.14
2.6.1.21
5.1.1.5
5.1.1.9
5.4.3.4
1.4.1.12
1.4.1.11
6.3.2.27
2.3.1.102
5.4.3.3
5.4.3.2
1.14.13.59
2.6.1.65
3.5.1.17 2.3.1.32
1.5.1.16
3.5.1.17
1.5.1.1
1.5.99.3
1.2.4.2
2.3.1.61
1.3.99.7
4.2.1.17
1.1.1.35
2.3.1.9
Acetoacetyl-
CoA
Protein-
lysine
erythro-5-
Hydroxylysine
Protein-
N6-Me-lysine
Glutaryl-
CoA
Glutarate
Glutarate
semialdehyde
5-Amino
pentanoate
1-Piperideine
5-Amino-
pentanamide
Cadaverine
N2-(
D-1-Carboxy-
ethyl)-
L-lysine
L-2-Aminoadipate
6-semialdehyde
L-2-Amino-
adipate
Saccharopine
6-Amino-2-
oxohexanoate
6-Acetoamido-
2-oxohexanoate
D-Lysine
2,5-Diamino-
hexanoate
3,5-Diamino-
hexanoate
L-β-Lysine
L-Lysine
N6-Hydroxy-
lysine
N6-Acetyl-N6-
hydroxy-lysine
Aerobactin
2-Amino-5-
oxohexanoate
5-Amino-3-
oxohexanoate
N -Acetyl-
lysine
L-Pipecolate
Δ1-Piperideine-
6-
L-carboxylate
Δ1-Piperideine-
2-carboxylate
1.5.1.7
1.5.1.9
1.5.1.10
1.5.1.8
3.5.1.30
1.13.122
2.3.1.–
2.6.1.39
1.1.1.–
3.5.1.63
5-Acetanmido-
pentanoate
6-Acetanmido-
2-oxohexanoate
N -Acetyllysine
Glycine
4-Trimethyl-
ammoniobutanoate
Biotin metabolism
Lysine biosynthesis
4-Trimethyl-
ammoniobutanal
N6-Hydroxy-
trimethyl-lysine
Protein-N -
trimethyl-lysine
3.4.–.–
2.1.1.43
2.1.1.59
2.1.1.60
Protein-N, N -
Me2-lysine
5-Phosphonooxy-lysine
Trimethyl-
lysine
5-Galactosyloxy-lysine
Camitine
3-Dehydroxy-
camitine
1.14.11.1
1.14.11.1
1.2.1.47
1.2.1.3
2.1.2.1
1.14.11.8
Citrate cycle
2.1.1.43
2.1.1.59
2.1.1.60
1.14.11.4
2.4.1.50
2.7.1.81
2.1.1.60
2.1.1.59
2.1.1.43
Acetyl-CoA
(S)-3-Hydroxy-
butanoyl-CoA
Fig. 2. Lysine-degradation pathway of P. aeruginosa. A small circle corresponds to one chemical compound and a rectangle corresponds to
one enzyme protein. Green indicates that the coding enzyme genes have been identified, and red indicates that the coding enzyme genes
have not yet been identified. ‘?’ indicates that the enzyme has not been assigned an EC number.
Y. Yamanishi et al. Prediction of missing enzyme genes
FEBS Journal 274 (2007) 2262–2273 ª 2007 The Authors Journal compilation ª 2007 FEBS 2265
Union of Biochemistry and Molecular Biology
(IUBMB) at the time of writing.
To obtain putative EC number information, we used
the E-zyme system [24], which is an automatic EC
number assignment system developed in the KEGG
database. Using the E-zyme system, we carried out EC
number predictions based on the chemical structures
of 1-piperideine and 5-amino pentanoate. As a result,
the E-zyme system returned EC 1.1.1 for the chemical
reaction. The list of high-scoring genes contains
PA1576 (EC 1.1.1.31), so we assigned it to the missing
enzyme involved in the reaction between 1-piperideine
and 5-amino pentanoate. Unfortunately, the current
version of the E-zyme system could not generate a pre-
diction for the reaction between cadaverine and 1-pip-
erideine, because there is no template information
describing the target reaction in the current system.
For EC 4.1.1.18, the list of high-scoring genes does
not contain any genes whose first three EC number
digits match. Therefore, we were not able to assign
any specific gene to the missing enzyme EC 4.1.1.18.
However, there are many hypothetical proteins with
high candidate scores in the list given in Table 2, so
there is a possibility that one of these hypothetical pro-
teins might work as an enzyme in the target chemical
reaction. Table 3 summarizes our gene assignment for
the corresponding missing enzymes in the lysine-degra-
dation pathway.
Expression and purification of recombinant
enzymes
Finally, we conducted a wet-lab experiment based on
biological assays in order to verify that our predicted
genes were involved in the target chemical reactions.
We focused on a successive reaction: 4-amino pentano-
ate fi glutarate semialdehyde fi glutarate. Recall that
we predicted that PA0266 was a putative 5-amino-
valerate aminotransferase (EC 2.6.1.48) and PA0265
a putative glutarate semialdehyde dehydrogenase
(EC 1.2.1.20). The PA0265 and PA0266 genes were
cloned by PCR and expressed in E. coli, and the pro-
teins were purified to homogeneity as a C-terminal
histidine-tagged fusion protein. SDS ⁄ PAGE analysis of
the purified PA0265 and PA0266 proteins gave single
bands with subunit molecular masses of 53 and
46 kDa, respectively, in good agreement with those
calculated from the amino acid sequences (53 142 and
46 285 Da, respectively). Purified PA0266 exhibits a
yellow color and UV-visible spectra characteristic of a
pyridoxal 5¢-phosphate-dependent enzyme (data not
shown).
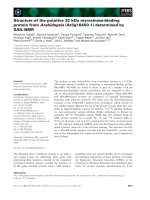
Enzymatic activity of predicted genes
The activity of PA0265 and PA0266 was examined in
a coupled reaction, in which conversion of 5-amino
pentanoate fi glutarate semialdehyde fi glutarate
was monitored by the increase in the amount of
O
O
L-Lysine
EC:4.1.1.18
EC: ?
N
Cadaverine
1–Pierideine
5–Aminopentanoate
O
O
H
HO
Glutarate semialdehyde
Glutarate
Glutaryl–CoA
O
OH
O
HO
EC: 1.2.1.20
EC: 6.2.1.6
O
HO
A
B
C
D
E
F
O
CoA
EC: ?
EC: 2.6.1.48
HO
NH
2
NH
2
NH
2
H
2
N
NH
2
HO
O
Fig. 3. A series of chemical reactions focused on in this study.
Cadaverin-based path from
L-lysine to glutarate via cadaverine,
1-piperideine, 5-amino pentanoate, and glutarate semialdehyde.
Prediction of missing enzyme genes Y. Yamanishi et al.
2266 FEBS Journal 274 (2007) 2262–2273 ª 2007 The Authors Journal compilation ª 2007 FEBS
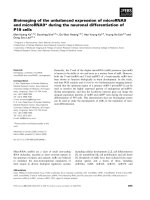
NADPH at 340 nm (Fig. 4A). We found that the
enzymes catalyzed the expected reactions (Fig. 4B),
and no activity was seen when both enzymes were
omitted from the reaction. Reaction mixture contain-
ing only PA0266 showed a slight increase A
340
, due to
the formation of pyridoxamine 5’-phosphate from
Table 2. Top 50 high-scoring genes in our candidate scores.
Score Candidate Annotation
0.51 PA1587 lipoamide dehydrogenase-glc (EC 1.8.1.4)
0.495 PA1591 hypothetical protein
0.48 PA1593 hypothetical protein
0.485 PA1585 2-oxoglutarate dehydrogenase (E1 subunit) (EC 1.2.4.2)
0.47 PA1594 hypothetical protein
0.46 PA1592 hypothetical protein
0.46 PA1589 succinyl-CoA synthetase alpha chain (EC 6.2.1.5)
0.46 PA1579 hypothetical protein
0.45 PA1595 hypothetical protein
0.455 PA0265 succinate-semialdehyde dehydrogenase (EC 1.2.1.16)
0.44 PA0266 4-aminobutyrate aminotransferase (EC 2.6.1.19)
0.445 PA1584 succinate dehydrogenase (B subunit) (EC 1.3.99.1)
0.43 PA1597 hypothetical protein
0.435 PA1599 probable transcriptional regulator
0.435 PA1582 succinate dehydrogenase (D subunit) (EC 1.3.99.1)
0.435 PA1578 hypothetical protein
0.435 PA1576 probable 3-hydroxyisobutyrate dehydrogenase (EC 1.1.1.31)
0.42 PA4330 probable enoyl-CoA hydratase ⁄ isomerase (EC 4.2.1.17)
0.42 PA1588 succinyl-CoA synthetase beta chain (EC 6.2.1.5)
0.42 PA1581 succinate dehydrogenase (C subunit) (EC 1.3.99.1)
0.425 PA1571 hypothetical protein
0.425 PA1570 probable transcriptional regulator
0.425 PA0456 probable cold-shock protein
0.41 PA1603 probable transcriptional regulator
0.41 PA1577 hypothetical protein
0.41 PA1573 conserved hypothetical protein
0.415 PA1601 probable aldehyde dehydrogenase
0.405 PA2013 probable enoyl-CoA hydratase ⁄ isomerase (EC 4.2.1.17)
0.4 PA1574 conserved hypothetical protein
0.39 PA1998 probable transcriptional regulator
0.39 PA1596 heat shock protein HtpG
0.39 PA1583 succinate dehydrogenase (A subunit) (EC 1.3.99.1)
0.395 PA1600 probable cytochrome c
0.38 PA1985 pyrroloquinoline quinone biosynthesis protein A
0.38 PA1604 hypothetical protein
0.385 PA1605 hypothetical protein
0.37 PA1590 branched chain amino acid transporter
0.375 PA0450 probable phosphate transporter
0.36 PA1629 probable enoyl-CoA hydratase ⁄ isomerase (EC 4.2.1.17)
0.36 PA0455 RNA helicase DbpA
0.365 PA0854 fumarate hydratase (EC 4.2.1.2)
0.365 PA0446 conserved hypothetical protein
0.35 PA2556 probable transcriptional regulator
0.35 PA2401 probable nonribosomal peptide synthetase
0.35 PA1606 hypothetical protein
0.355 PA2400 probable nonribosomal peptide synthetase
0.355 PA2250 lipoamide dehydrogenase-Val (EC 1.8.1.4)
0.355 PA1575 hypothetical protein
0.34 PA4333 probable fumarase (EC 4.2.1.2)
0.34 PA1628 putative 3-hydroxybutyryl-CoA dehydrogenase (EC 1.1.1.157)
0.3 PA3416 pyruvate dehydrogenase E1 component, beta subunit (EC 1.2.4.1)
Y. Yamanishi et al. Prediction of missing enzyme genes
FEBS Journal 274 (2007) 2262–2273 ª 2007 The Authors Journal compilation ª 2007 FEBS 2267
pyridoxal 5’-phosphate via a transamination reaction
catalyzed by PA0266. Therefore, we concluded that
PA0265 is glutarate semialdehyde dehydrogenase and
PA0266 is 5-aminovalerate aminotransferase.
Discussion
Here, we have proposed a novel method to predict
genes coding for missing enzymes in metabolic path-
ways using genomic data and chemical information for
bacterial genomes. As an application of this technique,
we attempted to reconstruct the enzyme gene network
of the lysine-degradation pathway in P. aeruginosa.
We filled in some of the enzyme genes in the lysine-
degradation pathway, for example, by predicting
PA0266 as a putative 5-aminovalerate aminotrans-
ferase and PA0265 as a putative glutarate semialdehyde
dehydrogenase. Recently, a report has suggested candi-
date genes for 5-aminovalerate aminotransferase and
glutarate semialdehyde dehydrogenase in the lysine-
degradation pathway of P. putida [34]. These genes
have an orthologous relationship with those predicted
for P. aeruginosa, so this is additional evidence for our
prediction. We also confirmed the validity of our pre-
diction by conducting biochemical assays. We exam-
ined enzyme activity in successive enzymatic reactions,
and observed that the genes PA0266 and PA0265 work
as 5-aminovalerate aminotransferase and glutarate
semialdehyde dehydrogenase, catalyzing successive
chemical reactions from 5-amino pentanoate to gluta-
rate. There is a hypothesis that the predicted gene
products PA0266 and PA0265 might have broad sub-
strate specificity. For example, the E. coli gene of
EC 2.6.1.19 (on which many experimental studies have
been performed) has high sequence similarity with
P. aeruginosa gene PA0266, and the corresponding
gene cluster structure is well conserved.
To date, techniques for reconstructing metabolic
networks have depended heavily on sequence homol-
ogy detection [35]. A typical computational approach
to reconstructing the metabolic network from the gen-
ome sequence of a certain organism is as follows:
(a) Assign an EC number to enzyme candidate genes
by detecting homology based on comparative genomics
across different organisms. (b) Obtain compound
information such as substrates and products, in which
the enzyme genes are involved, from reaction know-
ledge based on the EC number. (c) Assign each
enzyme gene to appropriate positions in metabolic
pathway maps, created from current biochemical
knowledge for many organisms. (d) Visualize metabolic
Table 3. Assignment of genes to missing enzymes in the lysine-
degradation pathway of P. aeruginosa.
Reaction Candidate gene
A. EC:6.2.1.6 PA1589 (succinyl-CoA synthetase; EC 6.2.1.5)
B. EC:1.2.1.20 PA0265 (dehydrogenase; EC 1.2.1.16)
C. EC:2.6.1.48 PA0266 (amino-transferase; EC 2.6.1.19)
D. 5ami.1-pip PA1576 (dehydrogenase; EC 1.1.1.31)
E. Cadav.Delta not specified
F. EC:4.1.1.18 not specified
0
0.05
0.10
0.15
0.20
0 100 200 300 400 500 600
5-Aminovalerate
Glutarate semialdehyde
Glutarate
Glutamate
2-Oxoglutarate
NADP
+
NADPH
PA0266
PA0265
Time (s)
Absorbance at 340 nm
A
B
a
b
c d
Fig. 4. Enzymatic activity of predicted
genes. (A) Schematic drawing of reactions
catalyzed by aminovalerate aminotrans-
ferase (PA0266) and glutarate semialdehyde
dehydrogenase (PA0265). (B) Activity of
PA0265 and PA0266. The reaction was car-
ried out in the presence of PA0266 and
PA0265 (a), PA0266 (b), PA0265 (c), or in
the absence of the enzymes (d).
Prediction of missing enzyme genes Y. Yamanishi et al.
2268 FEBS Journal 274 (2007) 2262–2273 ª 2007 The Authors Journal compilation ª 2007 FEBS
pathways that are specific to a target organism. How-
ever, this procedure does not always work well in
reconstructing the correct metabolic pathways, and
tends to lead to many missing enzymes or gaps in
known metabolic pathways. If we cannot detect a sig-
nificant sequence homology with enzyme genes whose
pathway information is known in other organisms, it
is not possible to identify candidate genes for missing
enzymes. This has been one cause of missing enzymes
or pathway gaps in the predicted metabolic network,
as suggested previously [9–11].
There are two possible reasons for missing enzymes
in predicted pathways. First, there may be alternative
paths between the two compounds either side of the
gap. To solve this, a path computation approach has
been proposed [25]. This method searches all possible
pathways between two compounds if the enzyme link-
ing the compounds is missing. However, it has been
pointed out that this system tends to show too many
possible pathways. Second, the EC number annotation
might be wrong for the enzyme linking the com-
pounds. We often observe that the sequence homology
for enzymes sharing the first three digits of the EC
number is well conserved across different organisms,
however, sequence homology corresponding to the
substrate specificity represented by the fourth digit of
the EC number is not strongly conserved. Therefore, it
is suspected that wrongly annotated genes may have
been the cause of some of the pathway gaps or missing
enzymes. It is also suspected that many genes have
been assigned incorrect EC numbers and assigned the
wrong biological roles. Even so, the first three digits of
the EC number remain useful for predicting potential
enzyme genes, and if the first three digits in the EC
number are the same between two enzymes, those
enzymes can be considered to catalyze similar types of
chemical reactions. Therefore, our gene-selection
method for missing enzymes can be regarded as rea-
sonable from a chemical viewpoint. It should also be
pointed out that our method is applicable to any reac-
tion, even when no EC numbers are assigned to the
reactions, because our procedure includes the process
of estimating the possible EC subsubclass for the reac-
tions based on biochemical structure transformation
patterns [33]. There are many reactions for which EC
numbers have not been assigned, especially in secon-
dary metabolism. We expect that our approach works
well for such complex metabolic pathways.
From a technical viewpoint, we transformed all the
predictor datasets into kernel-similarity matrices in
order to estimate functional associations between
genes. In this study, we used the gene position and
phylogenetic profiles because they reflect the following
two properties of bacterial genomes. First, functionally
interacting genes in metabolic pathways tend to be clo-
sely located along the chromosome, as seen in operon
structures [16,27]. Second, functionally interacting
genes in metabolic pathways tend to evolve in a corre-
lated manner [28–30]. Performance depends on the
design of the kernel-similarity measure, so there
remains room in the evaluation for gene–gene similar-
ities based on each data source. For gene position
data, the incorporation of directed information of genes
into the similarity would be interesting. For phylo-
genetic profiles, the use of a real-valued phylogenetic
profile [36] might improve the performance. Additional
use of other genomic information, such as gene fusion
[17,18], in the framework of kernel methods will be
studied in future.
Another solution to the problem of missing enzymes
would be to use other experimental data such as gene-
expression data [21,22]. The pattern of gene expression
based on several experimental conditions makes it
possible to observe the expression behavior of thou-
sands of genes and estimate potential functional associ-
ations between them. It has been confirmed that the
gene-expression pattern of successively working
enzyme pairs is more similar than that of randomly
selected enzyme pairs [21]. Therefore, gene-expression
data would be a useful source of additional data in
our study. However, microarray technology is expen-
sive, so the information is not always available for the
target organism, and we were not able to obtain the
microarray gene expression data for P. aeruginosa.
Another problem is that the microarray data tend to
contain considerable noise. By contrast, our method
brings about a new possibility for the systematic pre-
diction of potential functional relationships between
genes. Our predicted network enables us to suggest
unknown gene–gene relations and estimate missing
enzyme genes using just the adjacency information and
comparative genomics.
The originality of this study is also seen in the colla-
borative work between both computational prediction
and experimental validation. In this study, the biologi-
cal validity of the prediction was confirmed by con-
ducting a biochemical assay, and it was observed that
the enzymes corresponding to the predicted genes cata-
lyzed successive reactions in the target metabolic path-
way. This type of collaborative work will become a
standard in research in near future. Furthermore, we
expect to identify more missing enzyme genes in other
pathways by a similar application of our approach.
Comprehensive identification of missing enzyme genes
in the entire metabolic network will be carried out in
the future.
Y. Yamanishi et al. Prediction of missing enzyme genes
FEBS Journal 274 (2007) 2262–2273 ª 2007 The Authors Journal compilation ª 2007 FEBS 2269
Experimental procedures
Datasets
In this study, we focused on the metabolic pathways of
P. aeruginosa. As a gold standard for the enzyme gene net-
work, we used the KEGG PATHWAY database [7]. The
resulting enzyme network contains 799 nodes and 2782
edges. Note that this network is based on biological phenom-
ena and represents known molecular interaction networks in
various cellular processes. We obtained information about
enzyme genes from the KEGG GENES database, in which
EC numbers are assigned to candidate enzyme genes. At the
time of writing, in P. aeruginosa, 1133 genes have been
assigned at least one EC number, but only 799 have been
assigned at least one precise role in metabolic pathways.
The dataset for the gene position on the genome was con-
structed from the KEGG GENES database. We obtained
information about the start and end positions of each gene
region (ORF region), and we computed all pair-wise distan-
ces between the genes. The gene position data can be regar-
ded as a dataset representing the spatial association between
genes along chromosomes. Phylogenetic profiles were con-
structed from a set of ortholog gene clusters (OGCs)
obtained from comprehensive cluster analysis for all the
genes of fully sequenced organisms in KEGG GENES. A
group of genes identified as a quasi-clique in the graph of
the KEGG SSDB (sequence similarity database) is thought
to be a candidate for the OGC. The concept of OGC is sim-
ilar to that of the COG database [37]. In this study, we
focus on organisms with fully sequenced genomes, including
11 eukaryotes, 16 archaea, and 118 bacteria. Each phylo-
genetic profile consists of a string of bits, in which the pres-
ence and absence of an orthologuous gene is coded 1 and 0,
respectively, across the above 145 organisms.
We obtained chemical information for the enzymes, for
example chemical reactions, substrates and products, from
their EC numbers, using the KEGG LIGAND database [38],
which contains 11 817 compounds and 6349 reactions at the
time of writing. EC numbers are a numerical classification
scheme for enzymes, based on the chemical reactions they cat-
alyze. We focused on the first three digits in the EC number,
because the fourth digit in the EC number is often just a serial
number. In cases where a target reaction has not been
assigned an EC number, we used the E-zyme system, which
was recently developed in the KEGG database. The E-zyme
system is an EC number assignment system for chemical reac-
tions, which enabled us to estimate the first three digits of the
EC number for the target reaction by taking into account the
structural information of two given chemical compounds [33].
Data representation and integration
To deal with the heterogeneity of genomic datasets, we pro-
pose to transform all the datasets into kernel-similarity
matrices [26]. In recent years, kernel methods such as
support vector machine have received much attention in
computational biology. An advantage of using kernel meth-
ods is that we can apply a variety of statistical analyses to
any structured data, for example graphs, strings and trees.
Suppose that we have a set of genes fx
i
g
n
i¼1
; where n is the
number of genes. For the gene position data, we computed
all the pair-wise distances between genes along the chromo-
some, where the distance d
ij
between gene i and gene j is
defined by the number of nucleotides between the end of
the i-th gene and the start of the j-th gene along the chro-
mosomes. We then derived a distance kernel using the for-
mula K
position
(x
i
,x
j
) ¼ exp(–d
ij
⁄ h ) for i,j ¼ 1,2, ,n where h
is a positive constant parameter. In this study the param-
eter h is set to 10
5
. This means that, the larger the distance
between two genes along the chromosome, the smaller the
value of the similarity score. The resulting kernel matrix
(similarity matrix) is denoted as K
position
. The phylogenetic
profiles are sets of numerical vectors. Suppose that we have
n genes and q organisms. Let us define x as the phylogene-
tic profile for each gene (145 dimensional vector) and y as
the phylogenetic profile for each organism (5525 dimen-
sional vector). Here we used a weighted linear kernel
(weighted inner product) as follows:
K
phylogenetic
ðx
i
; x
j
Þ¼x
T
i
Wx
j
; for i; j ¼ 1; 2; ; n;
where W is an diagonal matrix whose elements are given as
ðWÞ
kk
¼ 1 À corrðy
pae
; y
k
Þ; for k ¼ 1; 2; ; q
where q is the number of organisms, y
pae
is the phylogenetic
profile for P. aeruginosa, and corr(.) refers to Peason’s corre-
lation coefficient. This means that the more similar the gene
inheritance pattern between two genes, the larger the value of
the similarity score. The resulting kernel-similarity matrix is
denoted as K
phylogenetic
. The weight is introduced to reduce
the effect of related organisms with P. aeruginosa. All the
kernel-similarity matrices are supposed to be normalized so
that the diagonal elements are all 1. This means that the
maximum value of the similarity score is 1 and the minimum
value of the similarity score is 0. To integrate the above infor-
mation of gene position and phylogenetic profile into a single
one, we constructed a new kernel-similarity matrix by taking
the weighted sum of the above kernel matrices as follows:
K
genomic
¼ w
1
K
position
+w
2
K
phylogenetic
. The usefulness of this
type of data integration has been shown previously [24,39].
Network inference
A straightforward approach to network reconstruction is a
similarity-based approach, which is based on an assumption
that functionally related enzyme pairs are likely to share
high similarity with respect to a given dataset. Intuitively,
the kernel value K(x
i
,x
j
) can often be considered as a meas-
ure of similarity between gene x
i
and gene x
j
. This strategy
Prediction of missing enzyme genes Y. Yamanishi et al.
2270 FEBS Journal 274 (2007) 2262–2273 ª 2007 The Authors Journal compilation ª 2007 FEBS
is therefore to predict an edge between two genes whenever
the kernel value between these genes is above a threshold
to be determined. We refer to this approach as the direct
approach. The discrete version of this approach corres-
ponds to the joint graph method [17]. However, we some-
times meet cases in which gene pairs sharing high similarity
based on the data do not always have any functional
relation.
In this study, we used a recently proposed algorithm to
perform the supervised inference of the metabolic gene net-
work [24,31]. As opposed to the direct approach, these
methods require a partial knowledge of the true metabolic
network. An advantage of using the supervised network
inference method is that we can distinguish functionally
related gene pairs as being different from functionally
meaningless gene pairs, which have numerically high simi-
larity values based on the data. This formalism is more
suitable to our current situation, because we can obtain
partially known networks from, for example, the KEGG
PATHWAY database.
Here, we make a brief review of the supervised network
inference method. This algorithm involves a training pro-
cess, where a mapping of all genes to a low-dimensional
space is learned by exploiting the partial knowledge of
the network, and a test process where new edges are
inferred. Roughly speaking, the training process finds a
projection f(Æ) which minimizes the following criterion:
P
i$j
fðx
i
ÞÀfðx
j
Þ
ÀÁ
2
where i $ j means gene i and gene j
are adjacent on the training network. Note that f(x) ¼
(f
(1)
(x), f
(2)
(x), ., f
(L)
(x))
T
and L are the number of
features of interest. The test process is simply the
direct approach performed after genes are mapped to
the low-dimensional feature space, that is, pairs of
genes with short interdistances are connected. Follow-
ing the spirit of the direct approach, we use a similar-
ity measure to evaluate the closeness between genes in
the feature space. In this study, the Pearson’s correla-
tion coefficient between f(x
i
) for gene i and f(x
j
) for
gene j is used as an indicator of the presence or
absence of edges. This is referred to as graphical
association score, and the resulting matrix whose ele-
ments represent the graphical association scores is
denoted as S. For example, S(x
i
,x
j
) represents a graph-
ical association score between genes x
i
and x
j
. High
scoring gene pairs are expected to be connected in the
target network, therefore the output of this algorithm
is thought of as a weighted graph.
In this study, we adopted the kernel CCA-based algorithm
[24], and set the number of features L (dimension of the fea-
ture space) to 50, the regularization parameter k (trade-off
parameter to avoid over-fitting in the training process) to 0.1
in the application, because the usefulness of those parameter
values had been confirmed through systematic cross-valida-
tion experiments in our previous studies [24].
Selecting candidate genes coding for missing
enzymes
Missing enzymes in metabolic pathways are found visually
by looking at the connectivity between the enzyme genes on
the pathway map reflecting current pathway knowledge.
Suppose that there is a pathway hole between known
enzyme gene a and known enzyme gene b, and this path-
way hole consists of missing enzymes. To find genes coding
for such missing enzymes, we search set of genes having
high graphical association score with the known enzyme
genes a and b in our predicted network.
More generally, suppose that there are multiple known
enzyme genes around a target pathway hole as A ¼
{a
1
,a
2
, .,a
|A|
}, where |A| is the number of known enzyme
genes that are adjacent to missing enzymes in a target path-
way hole. We define candidate score defined as follows:
1
jAj
P
jAj
p¼1
Sðx; a
p
Þ; where S is the graphical association matrix
whose elements correspond to weighted edges in the predic-
ted network. High-scoring genes are chosen as candidates
for target missing enzymes.
We then select genes for which the first three digits of the
EC number are the same as that of the corresponding miss-
ing enzymes. This strategy is based on the following proper-
ties of the EC numbers. The first three digits of the EC
number represent the chemical reaction types with which
an enzyme is involved, while the fourth digit represents the
substrate specificity or serial number [24]. Therefore, a set
of enzymes, whose the first three digits of the EC number
are the same, are suspected of catalyzing similar reactions.
Cloning and gene expression
DNA fragments containing the PA0265 and PA0266
genes were amplified by PCR from the genomic DNA of
P. aeruginosa: PAO1 (M. Olson, University of Washington,
Seattle, WA) and cloned into pET21a(+) (Novagen, Madi-
son, WI). The primers used for the PCR cloning for
PA0265 were as follows: 5’-GGAATTCCATATGCAACT
CAAAGATGCCAAGCTG)3’ and 5’-CCCAAGCTTGA
TACCGCCCAGGCAGAGGTACTTG-3’.
The primers used for the PCR cloning of PA0266 were
as follows: 5’-GGAATTCCATATGAGCAAGACCAACG
AATCCC-3’ and 5’-CCGCTCGAGAGCGAGTTCGTCG
AAGCACTCGG-3’. PCR was performed using KOD-plus
DNA polymerase (Toyobo Co., Ltd, Osaka, Japan) with 30
cycles of 94 °C for 30 s, 60 °C for 30 s, and 68 °C for
120 s. The resulting PA0265 DNA fragment was digested
with NdeI and HindIII, and the PA0266 fragment was
digested with NdeI and XhoI. Each digested fragment was
ligated into the corresponding sites of pET21a(+) (Nova-
gen) to obtain pETPA0265 and pETPA0266. The proteins
with a C-terminal His6-tag were overexpressed in the E. coli
BL21(DE3) cells carrying pETPA0265 or pETPA0266 at
Y. Yamanishi et al. Prediction of missing enzyme genes
FEBS Journal 274 (2007) 2262–2273 ª 2007 The Authors Journal compilation ª 2007 FEBS 2271
37 °C (for PA0265) and 28 °C (for PA0266, the lower tem-
perature was to prevent the formation of inclusion bodies).
PA0265 was purified as follows. E. coli BL21(DE3) ⁄
pETPA0265 cells were harvested, resuspended in binding
buffer (20 mm Tris ⁄ HCl, pH 7.9, 5 mm imidazole), and dis-
rupted by sonication. Cell debris was removed by centrifu-
gation. The resulting supernatant was loaded onto a 10 mL
of His-Bind column (Novagen) equilibrated with the bind-
ing buffer. The column was washed with 200 mL of a wash
buffer (20 mm Tris ⁄ HCl, pH 7.9, 60 mm imidazole). The
enzyme was eluted using a liner gradient of 60 to 500 mm
imidazole in a buffer. The enzyme fractions were pooled
and dialyzed against 20 mm Tris ⁄ HCl (pH 8.0). The puri-
fied enzyme was concentrated and stored at )80 °C until
use. Purification of PA0266 was performed in the same
manner as the purification of PA0255, except that all
buffers contained 20 m pyridoxal 5’-phosphate.
Enzyme assay
A coupled enzymatic reaction was carried out in 100 mm
Tris ⁄ HCl (pH 8.0) containing 20 mm 5-amino pentanoate,
20 mm a-ketoglutaric acid, 0.2 mm NADP
+
, 0.1 mm pyrid-
oxal 5’-phosphate, 50 mgÆmL
)1
PA0266, and 20 mgÆmL
)1
PA0265 at 35 °C. An increase in A
340
due to the formation
of NADPH was monitored with a UV-2450 spectrophoto-
meter (Shimadzu, Kyoto, Japan).
Acknowledgements
This study was supported by ICR Grants for Young
Scientists, grants from the Ministry of Education, Cul-
ture, Sports, Science and Technology, and the Japan
Science and Technology Corporation. The computa-
tional resource was provided by the Bioinformatics Cen-
ter, Institute for Chemical Research, Kyoto University.
References
1 Kanehisa M (2001) Prediction of higher order func-
tional networks from genomic data. Pharmacogenomics
2, 373–385.
2 Kanehisa M & Bork P (2003) Bioinformatics in the
post-sequence era. Nat Genet 33, 305–310.
3 Toh H & Horimoto K (2002) Inference of a genetic net-
work by a combined approach of cluster analysis and
graphical Gaussian modeling. Bioinformatics 18, 287–
297.
4 Covert MW, Knight EM, Reed JL, Herrgard MJ &
Palsson BO (2004) Integrating high-throughput and
computational data elucidates bacterial networks.
Nature 429, 92–96.
5 Hu Z, Mellor J, Wu J, Yamada T, Holloway D & Delisi
C (2005) VisANT: data-integrating visual framework
for biological networks and modules. Nucleic Acids Res
33, W352–W357.
6 von Mering C, Huynen M, Jaeggi D, Schmidt S, Bork
P & Snel B (2003) STRING: a database of predicted
functional associations between proteins. Nucleic Acids
Res 31, 258–261.
7 Kanehisa M, Goto S, Kawashima S, Okuno Y &
Hattori M (2004) The KEGG resource for deciphering
the genome. Nucleic Acids Res 32, D277–D280.
8 Keseler IM, Collado-Vides J, Gama-Castro S, Ingraham
J, Paley S, Paulsen IT, Peralta-Gil M & Karp PD
(2005) EcoCyc: a comprehensive database resource for
Escherichia coli. Nucleic Acids Res 33, D334–D337.
9 Karp PD (2004) Call for an enzyme genomics initiative.
Genome Biol 5, 401.
10 Osterman A & Overbeek R (2003) Missing genes in
metabolic pathways: a comparative genomics approach.
Curr Opin Chem Biol 7, 238–251.
11 Francke C, Siezen RJ & Teusink B (2005) Reconstruc-
ting the metabolic network of a bacterium from its
genome. Trends Microbiol 13, 550–558.
12 Smith TF & Waterman MS (1981) Identification of
common molecular subsequences. J Mol Biol 147,
195–197.
13 Altschul SF, Gish W, Miller W, Myers E & Lipman DJ
(1990) Basic local alignment search tool. J Mol Biol
215, 403–410.
14 Altschul SF, Madden TL, Schaffer AA, Zhang J, Zhang
Z, Miller W & Lipman DJ (1997) Gapped BLAST and
PSI-BLAST: a new generation of protein database
search programs. Nucleic Acids Res 25, 3389–3402.
15 Brenner SE, Chothia C & Hubbard TJP (1998) Asses-
sing sequence comparison methods with reliable structu-
rally identified distant evolutionary relationships. Proc
Natl Acad Sci USA 95, 6073–6078.
16 Overbeek R, Fonstein M, D’Souza M, Pusch GD &
Maltsev N (1999) The use of gene clusters to infer
functional coupling. Proc Natl Acad Sci USA 96,
2896–2901.
17 Marcotte EM, Pellegrini M, Thompson MJ, Yeates TO
& Eisenberg D (1999) A combined algorithm for
genome-wide prediction of protein function. Nature
402, 83–86.
18 Enright AJ, Iliopoulos I, Kyrpides NC & Ouzounis CA
(1999) Protein interaction maps for complete genomes
based on gene fusion events. Nature 402 (6757), 25–26.
19 Snel B, Lehmann G, Bork P & Huynen MAB (2000)
STRING: a web-server to retrieve and display the
repeatedly occurring neighbourhood of a gene. Nucleic
Acids Res 28
, 3442–3444.
20 Huynen M, Snel B, Lathe W & Bork P (2000) Predict-
ing protein function by genomic context: quantitative
evaluation and qualitative inferences. Genome Res 10,
1204–1210.
Prediction of missing enzyme genes Y. Yamanishi et al.
2272 FEBS Journal 274 (2007) 2262–2273 ª 2007 The Authors Journal compilation ª 2007 FEBS
21 Kharchenko P, Vitkup D & Church GM (2004) Filling
gaps in a metabolic network using expression informa-
tion. Bioinformatics 20, 449–453.
22 David H, Hofmann G, Oliveira AP, Jarmer H &
Nielsen J (2004) Metabolic network driven analysis of
genome-wide transcription data from Aspergillus
nidulans. Genome Biol 7, R108.
23 Green ML & Karp PD (2004) A Bayesian method for
identifying missing enzymes in predicted metabolic path-
way databases. BMC Bioinformatics 5, 76.
24 Yamanishi Y, Vert J-P & Kanehisa M (2004) Protein
network inference from multiple genomic data: a super-
vised approach, Bioinformatics (in ISMB2004) 20,
i363–i370.
25 Goto S, Bono H, Ogata H, Fujibuchi W, Nishioka T,
Sato K & Kanehisa M (1996) Organizing and comput-
ing metabolic pathway data in terms of binary relations.
Pacific Symp Biocomputing 2, 175–186.
26 Schoelkopf B, Tsuda K & Vert J-P (2004) Kernel Meth-
ods in Computational Biology. MIT Press, Cambridge,
MA.
27 Ogata H, Fujibuchi W, Goto S & Kanehisa M (2000) A
heuristic graph comparison algorithm and its applica-
tion to detect functionally related enzyme clusters.
Nucleic Acids Res 28, 4029–4036.
28 Pellegrini M, Marcotte EM, Thompson MJ, Eisenberg
D & Yeates TO (1999) Assigning protein functions by
comparative genome analysis: protein phylogenetic pro-
files. Proc Natl Acad Sci USA 96, 4285–4288.
29 Goh C, Bogan AA, Joachimiak M, Walther D & Cohen
FE (2000) Co-evalution of proteins with their interac-
tion partners. J Mol Biol 299, 403–410.
30 Pazos F & Valencia A (2001) Similarity of phylogenetic
trees as indicator of protein–protein interaction. Protein
Eng 14, 609–614.
31 Vert J-P & Yamanishi Y (2005) Supervised graph
inference. Adv Neural Inform Process Systems 17,
1433–1440.
32 Fothergill JC & Guest JR (1977) Catabolism of l-lysine
by Pseudomonas aeruginosa. J Gen Microbiol 99, 139–155.
33 Kotera M, Okuno Y, Hattori M, Goto S & Kanehisa
M (2004) Computational assignment of the EC numbers
for genomic-scale analysis of enzymatic reactions. JAm
Chem Soc 126, 16487–16498.
34 Revelles O, Espinosa-Urgel M, Fuhrer T, Sauer U &
Ramos JL (2005) Multiple and interconnected pathways
for l-lysine catabolism in Pseudomonas putida KT2440.
J Bacteriol 187, 7500–7511.
35 Bono H, Ogata H, Goto S & Kanehisa M (1998) Recon-
struction of amino acid biosynthesis pathways from the
complete genome sequence. Genome Res 8, 203–210.
36 Marcotte EM, Xenarios I, van Der Bliek AM &
Eisenberg D (2000) Localizing proteins in the cell from
their phylogenetic profiles. Proc Natl Acad Sci USA 97,
12115–12120.
37 Tatusov RL, Natale DA, Garkavtsev IV, Tatusova TA,
Shankavaram UT, Rao BS, Kiryutin B, Galperin MY,
Fedorova ND & Koonin EV (2001) The COG database:
new developments in phylogenetic classification of
proteins from complete genomes. Nucleic Acids Res
29,
22–28.
38 Goto S, Okuno Y, Hattori M, Nishioka T & Kanehisa
M (2002) LIGAND: database of chemical compounds
and reactions in biological pathways. Nucleic Acids Res
30, 402–404.
39 Yamanishi Y, Vert J-P, Nakaya A & Kanehisa M
(2003) Extraction of correlated gene clusters from multi-
ple genomic data by generalized kernel canonical corre-
lation analysis. Bioinformatics (in ISMB2003) 19,
i323–i330.
Y. Yamanishi et al. Prediction of missing enzyme genes
FEBS Journal 274 (2007) 2262–2273 ª 2007 The Authors Journal compilation ª 2007 FEBS 2273