Tài liệu Báo cáo khoa học: Motion of the Ca2+ -pump captured ppt
Bạn đang xem bản rút gọn của tài liệu. Xem và tải ngay bản đầy đủ của tài liệu tại đây (372.91 KB, 7 trang )
Motion of the Ca
2+
-pump captured
Masatoshi Yokokawa
1,2
and Kunio Takeyasu
1
1 Kyoto University Graduate School of Biostudies, Japan
2 Graduate School of Pure and Applied Science, University of Tsukuba, Japan
Keywords
atomic force microscopy; ion pump; P-type
ATPase; SERCA; single molecular reaction
analysis
Correspondence
M. Yokokawa, Graduate School of Pure and
Applied Science, University of Tsukuba,
1-1-1 Tennoudai, Tsukuba 305-8573, Japan
Fax: +81 29 853 4490
Tel: +81 29 853 5600 (5466)
E-mail:
(Received 9 March 2011, revised 24 May
2011, accepted 16 June 2011)
doi:10.1111/j.1742-4658.2011.08222.x
Studies of ion pumps, such as ATP synthetase and Ca
2+
-ATPase, have a
long history. The crystal structures of several kinds of ion pump have been
resolved, and provide static pictures of mechanisms of ion transport. In
this study, using fast-scanning atomic force microscopy, we have visualized
conformational changes in the sarcoplasmic reticulum Ca
2+
-ATPase
(SERCA) in real time at the single-molecule level. The analyses of individ-
ual SERCA molecules in the presence of both ATP and free Ca
2+
revealed
up–down structural changes corresponding to the Albers–Post scheme. This
fluctuation was strongly affected by the ATP and Ca
2+
concentrations,
and was prevented by an inhibitor, thapsigargin. Interestingly, at a physio-
logical ATP concentrations, the up–down motion disappeared completely.
These results indicate that SERCA does not transit through the shortest
structure, and has a catalytic pathway different from the ordinary Albers–
Post scheme under physiological conditions.
Introduction
Skeletal muscle contraction is subject to actin-linked
regulation by troponins [1,2]. The physiological player
in its molecular mechanism is Ca
2+
, which is released
into the cytoplasm from the sarcoplasmic reticulum
(SR) through the Ca
2+
-release channel. This removes
the troponin inhibition of the actin–myosin interaction,
and induces muscle contraction. When the muscle
relaxes, Ca
2+
needs to be removed from the cytoplasm
by the Ca
2+
-pump (Ca
2+
-ATPase) [3,4], which accu-
mulates Ca
2+
inside the SR against its concentration
gradient. The importance of the SR Ca
2+
-pump was
realized in the early 1960s by Ebashi and Lipmann
[5,6] and, since then, most of the molecular compo-
nents in the regulation of skeletal muscle contraction
have been identified, crystallized, and have their genes
cloned [1,2,7]. In this study, the motion of the
Ca
2+
-pump (sarco-endoplasmic reticulum Ca
2+
-
ATPase 1a, SERCA) in the rabbit SR membrane was
captured by using fast-scanning atomic force micros-
copy (FSAFM) [8–10].
Results and Discussion
Up–down motion of SERCA
Purified SR vesicles containing SERCA were directly
immobilized on a mica surface through electrostatic
force without any modification or chemical treatment
(solid supported membrane [11,12]). It appears that
the vesicles (the diameters of which vary from several
tens to hundreds of nanometers) can be adsorbed on
the mica surface without being broken, resulting in
‘double membranes’, and these flatten on the mica sur-
face with a thickness of 10 nm. Unfortunately, the
smallness of the vesicles and their loose adhesion to
the mica surface make FSAFM observation difficult.
Abbreviations
AFM, atomic force microscopy; DOC, deoxycholate; FSAFM, fast-scanning atomic force microscopy; SD, standard deviation; SERCA,
sarco-endoplasmic reticulum Ca
2+
-ATPase; SR, sarcoplasmic reticulum; TG, thapsigargin.
FEBS Journal 278 (2011) 3025–3031 ª 2011 The Authors Journal compilation ª 2011 FEBS 3025
On the other hand, after treatment with deoxycholate
(DOC), a detergent that is frequently used to solubilize
and further purify SERCA for crystallization [13,14],
some SR membranes fused with each other and were
adsorbed onto the mica surface as lipid bilayer mem-
branes with a thickness of 5.1 ± 0.6 nm [mean ±
standard deviation (SD), N = 23]. These DOC-treated
SR membranes immobilized on the mica surface con-
tained well-separated SERCA, the density of which
was less than a few SERCA molecules per lm
2
, owing
to the partial formation of 2D crystals. These were
used for FSAFM analysis. The quality of the mem-
branes was always ensured by SDS ⁄ PAGE, atomic
force microscopy (AFM), and immunofluorescence
microscopy (Fig. S1A,B, Doc. S1).
The immobilization force in our specimen was
strong enough to minimize the random diffusion of
SERCA molecules, resulting in an averaged 2D diffu-
sion coefficient of 0.4 ± 0.2 nm
2
Æs
)1
(mean ± SD).
Thus, SERCA molecules keep the same position dur-
ing single line scanning [8,15] by FSAFM. This means
that the previously demonstrated single line scanning
(2D) observation technique, which has much higher
time resolution than the normal (3D) observation tech-
nique, is available for short-duration (< 1 s) observa-
tion. However, this immobilization force did not
interfere with the flexible conformational changes of
SERCA molecules in the membrane on the mica sur-
face (for details, see below).
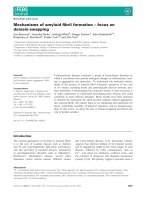
In a buffer solution containing both 10 nm ATP and
100 lm free Ca
2+
, FSAFM captured the motion of
the SERCA molecule (purple dot) embedded in the
single lipid bilayer on mica (Fig. 1A, Movie S1). Up–
down motions and shape changes between taller (com-
pacted) and shorter (open and Y-shaped) forms of
SERCA molecules were clearly evident. The most
straightforward interpretation of these results is that
the height fluctuation and shape changes correspond
to the conformational changes (long-distance move-
ment of the N-domain and rotational motion of the
A-domain) of SERCA during the ATP-mediated ion
transport reaction [14,16–19].
The single line scanning method [8,15], in which an
AFM probe repeatedly scanned on a single line
(along the y-axis direction in Fig. 1B) at a rate of
250–1000 Hz, provided a higher time resolution than
the normal (3D) observation technique (a few frames
per second), and the rapid up–down conformational
changes of SERCAs were repeatedly observed as
sharp peaks (Fig. 1B, black arrowhead). The short-
lived elevated state of SERCA was 2.3 ± 0.4 nm
(mean ± SD, N = 65) taller than the other states.
This elevation value is very similar to the height
difference between the E1Ca
2+
form [14], in which
the N-domain is widely separated from the A-domain
and P-domain, and the other compacted forms of
SERCA (E1ATP, E1P, E2P, and E2) estimated from
3D structural models [14,16–18]. To test this sugges-
tion, the heights of the E1Ca
2+
form (shorter struc-
ture) and the E2 form (one of the taller structures)
were measured. In the buffer solution containing
100 lm free Ca
2+
(with an EGTA-Ca
2+
buffering
system; see Experimental procedures) without any
nucleotide, it was expected that most SERCA would
remain as the ATP-unbound and Ca
2+
-bound
E1Ca
2+
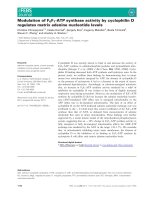
form. In the histogram (Fig. 2A) of the dis-
tribution of the height of the projection of the embed-
ded molecule above the flat membrane surface, the
average height was 5.4 ± 0.8 nm, which is in good
agreement with the height of the cytoplasmic domain
estimated from the X-ray crystallography data of the
E1Ca
2+
form [14]. In the buffer solution containing
10 nm free Ca
2+
without any nucleotide (Fig. 2B),
the addition of 10 lm thapsigargin (TG), which fixes
the enzyme in a form analogous to E2 [16,20,21],
shifted the averaged height to a higher value. The his-
togram of the height difference after incubation with
TG clearly illustrated two peaks near 5.4 ± 0.7 nm
and 7.2 ± 1.0 nm (Fig. 2C). The mean value of the
taller peak (7.2 nm) corresponds well to the height of
the cytoplasmic domain of SERCA in the E2 state
[16]. Although we used purified proteins, some
deformed protein (< 40%), resulting from the sample
preparation procedure or FSAFM scanning, could be
contained. Therefore, some SERCAs that do not
undergo conformational changes at all over the period
of observation in the presence of both ATP and
Ca
2+
were excluded from the following analyses.
Visual characteristics of the Albers–Post scheme
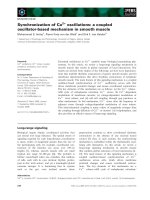
The number of peaks (i.e. the number of up–down
conformational changes of SERCA) per unit time was
dependent on the ATP concentration (Fig. 1B,C). The
number of peaks within 1 s was counted in the pres-
ence of 100 lm free Ca
2+
and various concentrations
(0–100 lm) of ATP, and the data are plotted in
Fig. 3A. The graph shows a clear dependence on ATP
concentration, although only the frequencies at med-
ium (1 lm), extremely high and low ATP concentra-
tions are shown, owing to limitations in experimental
accuracy. The maximum number of conforma-
tional changes of SERCA seen under our experimental
conditions was about 50 s
)1
. These height fluctuations
were only observed in the presence of both ATP and
Ca
2+
, and the motion was strongly inhibited by
Motion of the Ca
2+
-pump captured M. Yokokawa and K. Takeyasu
3026 FEBS Journal 278 (2011) 3025–3031 ª 2011 The Authors Journal compilation ª 2011 FEBS
addition of TG to the buffer solution. Considering the
crystallography data and the fact that, under normal
buffer conditions, the SERCA reaction usually goes in
one direction (catalytic direction) in the Albers–Post
scheme (Fig. S1C) [4,22,23], one peak corresponds to
one catalytic cycle (Ca
2+
-binding shorter conforma-
tion fi ATP hydrolysis-mediated elevated conforma-
tions fi Ca
2+
-binding shorter conformation), and
the number of peaks must correspond to the velocity
of the catalytic cycle of SERCA. Interestingly, the
turnover rate, ATP concentration dependency and TG
inhibition of up–down motion are quite similar to
those of ATPase activity and Ca
2+
uptake reported
previously [24,25]; for example, a conventional bio-
chemical assay showed that the turnover rate of ATP
hydrolysis of SERCA linearly increased with ATP
concentrations of 1 lm [26].
The lifetime of the elevated conformation (i.e. peak
width) in the presence of both ATP and Ca
2+
was
measured in the single line FSAFM images, and
Fig. 1. Single-molecule imaging of SERCA dynamics in the presence of nucleotide and Ca
2+
. (A) Time-lapse sequence FSAFM images of
SERCA in the SR membrane on a mica surface in a buffer solution were obtained in the presence of 10 n
M ATP and 100 lM free Ca
2+
with
192 · 144 pixels at a rate of one frame per second. The images (40 · 40 pixels) presented here were selected from the original data without
any modification. Scale bars: 20 nm. The z-scale is 20 nm. The resulting profiles are shown in the corresponding lower panel. The broken
line indicates a height of 5.5 nm from the membrane surface. (B, C) Single line scan (2D observation) FSAFM images of SERCA were
obtained in the presence of 100 l
M free Ca
2+
and in the presence of 10 nM (B) and 1 lM ATP (C), respectively [scanning rate of 250 Hz,
scan scale of 208 nm (y-axis direction in the FSAFM images), and z-scale of 40.0 nm]. In these FSAFM images, individual SERCA molecules
can be seen as tubular features. The lower panels show the x -axis cross-sections positioned at the line indicated by the arrow beside the
FSAFM images, which represent typical height fluctuations under the conditions used. The x-axis is time and the y-axis is the height of
SERCA. SERCA structures 2–3 nm taller (elevated conformations) and height fluctuations can be seen as the bright (white) sharp signals.
These up–down conformational changes of SERCA were repeatedly observed.
M. Yokokawa and K. Takeyasu Motion of the Ca
2+
-pump captured
FEBS Journal 278 (2011) 3025–3031 ª 2011 The Authors Journal compilation ª 2011 FEBS 3027
plotted as a histogram (Fig. 3B,C). The histogram was
simply fitted to a single-exponential model to obtain
the rate constant of the nucleotide-induced conforma-
tional change: F(t)=C
1
k
1
exp() k
1
t), where F(t)is
the number of elevated conformation with a lifetime t,
C
1
is the number of the total events, and k
1
is the rate
constant. The obtained rate constants (k
1
) were
0.15 ms
)1
at 10 nm ATP and 0.17 ms
)1
at 100 lm
Fig. 2. Histograms of the height differences between the top of
SERCA and the surface of the membrane. Statistical section analy-
ses of SERCA were performed with the data obtained in the pres-
ence of (A) 100 l
M free Ca
2+
(N = 78), (B) 10 nM free Ca
2+
(N = 54), (C) 10 nM free Ca
2+
and 10 lM TG, after 30 min incuba-
tion (N = 82). The lines are Gaussian fits of the height difference
data.
0 4 8 12162024283236
0
20
40
60
80
100
Frequency
Time (ms)
0 4 8 12162024283236
0
20
40
60
80
Frequency
Time (ms)
876543
0
10
20
30
40
50
Number of cycles per s
ATP concentration, –log [ATP] (
M
)
A
B
C
Fig. 3. ATP concentration dependence of the SERCA reaction. (A)
Number of peaks per second with 100 l
M free Ca
2+
and increasing
ATP concentrations in the range 10 n
M to 100 lM. (B, C) Typical
distributions of the lifetime of the elevated conformations of
SERCA in the presence of 100 l
M free Ca
2+
and 10 nM (B) and
100 l
M ATP (C). The histograms were fitted with a single-exponen-
tial function by using the following equation: F(t)=C
1
k
1
exp() k
1
t),
where F(t) is the number of elevated conformation C
1
is the num-
ber of the total events, and k
1
is the rate constant. The rate con-
stants (k
1
) were obtained by the nonlinear least-square curve-fitting
method.
Motion of the Ca
2+
-pump captured M. Yokokawa and K. Takeyasu
3028 FEBS Journal 278 (2011) 3025–3031 ª 2011 The Authors Journal compilation ª 2011 FEBS
ATP, respectively. The rate constant did not depend
on the nucleotide concentration in the range from
10 nm to 100 lm, indicating that the up–down confor-
mational change of SERCA (i.e. the reaction after
ATP binding) did not require further ATP binding or
hydrolysis, and that once a single ATP hydrolysis
reaction started, it was not affected by additional
ATP.
The time courses of height fluctuation in the presence
of a much lower free Ca
2+
concentration and various
ATP concentrations are summarized in Fig. 4A. The
data clearly show that a sharp peak (quick up–down
conformational change of SERCA) was rarely observed
and that the lifetime of the elevated conformation was
apparently increased. The increased lifetime of the ele-
vated conformation at low Ca
2+
concentration could
reasonably be a reflection of lowered ATPase activity at
low Ca
2+
concentrations [25]. Thus, the conformational
change from the elevated conformation to the shorter
conformation was dependent on Ca
2+
concentration.
This means that the transition from elevated to shorter
conformations represented the Ca
2+
-binding-step, the
E1 fi E1Ca
2+
transition, and that the E1 state, which
has not been crystallized, also has an elevated structure.
The elongation time of the elevated state at a low free
Ca
2+
concentration easily explains the Ca
2+
concentra-
tion dependency of the ATPase activity measured by
biochemical experiments [25].
SERCA dynamics under physiological conditions
In a buffer solution containing both 1.0 mm ATP and
100 lm free Ca
2+
, approximating physiological ATP
conditions, SERCA molecules maintained elevated
structures for a long time without up–down motions,
even though the time resolution of FSAFM measure-
ment was increased up to 1000 kHz (Fig. 4B). We note
that the AFM probe stayed on the SERCA for only
50 ls during a single line scan, indicating that our
experimental method can potentially detect short-lived
shorter structures with a time resolution of 50 ls. If
the Albers–Post scheme reaction mechanism can be
applied at higher ATP concentrations, the time
between peaks should be shortened. Actually, this was
true in our experiments up to several 100 lm. How-
ever, it is also notable that, at much higher ATP con-
centrations, we could not detect the shorter form at all
with a time resolution of 50 ls. This fact suggests two
possibilities: one is that the lifetime of the smaller form
is < 50 ls; another is that SERCA does not have a
shorter form under these conditions. As the conforma-
tional change from shorter to elevated structures is
induced by binding of ATP, such a diffusion process
will not be so fast. Furthermore, assuming that the
lifetime of the shorter form is < 50 ls, it becomes dif-
ficult to understand ATPase activity at an even higher
ATP condition (above 1 mm) [24]. It is due to the life-
time of the elevated conformation being independent
of ATP concentration and the average lifetime was in
the order of ms (Figure 3B,C). Therefore, we propose
that SERCA does not have the shorter (E1Ca
2+
) form
at higher ATP concentrations.
In conclusion, at physiological ATP concentrations
(of the millimolar order), SERCA does not transit the
E1Ca
2+
state [14], in which SERCA has the shortest
structure, and has a catalytic pathway different from
the ordinary Albers–Post scheme. This hypothesis is
further supported by previous X-ray crystallographic
Fig. 4. Typical single line scan data obtained with buffer conditions. (A) Representative single line scan graphs obtained at increasing ATP
concentration in the range 0–100 l
M and in the presence of 10 nM and 100 lM free Ca
2+
. (B) Sequential single line scan graphs (which corre-
spond to an observation period of 2 s) in the presence of both 1 m
M ATP and 100 lM free Ca
2+
. The broken lines indicate heights of
5.5 nm and 8.0 nm from the membrane surface.
M. Yokokawa and K. Takeyasu Motion of the Ca
2+
-pump captured
FEBS Journal 278 (2011) 3025–3031 ª 2011 The Authors Journal compilation ª 2011 FEBS 3029
studies [27,28], in which the E2P*-ATP, E2-ATP and
Ca2E1–P-ADP structures were crystallized; SERCA
assumes its compact structure during the whole reaction
cycle under physiological conditions. It is also notable
that many biochemical experiments have shown that
ATP exhibits an additional stimulatory effect on
the reaction cycle at higher ATP concentrations
(> 100 lm) [24], like the Na
+
⁄ K
+
-ATPase [29–31].
Experimental procedures
Materials
All chemicals used in these experiments were of reagent
grade. SR was purified and washed with DOC as described
previously [13,14]. The purified SR and DOC-washed SR
were stored in liquid nitrogen. The protein concentration in
SR was determined with the Bradford protein assay (Bio-
Rad, Hercules, CA, USA) calibrated by quantitative amino
acid analysis. Before use, the stock SR (or DOC-washed
SR) solution was diluted (50 lgÆmL
)1
for SERCA in
75 mm Mops ⁄ KOH, 150 mm KCl, 7.5 mm MgCl
2
, 0.6 mm
CaCl
2
and 0.5 mm EGTA, pH 7.0).
FSAFM observation
Our FSAFM system was developed on the basis of the sys-
tem described by Ando et al. [10]. Details are given in our
previous paper [8]. We used newly developed piezo scan-
ners, the resonance frequencies of which are xy 30 kHz and
z 600 kHz. Small silicon nitride cantilevers were used
(BL-AC7EGS-A2 cantilevers; Olympus, Tokyo, Japan).
Their resonant frequencies in water were 600 kHz, and
the spring constants in water were 0.1–0.2 NÆm
)1
. Each
cantilever had an electron beam deposited probe. The tem-
perature around the scanning area on the sample surface
was estimated to be 40 °C.
A3lL droplet of diluted SR (or DOC-washed SR) solu-
tion was directly applied onto the surface of freshly cleaved
mica (the diameter is 1.0 mm). After incubation for 30 min
at room temperature, the sample was gently washed several
times with the buffer to remove unadsorbed SR and kept in
the same buffer solution until used. FSAFM imaging in tap-
ping mode was performed in the same buffer solution with
or without ATP, CaCl
2
, and TG (the final concentration of
TG was 10 lm). The various CaCl
2
concentrations used to
obtain the required free Ca
2+
concentrations were calculated
with maxc helator (), using
the dissociation constants therein [32].
All FSAFM images were obtained with a scanning speed
of typically one to five frames per second for 3D observa-
tion and 250 Hz or 1000 Hz (lines per second) for 2D
observation. Movie (images) analysis was performed with
imagej ( />Acknowledgements
We thank C. Toyoshima for kindly supplying the puri-
fied SR used in our experiments. We also thank H. Su-
zuki and members of OLYMPUS Corporation for
helpful discussion and much technical advice. This work
was supported by grants from SENTAN, JST to K.
Takeyasu and a Grant-in-Aid for Scientific Research
in Priority Areas ‘Protein community’ (no. 20059018) of
the Ministry of Education, Culture, Sports, Science and
Technology, Japan to M. Yokokawa.
References
1 Berchtold MW, Brinkmeier H & Muntener M (2000)
Calcium ion in skeletal muscle: its crucial role for
muscle function, plasticity, and disease. Physiol Rev 80,
1215–1265.
2 Ohtsuki I & Morimoto S (2008) Troponin: regulatory
function and disorders. Biochem Biophys Res Commun
369, 62–73.
3 Hasselbach W & Makinose M (1961) The calcium
pump of the ‘relaxing granules’ of muscle and its
dependence on ATP-splitting. Biochem Z 333, 518–
528.
4 Kuhlbrandt W (2004) Biology, structure and mechanism
of P-type ATPases. Nat Rev Mol Cell Biol 5 , 282–295.
5 Ebashi S (1963) Third component participating in the
superprecipitation of ‘natural actomyosin’. Nature 200,
1010.
6 Ebashi S & Lipmann F (1962) Adenosine triphosphate-
linked concentration of calcium ions in a particulate
fraction of rabbit muscle. J Cell Biol 14, 389–400.
7 Ebashi S & Kodama A (1965) A new protein factor
promoting aggregation of tropomyosin. J Biochem 58,
107–108.
8 Yokokawa M, Wada C, Ando T, Sakai N, Yagi A,
Yoshimura SH & Takeyasu K (2006) Fast-scanning
atomic force microscopy reveals the ATP ⁄ ADP-
dependent conformational changes of GroEL. EMBO J
25, 4567–4576.
9 Crampton N, Yokokawa M, Dryden DT, Edwardson
JM, Rao DN, Takeyasu K, Yoshimura SH & Hender-
son RM (2007) Fast-scan atomic force microscopy
reveals that the type III restriction enzyme EcoP15I is
capable of DNA translocation and looping. Proc Natl
Acad Sci USA 104, 12755–12760.
10 Ando T, Kodera N, Takai E, Maruyama D, Saito K &
Toda A (2001) A high-speed atomic force microscope
for studying biological macromolecules. Proc Natl Acad
Sci USA 98, 12468–12472.
11 Tanaka M & Sackmann E (2005) Polymer-supported
membranes as models of the cell surface. Nature 437,
656–663.
Motion of the Ca
2+
-pump captured M. Yokokawa and K. Takeyasu
3030 FEBS Journal 278 (2011) 3025–3031 ª 2011 The Authors Journal compilation ª 2011 FEBS
12 Tadini Buoninsegni F, Bartolommei G, Moncelli MR,
Inesi G & Guidelli R (2004) Time-resolved charge trans-
location by sarcoplasmic reticulum Ca-ATPase mea-
sured on a solid supported membrane. Biophys J 86,
3671–3686.
13 Stokes DL & Green NM (1990) Three-dimensional
crystals of CaATPase from sarcoplasmic reticulum.
Symmetry and molecular packing. Biophys J 57, 1–14.
14 Toyoshima C, Nakasako M, Nomura H & Ogawa H
(2000) Crystal structure of the calcium pump of
sarcoplasmic reticulum at 2.6 A resolution. Nature 405,
647–655.
15 Viani MB, Pietrasanta LI, Thompson JB, Chand A,
Gebeshuber IC, Kindt JH, Richter M, Hansma HG &
Hansma PK (2000) Probing protein–protein interactions
in real time. Nat Struct Biol 7, 644–647.
16 Toyoshima C & Nomura H (2002) Structural changes
in the calcium pump accompanying the dissociation of
calcium. Nature 418, 605–611.
17 Toyoshima C & Mizutani T (2004) Crystal structure of
the calcium pump with a bound ATP analogue. Nature
430, 529–535.
18 Toyoshima C, Nomura H & Tsuda T (2004) Lumenal
gating mechanism revealed in calcium pump crystal
structures with phosphate analogues. Nature 432,
361–368.
19 Sorensen TL, Moller JV & Nissen P (2004) Phosphoryl
transfer and calcium ion occlusion in the calcium pump.
Science 304, 1672–1675.
20 Inesi G & Sagara Y (1992) Thapsigargin, a high affinity
and global inhibitor of intracellular Ca
2+
transport
ATPases. Arch Biochem Biophys 298, 313–317.
21 Sagara Y & Inesi G (1991) Inhibition of the sarcoplas-
mic reticulum Ca
2+
transport ATPase by thapsigargin
at subnanomolar concentrations. J Biol Chem 266,
13503–13506.
22 Moller JV, Juul B & le Maire M (1996) Structural
organization, ion transport, and energy transduction of
P-type ATPases. Biochim Biophys Acta 1286, 1–51.
23 de Meis L & Vianna AL (1979) Energy interconversion
by the Ca
2+
-dependent ATPase of the sarcoplasmic
reticulum. Annu Rev Biochem 48, 275–292.
24 Verjovski-Almeida S & Inesi G (1979) Fast-kinetic
evidence for an activating effect of ATP on the Ca
2+
transport of sarcoplasmic reticulum ATPase. J Biol
Chem 254, 18–21.
25 Dode L, Vilsen B, Van Baelen K, Wuytack F, Clausen
JD & Andersen JP (2002) Dissection of the functional
differences between sarco(endo)plasmic reticulum
Ca
2+
-ATPase (SERCA) 1 and 3 isoforms by steady-
state and transient kinetic analyses. J Biol Chem 277,
45579–45591.
26 Dode L, Andersen JP, Raeymaekers L, Missiaen L,
Vilsen B & Wuytack F (2005) Functional comparison
between secretory pathway Ca
2+
⁄ Mn
2+
-ATPase
(SPCA) 1 and sarcoplasmic reticulum Ca
2+
-ATPase
(SERCA) 1 isoforms by steady-state and transient
kinetic analyses. J Biol Chem 280, 39124–39134.
27 Olesen C, Picard M, Winther AM, Gyrup C, Morth JP,
Oxvig C, Moller JV & Nissen P (2007) The structural
basis of calcium transport by the calcium pump. Nature
450, 1036–1042.
28 Jensen AM, Sorensen TL, Olesen C, Moller JV &
Nissen P (2006) Modulatory and catalytic modes of
ATP binding by the calcium pump. EMBO J 25,
2305–2314.
29 Post RL, Hegyvary C & Kume S (1972) Activation by
adenosine triphosphate in the phosphorylation kinetics
of sodium and potassium ion transport adenosine
triphosphatase. J Biol Chem 247, 6530–6540.
30 Clausen JD, McIntosh DB, Anthonisen AN, Woolley
DG, Vilsen B & Andersen JP (2007) ATP-binding
modes and functionally important interdomain bonds
of sarcoplasmic reticulum Ca
2+
-ATPase revealed by
mutation of glycine 438, glutamate 439, and argi-
nine 678. J Biol Chem 282, 20686–20697.
31 Yamamoto T & Tonomura Y (1967) Reaction mecha-
nism of the Ca
++
-dependent ATPase of sarcoplasmic
reticulum from skeletal muscle. I. Kinetic studies.
J Biochem 62, 558–575.
32 Bers DM, Patton CW & Nuccitelli R (1994) A practical
guide to the preparation of Ca
2+
buffers. Methods Cell
Biol 40, 3–29.
Supporting information
The following supplementary material is available:
Doc. S1. Supplementary materials and methods.
Fig. S1. Quality of intact SR and DOC-washed SR.
Movie S1. Single-molecule imaging of the SERCA
dynamics in the presence of nucleotide and calcium
ions.
This supplementary material can be found in the
online version of this article.
Please note: As a service to our authors and readers,
this journal provides supporting information supplied
by the authors. Such materials are peer-reviewed and
may be re-organized for online delivery, but are not
copy-edited or typeset. Technical support issues arising
from supporting information (other than missing files)
should be addressed to the authors.
M. Yokokawa and K. Takeyasu Motion of the Ca
2+
-pump captured
FEBS Journal 278 (2011) 3025–3031 ª 2011 The Authors Journal compilation ª 2011 FEBS 3031