Báo cáo khoa học: Equilibrium distribution of skeletal actin–tropomyosin– troponin states, determined by pyrene–tropomyosin fluorescence potx
Bạn đang xem bản rút gọn của tài liệu. Xem và tải ngay bản đầy đủ của tài liệu tại đây (342.7 KB, 13 trang )
Equilibrium distribution of skeletal actin–tropomyosin–
troponin states, determined by pyrene–tropomyosin
fluorescence
Boris Gafurov
1
and Joseph M. Chalovich
2
1 Uniformed Services University of the Health Sciences, Department of Pharmacology, Bethesda, MD, USA
2 Department of Biochemistry and Molecular Biology, Brody School of Medicine at East Carolina University, Greenville, NC, USA
The ATPase activity of striated muscle myosin is low
unless it is bound to actin. Actin activation is inhibited
by the regulatory proteins tropomyosin, troponin T,
troponin I and troponin C, which bind along actin fila-
ments of skeletal and cardiac muscles. Activation of
striated muscle contraction occurs when Ca
2+
binds to
troponin C, or in a Ca
2+
-independent manner when
rigor-type myosin binds to actin [1–3]. Myosin is both
the target enzyme that hydrolyzes ATP and a potential
allosteric activator. Much current work is devoted to
understanding the structural and functional changes
that occur in the large co-operative system consisting
of myosin, actin, troponin and tropomyosin. Structural
changes in troponin [4] and tropomyosin [5], in
response to either Ca
2+
or myosin subfragment 1 (S1)
binding, have been documented. The structure of actin
is plastic [6] and could also change in response to the
regulatory proteins.
Keywords
parallel pathway model; pyrene
iodoacetamide; regulation of contraction;
tropomyosin; troponin
Correspondence
Joseph M. Chalovich, Department of
Biochemistry and Molecular Biology, Brody
School of Medicine at East Carolina
University, 5E-122 Brody Bldg, Greenville,
NC 27834, USA
Fax: +1 252 7443383
Tel: +1 252 7442973
E-mail:
Website: />Chalov.htm
(Received 11 December 2006, revised 10
February 2007, accepted 1 March 2007)
doi:10.1111/j.1742-4658.2007.05765.x
Actin–tropomyosin–troponin has three structural states, but the functional
properties of regulation can be explained with models having two func-
tional states. As a step towards assigning functional properties to all the
structural states, we examined fluorescent probes that monitor changes in
troponin and tropomyosin. Tropomyosin labeled with pyrene–iodoacetamide
is thought to reflect the transition to the most active state, where-
as N-((2-iodoacetoxy)ethyl)-N-methyl)-amino-7-nitrobenz-2-oxa-1,3-diazole-
labeled troponin I is thought to monitor the transition to any state other
than the inactive state. The fraction of actin in an active state determined
from pyrene excimer fluoresecence agreed with that calculated from light-
scattering measurements of myosin subfragment 1 (S1)–ADP to regulated
actin in both the presence and absence of Ca
2+
over a range of ionic
strength conditions. The only exceptions were conditions where the binding
of S1–ADP to actin was too strong to measure accurately. Pyrene–tropo-
myosin excimer fluorescence was Ca
2+
dependent and so reflected the
change in population caused by both Ca
2+
binding and S1–ADP binding.
Pyrene labeling of tropomyosin did not cause a large perturbation of the
transition among states of regulated actin. Using pyrene–tropomyosin
fluorescence we were able to extend the ionic strength dependence of the
parameters describing the co-operativity of binding of S1–ADP to actin as
low as 0.1 m. The probes on tropomyosin and troponin I had different
responses to Ca
2+
and S1–ADP binding. These different sensitivities can
be explained by an intermediate between the inactive and active states of
regulated actin.
Abbreviations
IANBD, N-(((2-iodoacetoxy)ethyl)-N-methyl)-amino-7-nitrobenz-2-oxa-1,3-diazole; S1, myosin subfragment 1.
FEBS Journal 274 (2007) 2287–2299 ª 2007 The Authors Journal compilation ª 2007 FEBS 2287
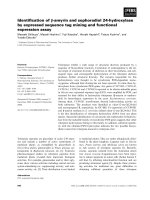
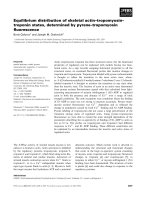
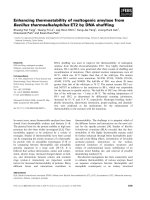
Tropomyosin occupies three positions on actin
(Fig. 1), depending on the amount of Ca
2+
bound to
troponin and to the amount of S1 bound to actin
[7–10]. These three structural states are in rapid equi-
librium with each other [11–13], so that in each condi-
tion there is a distribution of states [8]. Some models
of regulation are constructed around the assumption
that each structural state has a unique function. Other
models use the minimum number of states required to
simulate function. An ongoing question is what are the
properties of these three states and how do they relate
to regulation.
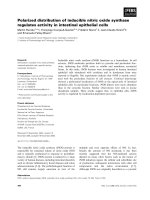
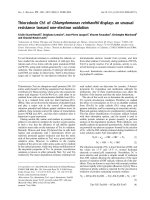
Two types of regulatory models are shown in Fig. 2.
In parallel pathway models (Fig. 2A,B), actin exists in
two or three states, with discrete abilities to serve as
cofactors for myosin-catalyzed ATP hydrolysis. The
relative populations of these actin states are deter-
mined by Ca
2+
and bound S1–ADP. The overall activ-
ity of the system at any condition is defined by the
fraction of time that myosin is bound to each of these
actin states. More detailed schemes of a parallel path-
way model, showing some steps in ATP hydrolysis,
have been published previously [14,15]. The formalism
for a parallel pathway model was originally defined for
two functional states of actin, for simplicity [14,16].
Despite early concerns that a two-state model could
not explain the binding kinetics, it has been shown to
simulate equilibrium binding, binding kinetics and
regulation of ATPase activity correctly [15]. Tropomy-
osin is a switch, in the parallel model, that changes the
structure of actin in some way that alters its ability to
stimulate myosin ATPase activity [17]. Because the
two-state model is able to explain many features of
regulation, the properties of any intermediate state that
may be present are undefined. The potential to define
the intermediate state does exist if it can be observed
in real time.
In sequential models of regulation, actin passes from
state A
B
(blocked) to A
C
(closed) to A
O
(open). In
sequential models, one cannot define the activity of an
individual state. Only state A
O
supports myosin activ-
ity, so it is necessary to go stepwise from the blocked
to the closed to the open states. The model shown in
Fig. 2C is from McKillop & Geeves [18] and is based
on the multiple-step binding of myosin to actin.
Another model, that of Butters & Tobacman, has three
states of actin with different orientations of tropomyo-
sin that are in equilibrium with each other and with a
fourth state, in which actin has undergone a conforma-
tional change to an active state with a structure similar
to that stabilized by the binding of myosin [19]. That
model is not shown here, but it may be imagined as a
funnel in which three states of regulated actin funnel
to an active state that supports contraction.
The models in Fig. 2 share the idea of multiple
forms of regulated actin with different activities in
equilibrium with each other. Changes in the distribu-
1
2
3
4
EGTA Ca
2+
rigor S1 bound
Fig. 1. Cross-sections of actin–tropomyosin–troponin showing the
structural states identified in the absence of Ca
2+
, with saturating
Ca
2+
and with bound rigor-type myosin subfragment 1 (S1). Tropo-
myosin is shown in black. The cross-section of an actin filament is
shown in outline and the orientation of the four subdomains is
shown. The dashed line is for reference. The figure is based on
Craig & Lehman [51].
A
B
A
C
A
O
MA
C
MA
O
MA
R
K
1
K
2
K
1
K
B
K
T
C
MA
i
MA
a
K
1
K
2
A
A
i
A
i(Ca)
A
a
B
α
β
A
i
A
a
Fig. 2. Models of regulation of striated muscle contraction. Actin is
represented by the letter A with a subscript to designate its state;
myosin is represented by the letter M. The large differences in
interactions among different myosin-nucleotide states is not
shown. Panels A and B show two-state and three-state parallel
pathway models. In the two-state version, myosin binds to actin
that is either in the inactive (A
i
) or active (A
a
) state. The distribution
between A
i
and A
a
is determined by the fraction of troponin C
(TnC) sites with bound Ca
2+
and the fraction of actin sites with
bound rigor-type cross-bridges. Rapid ATP hydrolysis occurs when
actin is in state A
a
. The three-state model shown in (B) considers
the possibility that regulated actin that has bound Ca
2+
, but no
rigor-type cross-bridges, has an intermediate level of activity. For
simplicity, the binding to myosin is not shown for this case. In this
model, state A
a
is active and state A
i
is inactive, but the properties
of state A
i(Ca)
, are uncertain. Panel C shows a sequential model in
which there are three states of actin namely blocked (A
B
), closed
(A
C
) and open (A
O
). Actin makes sequential transitions to the open
state, A
O
, which is competent for accelerating ATP hydrolysis and
proceeding into the force-producing state MA
R
.
Distribution of actin–tropomyosin–troponin states B. S. Gafurov and J. M. Chalovich
2288 FEBS Journal 274 (2007) 2287–2299 ª 2007 The Authors Journal compilation ª 2007 FEBS
tion of regulated actin states determine the activity of
actin–myosin, regardless of whether that activity chan-
ges as a normal regulatory response [14,20], or as a
result of some mutations in troponin [21,22] or in
experimentally produced mutations in tropomyosin
[23]. Therefore, it is important to have reliable meth-
ods of determining the state of actin in real time. This
manuscript explores, in detail, a well-known method of
monitoring the state of regulated actin.
The fraction of actin in the active state can be meas-
ured in real time by fluorescence changes of probes on
troponin and tropomyosin. Probes on troponin I
respond to both Ca
2+
binding and to S1–ADP binding.
These probes give a good estimate of the changes in dis-
tribution of regulated actin as S1 or S1–ADP binds to
actin [11,12,24,25]. Resonance energy transfer measure-
ments between probes on actin and troponin I [26] or
troponin T [13] have also proven to be valuable for
measuring the state of the actin filament. Changes in
pyrene–tropomyosin fluorescence have been shown to
be a measure of the fraction of actin in the active state
[27]. Pyrene–tropomyosin excimer fluorescence was
sensitive to activation by S1, but Ca
2+
had little effect
[27,28]. Pyrene–tropomyosin excimer fluorescence did
give the predicted change in regulated actin distribution
as the amount of S1–ADP was altered, but its usefulness
was only demonstrated at relatively high ionic strength.
The response of pyrene–tropomyosin fluorescence to S1
binding led to the idea that this probe measures entry
into the most active state of actin, but is insensitive to
transitions to states of intermediate activity.
We report here a comparison of pyrene–tropomyo-
sin excimer fluorescence to predicted changes in the
actin state that occur in response to Ca
2+
and
S1–ADP binding under conditions ranging from 100
to 240 mm ionic strength. We also compare changes in
pyrene excimer fluorescence with N-(((2-iodoacetoxy)-
ethyl)-N-methyl)-amino-7-nitro benz-2-oxa-1,3-diazole
(IANBD)-labeled troponin fluorescence when both
probes are present on the same actin filament. The
results can be readily explained by the presence of an
intermediate between the inactive and fully active
states of regulated actin. Pyrene excimer formation did
not appreciably affect the distribution of actin states.
Furthermore, pyrene excimer fluorescence gave reason-
able estimates of the distribution of actin states at
ionic strengths as low as 0.1 m, where it may be possi-
ble to correlate these changes with ATPase activities.
Results
Regulated actin is predominantly in the inactive state
in the absence of Ca
2+
and bound S1. Both Ca
2+
and
S1–ADP bind more tightly to the active state of actin
than to the inactive state, and stabilize the active state.
Increasing concentrations of free S1–ADP results in a
co-operative binding curve, indicating a transition
from a lower affinity to a higher affinity state of actin–
tropomyosin–troponin. This change in affinity is read-
ily seen in the absence of Ca
2+
as sigmoidal increases
in theta with increasing free S1–ADP concentrations
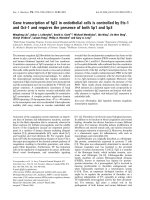
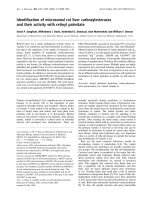
(Fig. 3A–D). Changes in pyrene–actin fluorescence are
often used to measure the binding of S1 to actin
(Fig. 3; solid squares). In order to compare changes in
pyrene–tropomyosin excimer fluorescence with changes
in occupancy of actin with S1, we utilized light scatter-
ing to measure binding (open circles). Light scattering
measurements gave binding patterns that were similar
to previous measurements using pyrene–actin fluores-
cence (compare circles with solid squares). Theoretical
curves, describing the relationship between theta and
free S1–ADP, were produced by fitting the Hill model
to the data at the four ionic strength conditions shown
in Fig. 3. This fitting procedure produced values of
K
1
,K
2
,L¢ and Y. Those parameters were used to pro-
duce theoretical curves for p2, the fraction of actin in
the active state shown by solid curves in Fig. 3.
Figure 3A–D also shows that changes in pyrene–
tropomyosin excimer fluorescence (triangles) followed
the predicted changes in the fraction of actin in the
active state. The agreement between the theoretical
curves and the measurements was particularly good at
higher ionic strengths where the measurements were
most accurate. Deviations between the predicted values
of p2 (solid curve) and the measured value (triangles)
were apparent at 0.1 m ionic strength. Whereas exci-
mer fluorescence (triangles) was low at zero free
S1–ADP, the solid curve predicted from equilibrium
binding data (circles) predicts an excess of 20% of the
actin to be present in the active state. Values of p2
near zero would be consistent with known activities.
That is, the p2 values determined from tropomyosin
fluorescence are probably more reliable than those
calculated from binding studies at low ionic strength.
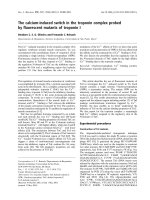
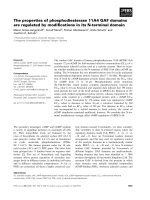
Values of equilibrium binding parameters, deter-
mined in the absence of Ca
2+
as a function of ionic
strength, are shown in Fig. 4A–C. The open symbols
show the present results of binding of S1–ADP to
actin containing troponin and pyrene-labeled tropomy-
osin. Equilibrium binding parameters were calculated
by fitting the Hill formalism to light scattering alone
(circles), or to pyrene–tropomyosin fluorescence alone
(triangles). The values of K
2
shown in Fig. 4A were
independent of the type of fitting used and they agreed
very well with earlier values determined from pyrene–
actin fluorescence shown as solid squares. The model
B. S. Gafurov and J. M. Chalovich Distribution of actin–tropomyosin–troponin states
FEBS Journal 274 (2007) 2287–2299 ª 2007 The Authors Journal compilation ª 2007 FEBS 2289
is not particularly sensitive to values of K
1
, so these
values are not shown.
Figure 4B,C shows the parameters Y and L¢.Y
decreased with increasing ionic strength, indicating a
decreased tendency of adjacent regulatory units to exist
in the same functional state. Values of Y, calculated
from light scattering, were similar to those calculated
from pyrene–tropomyosin fluorescence. However, val-
ues of Y tended to be slightly lower for the pyrene–
tropomyosin system than for the pyrene actin system
examined earlier, shown as solid squares. It is unclear
if this difference is a result of the different probes
used.
Values of L¢ tended to increase with increasing ionic
strength. Therefore, high ionic strength stabilized the
Fig. 3. Changes in light scattering (circles) and pyrene–tropomyosin
fluorescence (triangles) as a function of free myosin subfragment 1
(S1)–ADP concentration in the absence (A–D) and presence (E–H) of
Ca
2+
. Measurements were made at 0.1 (A, E), 0.12 (B, F), 0.18
(C, G) and 0.24 (D, H) molar ionic strengths. The curves shown with
a dashed line are fits of the Hill model to the fraction of actin with
bound S1, determined by light scattering. Curve fitting was per-
formed simultaneously with paired data sets, in the presence and
absence of Ca
2+
, to constrain the variables. Fractions of actin in the
active state, p2, were calculated from the equilibrium binding param-
eters (solid curves). Estimates of p2 determined from pyrene–tropo-
myosin fluorescence (triangles) are also shown. Solid squares are
from a previous study with pyrene actin [15] to show that similar
values of theta are obtained by light scattering measurements and
earlier pyrene-actin measurements. All measurements were made
using skeletal troponin and tropomyosin under the following condi-
tions: 0.3 l
M phalloidin actin, 0.06 lM pyrene-labeled tropomyosin,
0.06 l
M troponin, 25 °C, in a buffer containing 20 mM Mops, pH 7.0,
5m
M MgCl
2
,1mM dithiothreitol, 2 mM ADP, 0.2 mgÆmL
)1
bovine
serum albumin, sufficient KCl to reach the target ionic strength and
either 1 m
M EGTA (A–D) or 0.1 mM CaCl
2
(E–H).
Fig. 4. Effect of ionic strength on equilibrium binding parameters in
the absence (A–C) and presence (D–E) of Ca
2+
. Values of K
2
(A, D),
Y (B, E) and L¢ (C, F), determined by light scattering (circles) and
pyrene-excimer fluorescence (triangles), are compared with earlier
values determined from pyrene–actin fluorescence (solid squares).
Values obtained from light scattering were obtained by a global fit
of the model to data obtained at zero and saturating Ca
2+
. Earlier
values from pyrene–actin fluorescence were the result of a global
fit of data from six different free Ca
2+
concentrations but the same
ionic strength [15]. The conditions were the same as for Fig. 3,
with 1 m
M EGTA used in the experiments with results shown in
panels A–C and 0.1 m
M CaCl
2
used in the experiments with results
shown in panels D–F.
Distribution of actin–tropomyosin–troponin states B. S. Gafurov and J. M. Chalovich
2290 FEBS Journal 274 (2007) 2287–2299 ª 2007 The Authors Journal compilation ª 2007 FEBS
inactive state of regulated actin relative to the active
state when no rigor type S1 was bound to actin. L¢
values were similar when determined by S1–ADP bind-
ing or by tropomyosin–pyrene excimer fluorescence,
and the results were in general agreement with earlier
pyrene–actin fluorescence measurements.
To determine the relationship of K
2
, Y and L¢ to
ionic strength in Ca
2+
, we first determined the effect
of Ca
2+
on fluorescence so that the initial point of p2
could be defined. Figure 5 shows pyrene–tropomyosin
fluorescence measurements of regulated actin as a
function of Ca
2+
concentration at 180 mm ionic
strength. In 0.1 mm EGTA, the free Ca
2+
was below
that required for activation (open circles). The pyrene
fluorescence intensity increased to a maximum value
when Ca
2+
exceeded the EGTA concentration. A con-
trol experiment was performed in the absence of
EGTA (solid circles). As expected, there was no
change in fluorescence with the addition of Ca
2+
because the initial Ca
2+
concentration was already
high enough to give the full effect.
We performed another control by comparing the
effects of Ca
2+
on probes on both tropomyosin and
troponin. Actin filaments were reconstituted with
pyrene-labeled tropomyosin and troponin containing
IANBD-labeled troponin I. Figure 6A shows that the
addition of excess Ca
2+
to an EGTA-containing solu-
tion caused 40% of the maximum possible change in
pyrene–tropomyosin fluorescence, but, on average,
92% of the maximum in IANBD–troponin I fluores-
cence. The complete change of pyrene–tropomyosin
required the addition of nucleotide-free S1. Figure 6B
compares the effect of both probes to the addition of
S1 in the absence of Ca
2+
. Although the changes are
in opposite directions, the sensitivities to S1 concentra-
tion were similar.
Knowing the value of p2 to be 0.4, in the absence of
S1–ADP we were able to examine the relationship
between predicted values of p2 and pyrene excimer
fluorescence in the presence of Ca
2+
. Figure 3E–H
shows light scattering and pyrene excimer fluorescence
at four ionic strength conditions at saturating Ca
2+
.
Values of p2 reached their maximum values at subsat-
urating concentrations of S1–ADP in all cases. The
Fig. 5. The fluorescence of actin filaments reconstituted with
pyrene-labeled tropomyosin is Ca
2+
dependent at 180 mM ionic
strength. Pyrene–tropomyosin fluorescence was measured in the
presence (open circles) or absence (closed circles) of 0.1 m
M
EGTA. The curve obtained in the presence of EGTA shows the
increase in fluorescence as the total Ca
2+
concentration was
increased. The conditions were the same as for Fig. 3.
Fig. 6. Fluorescence changes in pyrene-labeled tropomyosin (cir-
cles, solid lines) and N-(((2-iodoacetoxy)ethyl)-N-methyl)-amino-
7-nitrobenz-2-oxa-1,3-diazole (IANBD)-labeled troponin I (squares,
broken lines) upon titration of actin–tropomyosin–troponin with
Ca
2+
and myosin subfragment 1 (S1). Both fluorescent probes
were present in the actin filament at the same time and the fluor-
escence changes of each probe were measured about 10 min
after each addition of S1. (A) Effect of adding 1.2 m
M Ca
2+
to the
EGTA-containing solution and then subsequently adding S1. The
response to Ca
2+
was more extreme for IANBD–troponin I than
for pyrene-labeled tropomyosin. Multiple lines are from emission
measurements made at 10 nm wavelength increments. (B) Titra-
tion of regulated actin containing both probes with S1 in the
absence of Ca
2+
. The conditions were the same as for Fig. 3, with
150 m
M KCl.
B. S. Gafurov and J. M. Chalovich Distribution of actin–tropomyosin–troponin states
FEBS Journal 274 (2007) 2287–2299 ª 2007 The Authors Journal compilation ª 2007 FEBS 2291
tropomyosin transition measured by pyrene fluores-
cence was not co-operative in the presence of Ca
2+
.
The dashed lines are fits of the Hill model to the val-
ues of light scattering data, and the predicted curves
for p2 are shown as solid lines. The measured values
of p2 were similar to the predicted values. Poor fits to
light scattering data, as in Fig. 3H, were, in part, a
result of the fact that these were not best fits to a sin-
gle data set, but were global fits to data in the presence
and absence of Ca
2+
.
The ionic strength dependencies of K
2
, Y and L¢,
determined by fitting the Hill model to the data of
Fig. 3E–H, are shown in Fig. 4D–F. The agreement of
values of K
2
, Y and L¢ was good between light scatter-
ing (circles) and pyrene–tropomyosin fluorescence (tri-
angles) measured on the same proteins. Values of K
2
were similar to those measured in the absence of
Ca
2+
. Values of Y were near 1 at low ionic strength
and decreased slightly as the ionic strength was raised.
If Y was constrained to be greater than 1, the value of
Y would be 1 over the ionic strength range (data not
shown). Values of L¢, determined by both methods,
increased with increasing ionic strength as they did in
the absence of Ca
2+
.
Values of Y and L¢ were substantially different for
actin filaments containing pyrene-labeled tropomyosin
compared with those with pyrene on the actin. Fitting
was generally more difficult in the presence of Ca
2+
because of the lack of features in those curves. Estima-
tions of L¢ and Y are problematic because changes in
the value of Y can be compensated, to some extent,
for changes in L¢.
The parameter, p2, defines the activity of the actin
filament in parallel pathway models. Under conditions
where all of the S1-ATP is bound to actin, the ATPase
activity is approximately equal to p2*r
max
+
(1 ) p2)*r
min
, where r
max
and r
min
are the rates for the
active and inactive actin species, respectively. A correc-
tion to this equation can be made for the small differ-
ence in affinity of S1-ATP for actin in states 1 and 2.
Values of r
max
and r
min
can be determined from the
k
cat
for actin in the active and inactive states, respect-
ively. Although these ATPase parameters have not
been determined at the conditions used for the binding
experiments, relative changes in ATPase activity
can be approximated by observation of changes in p2.
Figure 7 shows how p2 would change if actin filaments
were activated by the attachment of an activating form
of S1, such as S1–ADP. The inset shows values of p2
as a function of the square root of the ionic strength.
The difference between the EGTA and Ca
2+
rates are
expected to be approximately constant over the range
of ionic strengths examined.
Discussion
Transitions between the inactive and active states of
regulated actin are important determinants of the regu-
lation of striated muscle contraction. The distribution
of these states determines the ATPase activity, whereas
the rates of transitions among the states may affect the
rate of force redevelopment [11]. Some disease-causing
mutations in troponin T change in the distribution
between the states of regulated actin [21,22]. The abil-
ity to measure state transitions rapidly and relate them
to function will be helpful in studying such defects.
Fluorescent probes on troponin and tropomyosin have
the potential to measure the distribution of states in
real time.
Ishii & Lehrer reported that probes on tropomyosin
reflect changes in the fraction of actin in the active
state resulting from S1 binding [27]. Acrylodan-labeled
tropomyosin was useful for actin–tropomyosin, but the
signal was too small in the presence of troponin [29].
Pyrene-labeled tropomyosin was the prefered probe for
actin–tropomyosin and actin–tropomyosin–troponin
[27,28]. Pyrene–iodoacetamide labeling was preferred
over pyrene–maleimide labeling because of the rapid
response of its excimer fluorescence to S1 binding [27].
The S1-induced increase in excimer fluorescence is
caused by an increase in the fraction of pyrene mole-
cules forming excimers. Pyrene–iodoacetamide-labeled
tropomyosin excimer fluorescence exhibited a small
change with Ca
2+
at low ionic strength. Because of
these considerations, we have examined more closely
Fig. 7. Calculated probabilities of actin–tropomyosin–troponin in the
active state (p2) in the presence (solid lines and solid circles) and
absence (dashed line and open circles) of Ca
2+
. Simulations were
made from equilibrium binding parameters determined at 120 m
M
ionic strength. The inset shows how values of p2 in the absence of
added myosin subfragment 1 (S1) change as a function of the
square root of the ionic strength.
Distribution of actin–tropomyosin–troponin states B. S. Gafurov and J. M. Chalovich
2292 FEBS Journal 274 (2007) 2287–2299 ª 2007 The Authors Journal compilation ª 2007 FEBS
the suitability of pyrene–tropomyosin excimer fluores-
cence as a measure of regulated actin state changes.
We studied tropomyosin excimer fluorescence over a
range of ionic strength conditions because ATPase
measurements and S1–ADP binding cannot be readily
measured under the same conditions and an extrapola-
tion of parameters is necessary. Furthermore, examin-
ing the behavior at different conditions increases the
reliability of parameters obtained by curve fitting
[15,21]. Values of the fraction of actin in the active
state, p2, were calculated from S1–ADP binding (light
scattering). Values of p2 were also directly measured
by pyrene excimer fluorescence. Pyrene excimer fluores-
cence generally agreed with the predicted values of p2.
Deviations occurred when S1–ADP binding became
too strong to measure accurately. In those cases, exci-
mer fluorescence was a more reliable measure of p2.
To determine if the energetics of formation of tropo-
myosin–pyrene excimers biased the distribution of
actin states, we compared the present results with ear-
lier studies where binding was measured with pyrene-
labeled actin and unlabeled tropomyosin. Values of L¢
obtained from light scattering measurements with
pyrene-labeled tropomyosin in the absence of Ca
2+
are in reasonable agreement with earlier values where
there was no excimer formation (Fig. 4). Pyrene probes
on tropomyosin did not significantly alter the values of
K2, L¢ or Y at any ionic strength examined. Further-
more, when troponin containing an IANBD probe on
troponin I was reconstituted with N-(1-pyrene)iodo-
acetamide (pyrene–iodoacetamide)-labeled tropomyosin
and actin, the IANBD probe retained its typical
responses to changes in Ca
2+
and S1 binding (Fig. 6).
Fitting binding curves to obtain binding parameters
is difficult in the case of Ca
2+
because the curves are
featureless hyperbolas. Although we observed only
small differences in binding curves measured with
pyrene–actin and pyrene–tropomyosin in Ca
2+
(Fig.
3G–H), there was poor agreement between the values of
L¢ calculated in the two cases. We also noted that at
low ionic strength the values of Y tended to be greater
in the presence of Ca
2+
, but this was not observed in
the present case with unlabeled actin. It is also worth
pointing out that the parameters determined in our
earlier study with pyrene–actin resulted from global fits
of the data. This change in fitting may contribute to
differences in the final values of the parameters.
The parameters K2, L¢ and Y varied with ionic
strength, in agreement with our earlier observations
[15,21]. High ionic strength decreased the fraction of
regulated actin in active states (increased L¢). This
result is consistent with in vitro motility assays where
higher Ca
2+
is required for full activation at high ionic
strength [30]. This trend has now been observed from
0.1 to 0.24 m ionic strength. The extension of this
result to the lower ionic strength range is useful for
extrapolation of the values for future simulation of
ATPase activities under conditions where they can be
readily measured.
Tropomyosin excimer fluorescence was Ca
2+
dependent, but it did not directly track Ca
2+
binding.
Rather, the change was consistent with a state change,
such as partial transition, to the most active state of
actin or a total transition to an intermediate state.
Ca
2+
binding resulted in % 40% of the maximum
observed change of excimer fluorescence obtained with
full activation by rigor-type myosin binding. This
agrees with the observation of Williams et al., that
Ca
2+
alone provides 40% of the maximum value of
k
cat
[31].
In vitro motility assays support the view that Ca
2+
alone does not provide full activation of regulated
actin. High levels of loading of filaments with myosin
produced about a doubling of the rate at saturating
Ca
2+
[32] and a velocity 1.8 times higher than that of
unregulated actin [33]. Activities that exceed actin
alone are probably the result of partial stabilization of
the most active state of regulated actin. In the case of
cardiac troponin–tropomyosin, this extra activation
was only evident for some disease-causing mutations
of troponin [34]. Under those conditions, the velocity
was increased 1.6-fold over full activation of the wild-
type cardiac troponin. Some mutations have the effect
of partially stabilizing the fully active state [21], so this
1.6-fold increase is probably an underestimate of the
maximum level of activation. These results suggest that
in the motility assay, Ca
2+
alone produces 50–55% of
the maximum activation. The results could be closer to
the 40% activation seen in solution for Ca
2+
alone if
the actin filaments in the in vitro studies were not max-
imally activated.
The ability of S1–ADP and rigor S1 to activate
actin filaments raises the question of how an active
muscle can relax once the free Ca
2+
concentration is
decreased. A larger fraction of strongly bound cross-
bridges is required for activation in EGTA than in
Ca
2+
. However, in EGTA at 0.18 m ionic strength,
30% saturation of the actin produces thin filaments
that are 50% active (Fig. 3C). A 90% relaxation
would require less than 5% of the actin to contain
strongly bound cross-bridges. However, muscle may
not behave identically to the proteins in solution.
Geometrical considerations, and the presence of
other protein components or small molecules, could
result in a considerable shift of the curves shown in
Fig. 3.
B. S. Gafurov and J. M. Chalovich Distribution of actin–tropomyosin–troponin states
FEBS Journal 274 (2007) 2287–2299 ª 2007 The Authors Journal compilation ª 2007 FEBS 2293
Probes on troponin I report changes in the state of
regulated actin caused by S1 binding to actin [12] and
also respond directly to changes in Ca
2+
[12,24,25].
Different sensitivities of fluorescent probes to Ca
2+
have been used in the past to argue for the presence of
an intermediate state of regulated actin. Because the
probes can affect the behavior of the regulatory com-
plex, it is difficult to compare directly the results of
probes on separate regulatory complexes. We have
now utilized IANBD on troponin I and pyrene on
tropomyosin within the same regulatory complex. Both
probes responded to S1 binding in a similar way
(Fig. 6A), but exhibited different responses to Ca
2+
(Fig. 6B). This result is consistent with the existence of
an intermediate structural state [7].
We used the two-state parallel pathway model of
Hill et al. for predicting the fraction of actin in the act-
ive state. That model is consistent with the measured
effects of Ca
2+
on binding in the presence of ATP
[35,36], equilibrium binding in the presence of ADP
[16], binding kinetics [15,37] and the general features
of ATPase activities [14]. Furthermore, in our view,
the functionally indistinguishable state is not the first
state of a series, but rather the state corresponding to
bound Ca
2+
and no bound rigor S1 (A
i(Ca)
in Fig. 2B).
That intermediate may resemble the inactive (A
i(EGTA)
)
or fully active (A
a
) states in terms of key functional
properties.
Although our results can be explained with two
functional states, there is evidence for three structural
states of regulated actin. Pirani et al. estimated the dis-
tributions of structural states by image reconstruction
of electron micrographs following dilution of the pro-
teins to low ionic strength [8]. They predicted 22% of
the actin to be in the closed state in the absence of
Ca
2+
[8]. Because the actin filament is has little activ-
ity in EGTA [31], the closed state must be inactive.
Pirani et al. predicted the distribution in Ca
2+
to be
20% blocked, 68% closed and 12% M state (active
state). The 40% activation, predicted in the present
study, from tropomyosin fluorescence does not agree
with this distribution. This could be an indication that
there is not a simple correlation between observed struc-
tural states and functional states of regulated actin.
We also evaluated our results in terms of the three-
state sequential model of regulation proposed by
McKillop & Geeves [18], as shown in Fig. 2C. The
increased rate of binding of S1–ADP to regulated actin
in Ca
2+
compared with EGTA was interpreted, in that
model, as 75% of actin sites being blocked in the
absence of Ca
2+
. We have an alternative explanation
for that effect [37]. However, for the present exercise
we forced the fit to populate the blocked state in
EGTA in accordance with their model. We used
most of the constraints set by McKillop & Geeves,
namely, 0 < KB < 10, 0 < KT < 20, 0 < N < 7,
10
3
<K1<10
6
and K2 ¼ 200. We did not constrain
the values of ‘n’ and we consequently obtained a dif-
ferent pattern of changes in this parameter. The simu-
lations shown in Fig. 8 demonstrate that populations
of both the blocked and closed states decreased with
increasing amounts of bound S1 in both the absence
and presence of Ca
2+
. The population of the open
state was much higher in Ca
2+
than in EGTA in the
absence of bound S1. Regulated actin was almost
exclusively in the open state at saturating S1, irrespect-
ive of the Ca
2+
concentration. Whereas the population
of the open state does not correlate directly with our
predicted p2, they do follow the same trend.
Tropomyosin–pyrene excimer fluorescence gives a
good estimate of the fraction of actin in the active
state over a range of conditions. Simultaneous mea-
surements of probes on tropomyosin and troponin
give evidence for an intermediate state. By taking
further advantage of this system, it may be possible to
determine the role of this intermediate in regulation.
Fig. 8. Distribution of the blocked (circles),
closed (triangles) and open (squares) states
in the course of myosin subfragment 1 (S1)
binding. (A) The predicted occupancy of the
states at 0.18
M ionic strength in the pres-
ence of 0.1 m
M Ca
2+
. The diamonds are the
p2 parameter that represents the transition
of the actin filament into the active state in
Hill’s model. (B) The same parameters in
the Ca
2+
-free case.
Distribution of actin–tropomyosin–troponin states B. S. Gafurov and J. M. Chalovich
2294 FEBS Journal 274 (2007) 2287–2299 ª 2007 The Authors Journal compilation ª 2007 FEBS
This is particularly important for the study of disor-
ders of the regulatory system.
Experimental procedures
Protein preparation
Actin [38,39], myosin [40], troponin and tropomyosin [41]
were isolated from rabbit back muscle. Myosin S1 was
made by digestion of myosin with chymotrypsin [42]. Pro-
tein concentrations were determined by light absorbance at
280 nm, corrected for scattering, at 340 nm, using the fol-
lowing extinction coefficients (e
0.1%
) for 280 nm: actin,
)1.15; myosin-S1, )0.75; tropomyosin, )0.33; and troponin,
)0.37. The molecular masses assumed for the key proteins
were: actin, )42 000 Da; myosin-S1, )120 000 Da; tropo-
myosin, )68 000 Da; troponin, )71 000 Da.
Actin was stored as a 40 lm stock in 4 mm imidazole
(pH 7.0), 1 mm dithiothreitol, 2 mm MgCl
2
and 40 lm
phalloidin. Actin was sometimes labeled with N-(1-pyrenyl)
iodoacetamide [43]. Tropomyosin was labeled with
N-(1-pyrene)iodoacetamide (pyrene–iodoacetamide) [27]. In
some cases, troponin I was labeled with IANBD [12]. The
extents of labeling were % 60% and 35% for tropomyosin
and troponin, respectively. Reconstituted actin was pre-
pared by mixing actin with troponin and pyrene-labeled
tropomyosin in a 3 : 1 : 1 molar ratio to ensure saturation
of actin at the low concentrations used for binding studies.
Equilibrium fluorescence measurements
Equilibrium fluorescence measurements were made on an
Aminco Bowman II Luminescence Spectrometer (Thermo
Electron Corp., Madison, WI, USA), having the cell com-
partment maintained at 25 °C with a circulating water bath.
For light scattering measurements, the excitation and emis-
sion monochrometers were set at the same wavelength. Exci-
tation and emission wavelengths used were 340 and 480 nm,
respectively, for tropomyosin–pyrene excimer fluorescence
and 492 and 536 nm, respectively, for IANBD–troponin
fluorescence.
Equilibrium titrations of actin with S1–ADP were per-
formed by observing the light scattering, pyrene–tropomyo-
sin fluorescence [44] and by quenching of pyrene–actin
fluorescence [43,45,46]. Details of the binding measurements
are described elsewhere [15] and are similar to those des-
cribed by others [46,47]. Our binding solutions contained
20 mm Mops, pH 7.0, 5 mm MgCl
2
,1mm dithiothreitol,
2mm ADP, 0.2 mgÆmL
)1
bovine serum albumin, sufficient
KCl to reach the target ionic strength and 0.1 mm CaCl
2
or
1mm EGTA. The actin concentration in binding experi-
ments was 0.3 lm. Solutions also contained 14 unitsÆmL of
hexokinase and 1 mm glucose to scavenge ATP and 20 lm
Ap5A to inhibit ATP formation through the myokinase reac-
tion. Titrations were carried out by the stepwise addition of
S1 to a 2 mL volume of pyrene-labeled actin–tropomyosin–
troponin at 5 min intervals. This time interval was important
to ensure equilibrium at each step. Fluorescence intensities
and protein concentrations were corrected for the volume
change (< 10%) caused by adding S1. Rabbit skeletal tropo-
nin and tropomyosin were used in this study for comparison
with our existing data for those regulatory proteins.
Values of theta (S1 bound to the actin total ratio) and
the free S1 concentration from fluorescence or light scatter-
ing measurements were calculated using the equations:
h ¼
F
i
À F
min
F
max
À F
min
½FreeS1¼½S1
total
À h ýActin
total
ð1Þ
Where F
i
is the fluorescence or scattering intensity at a total
S1 concentration of i (lm); and F
max
and F
min
are the maxi-
mum and minimum values of intensity, respectively.
Modeling experimental results
Light scattering was used to measure the binding of S1–
ADP to actin and tropomyosin. Pyrene excimer fluorescence
was used to monitor the fraction of actin in the active state.
Equilibrium-binding parameters were extracted from light
scattering data by using the co-operative binding model of
Hill et al. [16] or by the model of McKillop & Geeves [18].
Fitting to the parallel pathway model of Hill was described
in detail earlier [15]. Briefly, the relationship between the
fraction of actin with bound S1 and the free S1 concentra-
tion can be described by the following equations [16]:
h ¼ p
1
h
1
þ p
2
h
2
h
i
¼
K
i
C
1 þ K
i
C
p
1
¼ 1 À p
2
p
2
¼
2a
Y
ffiffiffiffiffiffiffiffiffiffiffiffiffiffiffiffiffiffiffiffiffiffiffiffiffiffiffiffi
ð1 À aÞ
2
þ 4
a
Y
q
1 À a þ
ffiffiffiffiffiffiffiffiffiffiffiffiffiffiffiffiffiffiffiffiffiffiffiffiffiffiffiffi
ð1 À aÞ
2
þ 4
a
Y
q
a ¼
ð1 þ K
2
CÞ
n
ð1 þ K
1
CÞ
n
Y
22
ðqÞ
LY
11
ðqÞ
L
0
¼
LY
11
ðqÞ
Y
22
ðqÞ
Y ¼
Y
11
ðqÞY
22
ðqÞ
Y
12
ðqÞY
21
ðqÞ
Y
ij
ðqÞ¼x
ij
þ 2k
a
qy
ij
þ k
2
b
q
2
z
ij
9
>
>
>
>
>
>
>
>
>
>
>
>
>
>
>
>
>
>
>
>
>
>
>
>
>
>
>
>
>
>
>
=
>
>
>
>
>
>
>
>
>
>
>
>
>
>
>
>
>
>
>
>
>
>
>
>
>
>
>
>
>
>
>
;
ð2Þ
p
1
and p
2
are fractions of actin units in the inactive and
active states, respectively; h
I
and h
2
are fractions of actin
containing bound S1 in the inactive and active states,
respectively; K
1
and K
2
are S1-binding constants to the
B. S. Gafurov and J. M. Chalovich Distribution of actin–tropomyosin–troponin states
FEBS Journal 274 (2007) 2287–2299 ª 2007 The Authors Journal compilation ª 2007 FEBS 2295
inactive and active states of actin, respectively; C is the free
S1 concentration; q is the free Ca
2+
concentration; n is
the number of actin monomers in one actin–tropomyosin–
troponin unit (assumed to be seven); L is the equilibrium
constant for transition of an isolated actin–tropomyosin–
troponin unit with no neighbors, no bound Ca
2+
and no
bound S1 from state 2 to state 1; L¢ is the equilibrium con-
stant defining the transition from the active state to the
inactive state for the entire actin filament, but without S1;
Y describes the co-operativity between adjacent regulatory
units of seven actin monomers; Y is the overall co-operativ-
ity parameter; Y
ij
are individual co-operative interactions
between units in states i and j (we assumed that Y
ij
¼ Y
ji
);
x
ij
, y
ij
and z
ij
represent the free energies of nearest neighbor
tropomyosin interactions (W
ij
) in exponential form e
–Wij ⁄ kT
[16]; and k
a
and k
b
are affinities of troponin in states 1 and
2 for Ca
2+
with values of % 10
5
and 10
6
Æm
)1
, respectively
[48]. We assumed that the values of k
a,b
did not change
over the ionic strength range in this study. The simulated
curves were not very sensitive to the value of K
1
, so simula-
tions were normally carried out with the assumption that
K
1
¼ K
2
⁄ 8 [49].
All measurements were carried out in both Ca
2+
-free
and in Ca
2+
-saturated conditions. Binding data obtained at
high and low Ca
2+
, but at the same ionic strength, were
analyzed using a global fit procedure [15]. The global fit
helped to constrain the parameters. Values of L¢, K
2
and Y
obtained from the fits were used to simulate p
2
, the fraction
of actin in the active state. We also fitted theoretical values
of p
2
to the tropomyosin fluorescence to obtain L¢, K
2
and
Y. From those values we were able to calculate curves of h
as a function of free S1–ADP.
Tropomyosin fluorescence was normalized from 0 to 1 in
the absence of Ca
2+
because we assumed that essentially
none of the actin was in the active state in the absence of
Ca
2+
and bound S1. This assumption is reasonable based on
ATPase activity measurements. The flux is proportional to
the amount of S1 bound to each state multiplied by the k
cat
associated with that state. Ca
2+
increases the k
cat
by
% 22-fold [20], whereas the binding of NEM-S1 increases the
k
cat
by a further 2.5-fold [31]. This means that the fraction in
the active state in EGTA is 1.8%. Binding studies were car-
ried out at higher ionic strength conditions than the ATPase
measurements. Because the fraction of actin in the active
state decreases with increasing ionic strength [15], the value
of 1.8% is an upper limit. The ATPase rates also predict that
in the presence of Ca
2+
alone, 40% of the regulated actin is
in the active state. Again, this fraction is also likely to be an
upper limit because of ionic strength considerations.
In order to define the fraction of actin in the active state
in the presence of Ca
2+
, but in the absence of bound S1,
we observed the changes in fluorescence that occurred dur-
ing Ca
2+
titrations. With measured values of the initial
value in EGTA, the change that occurred with the addition
of Ca
2+
and the further change that occurred with satur-
ating S1–ADP, we were able to calculate the initial p2 in
Ca
2+
. The fluorescence data in Ca
2+
were normalized from
this initial value to 1.0 for the maximum fluorescence
observed in the presence of both Ca
2+
and saturating
S1–ADP. Although the initial raw fluorescence values were
higher in Ca
2+
than in EGTA, the values at saturating S1
were about the same in both cases.
Fitting parameters and constraints were similar to the
ones used in our earlier work [15]. Global fitting was per-
formed in the mlab Modeling System (Civilized Software,
Bethesda, MD, USA) and always produced reasonable fits
with correlation coefficients R
2
> 0.85.
Analysis using the model of McKillop & Geeves
Because the original two-state parallel pathway model of
Hill was able to account for the present data, the model was
not expanded to include a third state. We did, however, ana-
lyze some of these data with the three-state sequential model
of McKillop & Geeves [18], shown in Fig. 2C. We fitted the
model expressed in Eqn (3) to our binding isotherms and
obtained key binding parameters K
1
, K
2
, K
B
, K
T
and n for
each ionic strength and Ca
2+
concentration used:
h ¼
K
1
cðK
T
ð1 þ K
2
ÞP
nÀ1
ÞþQ
nÀ1
K
T
P
n
þ Q
n
þ 1=K
B
ð3Þ
P ¼ 1 þ K
1
cð1 þ K
2
Þ
Q ¼ 1 þ K
1
c
where K
1
and K
2
are S1-binding constants, K
B
is the equi-
librium constant for proceeding from the blocked to the
closed state, K
T
is the equilibrium constant for proceeding
from the closed state to the open state, and n is a number
of actin monomers forming a co-operative unit. We used
constraints similar to those described elsewhere [15,50].
We determined the occupancy of the various states as a
function of S1 bound by using differential equations to des-
cribe the probability for each state [37]. Curve fitting was
carried out to our binding isotherms at 180 mm ionic
strength, measured with or without Ca
2+
. The 3 · 3 scheme
of the kinetic reactions, which take place when n ¼ 1, is
shown below, as derived previously [37]:
1
2
4
3
56
a
B
a
-B
ck
1
k
-1
a
T
a
-T
ck
1
k
-1
a
T
a
-T
k
2
k
-2
Scheme 1.
Distribution of actin–tropomyosin–troponin states B. S. Gafurov and J. M. Chalovich
2296 FEBS Journal 274 (2007) 2287–2299 ª 2007 The Authors Journal compilation ª 2007 FEBS
where K
1
¼ k
1
⁄ k
)1
,K
2
¼ k
2
⁄ k
)2
,K
B
¼ a
B
⁄ a
)B
, and K
T
¼
a
T
⁄ a
)T
. Differential equations, describing these kinetic reac-
tions, are given below:
p
0
1
½t¼Àa
B
à p
1
½tþa
ÀB
à p
2
½t
p
0
2
½t¼a
B
à p
1
½tÀða
ÀB
þ k
1
à c þ a
T
ÞÃp
2
½tþk
À1
à p
3
½t
þ a
ÀT
à p
4
½t
p
0
3
½t¼k
1
à c à p2½tÀðk
À1
þ a
T
ÞÃp
3
½tþa
ÀT
à p
5
½t
p
0
4
½t¼a
T
à p
2
½tÀða
ÀT
þ k
1
à cÞÃp
4
½tþk
À1
à p
5
½t
p
0
5
½t¼a
T
à p
3
½tþk
1
à c à p
4
½tÀða
ÀT
þ k
À1
þ k
2
ÞÃp
5
½t
þ k
À2
à p
6
½t
p
0
6
½t¼k
2
à p
5
½tÀk
À2
à p
6
½t
c ¼ c
S1
À c
A
Ãðp
3
½tþp
5
½tþp
6
½tÞ; ð4Þ
where c
S1
and c
A
are S1 and actin concentrations, respec-
tively. Reverse rates of the reactions k
)1
,k
)2
,a
)T
, and
a
)B
were assumed from Chen et al. [37], and forward
rates were calculated from K
1
,K
B
and K
T
, obtained previ-
ously (Fig. 8). We used mathematica 4.0 (Wolfram
Research, Inc., Champaign, IL, USA) to find a numerical
solution to the differential equations using the following
initial conditions: p
1
(0) ¼ 1 ⁄ [1 + K
B
(1 + K
T
)], p
2
(0) ¼
K
B
⁄ [1 + K
B
(1 + K
T
)], p
4
(0) ¼ K
B
K
T
⁄ [1 + K
B
(1 + K
T
)],
and other p
i
(0) ¼ 0, so that Sp
i
(0) ¼ 1. The calculations
were continued for a period of time sufficient for the state
to reach equilibrium, as defined by a lack of change in any
of the states with time. At equilibrium the fractions of the
blocked, closed and open states are given as follows,
respectively: Blocked ¼ p
1
, Closed ¼ p
2
+p
3
, Open ¼
p
4
+p
5
+p
6
. We solved these equations at a series of S1
concentrations to obtain the occupancy of the states as a
function of S1 bound.
Equation 4 describes the situation with saturating Ca
2+
where modeling our data at 180 mm ionic strength and
saturating Ca
2+
gave n ¼ 1. We determined the value
of n to be 5 in the absence of Ca
2+
. Thus, the kinetic
scheme became more complex and yielded 28 differential
equations (see detailed method in [37]). We solved these 28
differential equations varying S1 (c
S1
) and found occu-
pancies as follows: p
1
¼ Blocked, p
2
+p
3
+ +p
7
¼
Closed, p
8
+p
9
+ +p
28
¼ Open.
Acknowledgements
We thank Ms Tamatha Baxley for expert technical
assistance and Drs Mechthild M. Schroeter and Mohit
Mathur for critical reading of this manuscript. This
work was supported by funds from the National Insti-
tutes of Health (grant AR40540 to JMC).
References
1 Bremel RD, Murray JM & Weber A (1972) Manifesta-
tions of cooperative behavior in the regulated actin
filament during actin-activated ATP hydrolysis in the
presence of calcium. Cold Spring Harbor Symp Quant
Biol 37, 267–275.
2 Lehrer SS & Morris EP (1982) Dual effects of
tropomyosin and troponin-tropomyosin on
actomyosin subfragment 1 ATPase. J Biol Chem 257,
8073–8080.
3 Murray JM, Knox MK, Trueblood CE & Weber A
(1982) Potentiated state of the tropomyosin actin fila-
ment and nucleotide-containing myosin subfragment 1.
Biochemistry 21, 906–915.
4 Takeda S, Yamashita A, Maeda K & Mae
´
da Y (2003)
Structure of the core domain of human cardiac troponin
in the Ca
2+
-saturated form. Nature 424, 35–41.
5 Xu C, Craig R, Tobacman L, Horowitz R & Lehman
W (1999) Tropomyosin positions in regulated thin fila-
ments revealed by cryoelectron microscopy. Biophys J
77, 985–992.
6 Egelman EH (2001) Actin allostery again? Nat Struct
Biol 8, 735–736.
7 Vibert P, Craig R & Lehman W (1997) Steric-model for
activation of muscle thin filaments. J Mol Biol 266,
8–14.
8 Pirani A, Xu C, Hatch V, Craig R, Tobacman LS &
Lehman W (2005) Single particle analysis of relaxed
and activated muscle thin filaments. J Mol Biol 346,
761–772.
9 Hai H, Sano K, Maeda K, Maeda Y & Miki M (2002)
Ca
2+
- and S1-induced conformational changes of recon-
stituted skeletal muscle thin filaments observed by fluor-
escence energy transfer spectroscopy: structural evidence
for three States of thin filament. J Biochem (Tokyo)
131, 407–418.
10 Poole KJV, Lorenz M, Evans G, Rosenbaum G, Pirani
A, Craig R, Tobacman LS, Lehman W & Holmes KC
(2006) A comparison of muscle thin filament models
obtained from electron microscopy reconstructions and
low-angle X-ray fibre diagrams from non-overlap mus-
cle. J Struct Biol 155, 273–284.
11 Brenner B & Chalovich JM (1999) Kinetics of thin fila-
ment activation probed by fluorescence of N-(2-(Iodoa-
cetoxy) ethyl)-N-methyl) amino-7-nitrobenz-2-oxa-1,
3-diazole-labeled troponin I incorporated into skinned
fibers of rabbit psoas muscle: implications for regulation
of muscle contraction. Biophys J 77, 2692–2708.
12 Trybus KM & Taylor EW (1980) Kinetic studies of the
cooperative binding of subfragment 1 to regulated actin.
Proc Natl Acad Sci USA 77, 7209–7213.
13 Shitaka Y, Kimura C & Miki M (2005) The rates of
switching movement of troponin T between three states
of skeletal muscle thin filaments determined by fluores-
cence resonance energy transfer. J Biol Chem 280,
2613–2619.
14 Hill TL, Eisenberg E & Chalovich JM (1981) Theoreti-
cal models for cooperative steady-state ATPase activity
B. S. Gafurov and J. M. Chalovich Distribution of actin–tropomyosin–troponin states
FEBS Journal 274 (2007) 2287–2299 ª 2007 The Authors Journal compilation ª 2007 FEBS 2297
of myosin subfragment-1 on regulated actin. Biophys J
35, 99–112.
15 Gafurov B, Chen YD & Chalovich JM (2004) Ca
2+
and ionic strength dependencies of S1-ADP binding to
actin-tropomyosin-troponin: regulatory implications.
Biophys J 87, 1825–1835.
16 Hill TL, Eisenberg E & Greene LE (1980) Theoretical
model for the cooperative equilibrium binding of myo-
sin subfragment 1 to the actin-troponin-tropomyosin
complex. Proc Natl Acad Sci USA 77, 3186–3190.
17 Resetar AM, Stephens JM & Chalovich JM (2002) Tro-
ponin-tropomyosin: an allosteric switch or a steric
blocker? Biophys J 83, 1039–1049.
18 McKillop DFA & Geeves MA (1993) Regulation of the
interaction between actin and myosin subfragment 1:
Evidence for three states of the thin filament. Biophys J
65, 693–701.
19 Butters CA, Tobacman JB & Tobacman LS (1997)
Cooperative effect of calcium binding to adjacent tropo-
nin molecules on the thin filament-myosin subfragment
1 Mg ATPase rate. J Biol Chem 272, 13196–13202.
20 Chalovich JM & Eisenberg E (1982) Inhibition of acto-
myosin ATPase activity by troponin-tropomyosin with-
out blocking the binding of myosin to actin. J Biol
Chem 257, 2432–2437.
21 Gafurov B, Fredricksen S, Cai A, Brenner B, Chase PB
& Chalovich JM (2004) The Delta14 mutation of
human cardiac troponin T enhances ATPase activity
and alters the cooperative binding of S1-ADP to regu-
lated actin. Biochemistry 43, 15276–15285.
22 Burhop J, Rosol M, Craig R, Tobacman LS & Lehman
W (2001) Effects of a cardiomyopathy-causing troponin
T mutation on thin filament function and structure.
J Biol Chem 276, 20788–20794.
23 Kimura C, Maeda K, Hai H & Miki M (2002)
Ca
2+
- and S1-induced movement of troponin T on
mutant thin filaments reconstituted with functionally
deficient mutant tropomyosin. J Biochem (Tokyo)
132, 345–352.
24 Greene LE (1986) Cooperative binding of myosin sub-
fragment one to regulated actin as measured by fluores-
cence changes of troponin I modified with different
fluorophores. J Biol Chem 261, 1279–1285.
25 Brenner B, Kraft T, Yu LC & Chalovich JM (1999)
Thin filament activation probed by fluorescence of
N-(2-(Iodoacetoxy) ethyl)-N-methyl) amino-7-nitrobenz-
2-oxa-1,3-diazole-labeled troponin I incorporated into
skinned fibers of rabbit psoas muscle. Biophys J 77,
2677–2691.
26 Miki M & Iio T (1993) Kinetics of structural changes of
reconstituted skeletal muscle thin filaments observed by
fluorescence resonance energy transfer. J Biol Chem 268,
7101–7106.
27 Ishii Y & Lehrer SS (1990) Excimer fluorescence of pyr-
enyliodoacetamide-labeled tropomyosin: a probe of the
state of tropomyosin in reconstituted muscle thin fila-
ments. Biochemistry 29, 1160–1166.
28 Geeves MA & Lehrer SS (1994) Dynamics of the muscle
thin filament regulatory switch: the size of the coopera-
tive unit. Biophys J 67, 273–282.
29 Lehrer SS & Ishii Y (1988) Fluorescence properties of
acrylodan-labeled tropomyosin and tropomyosin-actin:
Evidence for myosin subfragment 1 induced changes in
geometry between tropomyosin and actin. Biochemistry
27, 5899–5906.
30 Gordon AM, LaMadrid MA, Chen Y, Luo Z & Chase
PB (1997) Calcium regulation of skeletal muscle thin
filament motility in vitro. Biophys J 72, 1295–1307.
31 Williams DL Jr, Greene LE & Eisenberg E (1988)
Cooperative turning on of myosin subfragment 1 adeno-
sine triphosphatase activity by the troponin-tropomyo-
sin-actin complex. Biochemistry 27, 6987–6993.
32 Gorga JA, Fishbaugher DE & VanBuren P (2003) Acti-
vation of the calcium-regulated thin filament by myosin
strong binding. Biophys J 85, 2484–2491.
33 Homsher E, Nili M, Chen IY & Tobacman LS (2003)
Regulatory proteins alter nucleotide binding to acto-
myosin of sliding filaments in motility assays. Biophys J
85, 1046–1052.
34 Ko
¨
hler J, Chen Y, Brenner B, Gordon AM, Kraft T,
Martyn DA, Regnier M, Rivera AJ, Wang C-K &
Chase PB (2003) Familial hypertrophic cardiomyo-
pathy mutations in troponin I (K183D, G203S,
K206Q) enhance filament sliding. Physiol Genomics
14, 117–128.
35 Chalovich JM, Chock PB & Eisenberg E (1981)
Mechanism of action of troponin-tropomyosin:
inhibition of actomyosin ATPase activity without
inhibition of myosin binding to actin. J Biol Chem
256, 575–578.
36 Tobacman LS & Adelstein RS (1986) Mechanism of
regulation of cardiac actin-myosin subfragment 1 by
troponin-tropomyosin. Biochemistry 25, 798–802.
37 Chen Y, Yan B, Chalovich JM & Brenner B (2001)
Theoretical kinetic studies of models for binding myosin
subfragment-1 to regulated actin: Hill model versus
Geeves model. Biophys J 80, 2338–2349.
38 Spudich JA & Watt S (1971) The regulation of rabbit
skeletal muscle contraction. I. Biochemical studies of
the interaction of the tropomyosin-troponin complex
with actin and the proteolytic fragments of myosin.
J Biol Chem 246, 4866–4871.
39 Eisenberg E & Kielley WW (1972) Evidence for a
refractory state of heavy meromyosin and subfragment-
1 unable to bind to actin in the presence of ATP. Cold
Spring Harbor Symp Quant Biol 37, 145–152.
40 Kielley WW & Harrington WF (1960) A model for the
myosin molecule. Biochim Biophys Acta 41, 401–421.
41 Eisenberg E & Kielley WW (1974) Troponin-tropomyo-
sin complex. Column chromatographic separation and
Distribution of actin–tropomyosin–troponin states B. S. Gafurov and J. M. Chalovich
2298 FEBS Journal 274 (2007) 2287–2299 ª 2007 The Authors Journal compilation ª 2007 FEBS
activity of the three active troponin components with
and without tropomyosin present. J Biol Chem 249,
4742–4748.
42 Weeds AG & Taylor RS (1975) Separation of subfrag-
ment-1 isozymes from rabbit skeletal muscle myosin.
Nature 257, 54–56.
43 Kouyama T & Mihashi K (1981) Fluorimetry study of
N-(1-pyrenyl) iodoacetamide-labeled F-actin: local
structural change of actin protomer both on poly-
merization and on binding of heavy meromyosin. Eur J
Biochem 114, 33–38.
44 Ishii Y & Lehrer SS (1987) Fluorescence probe studies
of the state of tropomyosin in reconstituted muscle thin
filaments. Biochemistry 26, 4922–4924.
45 Dancker P, Low I, Hasselbach W & Wieland T (1975)
Interaction of actin with phalloidin: polymerization and
stabilization of F-actin. Biochim Biophys Acta 400,
407–414.
46 Criddle AH, Geeves MA & Jeffries T (1985) The use of
actin labelled with N-(1-pyrenyl) iodoacetamide to study
the interaction of actin with myosin subfragments and
troponin ⁄ tropomyosin. Biochem J 232, 343–349.
47 Tobacman LS & Butters CA (2000) A new model of
cooperative myosin-thin filament binding. J Biol Chem
275, 27587–27593.
48 Zot AS & Potter JD (1987) Structural aspects of tropo-
nin-tropomyosin regulation of skeletal muscle contrac-
tion. Annu Rev Biophys Biophys Chem 16, 535–539.
49 Greene LE & Eisenberg E (1988) Relationship between
regulated actomyosin ATPase activity and cooperative
binding of myosin to regulated actin. Cell Biophysics
12, 59–71.
50 McKillop DFA & Geeves MA (1991) Regulation of the
actomyosin subfragment 1 interaction by troponin ⁄
tropomyosin. Evidence for control of a specific isomeri-
zation between two actomyosin subfragment 1 states.
Biochem J 279, 711–718.
51 Craig R & Lehman W (2001) Crossbridge and tropo-
myosin positions observed in native, interacting thick
and thin filaments. J Mol Biol 311, 1027–1036.
B. S. Gafurov and J. M. Chalovich Distribution of actin–tropomyosin–troponin states
FEBS Journal 274 (2007) 2287–2299 ª 2007 The Authors Journal compilation ª 2007 FEBS 2299