Báo cáo khoa học: C fi G base mutations in the CArG box of c-fos serum response element alter its bending flexibility Consequences for core-SRF recognition potx
Bạn đang xem bản rút gọn của tài liệu. Xem và tải ngay bản đầy đủ của tài liệu tại đây (720.51 KB, 16 trang )
C
fi
G base mutations in the CArG box of c-fos serum
response element alter its bending flexibility
Consequences for core-SRF recognition
Josef Stepanek
1,2,
*, Michel Vincent
3,
, Pierre-Yves Turpin
1
, Denise Paulin
2
, Serge Fermandjian
4,5
,
Bernard Alpert
2
and Christian Zentz
1
1 Laboratoire de Biophysique Mole
´
culaire Cellulaire & Tissulaire, Universite
´
Pierre et Marie Curie, Evry, France
2 Laboratoire de Biologie Mole
´
culaire de la Diffe
´
renciation, Universite
´
Denis Diderot, Paris, France
3 LURE, Universite
´
Paris-Sud, Orsay, France
4De
´
partement de Biologie et Pharmacologie Structurales, Ecole Normale Supe
´
rieure de Cachan, France
5 Institut Gustave Roussy, Villejuif, France
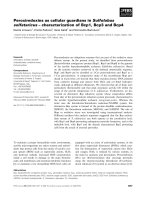
Specific binding of the serum response factor (SRF) to
the serum response element (SRE) requires a consensus
sequence CC(A ⁄ T)
6
GG, the CArG box [1–7]. The
transcriptional activity of a number of CArG-depen-
dent genes is associated with SRF-binding activity
[8–14]. The c-fos gene contains a single high-affinity
CArG box, whereas many muscle-specific genes
contain two or more CArG boxes. However, these
carry substitutions with G or C nucleotides within
their (A ⁄ T) domain, thus lowering the affinity [15–19].
Keywords
CArG box; c-fos; DNA bending; DNA
dynamics; serum response element
Correspondence
C. Zentz, Laboratoire de Biophysique
Mole
´
culaire Cellulaire & Tissulaire,
Universite
´
Pierre et Marie Curie, CNRS
UMR 7033, GENOPOLE Campus 1, 5 rue
Henri Desbrue
`
res, 91030 Evry Cedex,
France
Fax: +33 1 69 87 43 60
Tel: +33 1 69 87 43 52
E-mail:
*Permanent address
Charles University, Faculty of Mathematics
and Physics, Prague, Czech Republic
Present address
IBBMC, Universite
´
Paris-Sud, Orsay France
(Received 22 December 2006, revised 20
February 2007, accepted 2 March 2007)
doi:10.1111/j.1742-4658.2007.05768.x
By binding to the CArG box sequence, the serum response factor (SRF)
activates several muscle-specific genes, as well as genes that respond to
mitogens. The core domain of the SRF (core-SRF) binds as a dimer to the
CArG box C
)5
C
)4
A
)3
T
)2
A
)1
T
+1
T
+2
A
+3
G
+4
G
+5
of the c- fos serum
response element (SRE
fos
). However, previous studies using 20-mer DNAs
have shown that the binding stoichiometry of core-SRF is significantly
altered by mutations C
)5
fi G (SRE
Gfos
) and C
)5
C
)4
fi GG (SRE
GGfos
)
of the CArG box [A Huet, A Parlakian, M-C Arnaud, J-M Glandie
`
res, P
Valat, S Fermandjian, D Paulin, B Alpert & C Zentz (2005) FEBS J 272,
3105–3119]. To understand these effects, we carried out a comparative ana-
lysis of the three 20-mer DNAs SRE
fos
, SRE
Gfos
and SRE
GGfos
in aqueous
solution. Their CD spectra were of the B-DNA type with small differences
generated by variations in the mutual arrangement of the base pairs. Ana-
lysis by singular value decomposition of a set of Raman spectra recorded
as a function of temperature, revealed a premelting transition associated
with a conformational shift in the DNA double helices from a bent to a
linear form. Time-resolved fluorescence anisotropy shows that the fluores-
cein reporter linked to the oligonucleotide 5¢-ends experiences twisting
motions of the double helices related to the interconversion between bent
and linear conformers. The three SREs present various bent populations
submitted, however, to particular internal dynamics, decisive for
the mutual adjustment of binding partners and therefore specific complex
formation.
Abbreviations
core-SRF, core domain of the serum response factor; SRE, serum response element; SRF, serum response factor; SVD, singular value
decomposition.
FEBS Journal 274 (2007) 2333–2348 ª 2007 The Authors Journal compilation ª 2007 FEBS 2333
Strong-affinity CArG boxes are likely to bind SRF
constitutively and genes appear to be regulated primar-
ily during the post-SRF binding step, owing to interac-
tions with accessory proteins [20]. Weaker affinity
CArG boxes may offer additional control through a
mechanism that influences SRF binding, i.e. by mutual
combined interactions of CArG boxes and accessory
proteins [21,22].
The core domain of the SRF (core-SRF) binds to
the CArG box as a homodimer [7,23,24]. The specific
core-SRF–SRE
fos
complex is characterized by the par-
ticular properties of the minor groove in the (A ⁄ T)
domain and its flanking G:C base pairs. The SRF
causes the SRE to bend $ 70°. The role of this bend-
ing in specific recognition has been emphasized
[23,25,26]. The efficiency and specificity of SRF-depend-
ent transcription may vary due to changes in the
CArG box sequence [22]. To understand the origin
of these effects this study focuses on the three 20-mer
oligonucleotides: SRE
fos
, SRE
Gfos
and SRE
GGfos
. The
SRE
fos
sequence, 5¢-d(GGATGTC
)5
C
)4
A
)3
T
)2
A
)1
T
+1
T
+2
A
+3
G
+4
G
+5
ACAT)-3¢, embodies the native
CArG box of the c-fos enhancer (CArG box numbered)
[2,27], whereas SRE
Gfos
carries the single C
)5
fi G
mutation and SRE
GGfos
the double C
)5
C
)4
fi GG
mutation within their CArG box. A previous report has
shown that the parent SRE
fos
bound a core-SRF
homodimer, whereas the single mutant SRE
Gfos
and the
double mutant SRE
GGfos
bound one and four mono-
mers (on average), respectively [7]. This highlights the
role of the base sequence at the border of the A ⁄ T track
in the specific complex assembly and functional organ-
ization. How mutations affect binding of the core-SRF
and generate a lack of defined stoichiometry is an open
question. Thus, we carried out a comparative analysis of
the three oligonucleotides using Raman, CD and fluor-
escence spectroscopies in order to detect their mutual
structural, electrostatic and dynamical differences. CD
and Raman are sensitive to small structural changes
[28,29]. In addition, Raman scattering is a powerful
means of clearing up the various sensitivities of the
nucleic acid chains to temperature [30,31]. Fluorescence
studies require a fluorophore reporter, such as fluo-
rescein, chemically fixed to the oligonucleotides. The
fluorescein fluorescence signal arises from the overlap-
ping emissions of the mono- and dianionic protolytic
states [32], which are sensitive to the electric charge
distribution on the DNA. Chain DNA dynamics have
been extensively studied [33–37]. DNA is intrinsically
flexible, but this flexibility varies from one DNA
to another [38]. To date, little is known about the
relationships between the ability of DNA to bend and
its effects on protein binding. Previous studies have
shown that association of core-SRF with SRE
fos
reduces
the flexibility of each partner, suggesting a strong role
for dynamics in the adjustment of protein–DNA con-
tacts and thereby the specificity of the complex forma-
tion [7]. Time-resolved fluorescence anisotropy decays
of the modified and native fluoresceinated SREs allow
us to assess differences in dynamics among the three
oligonucleotides. The results highlight the strong rela-
tionships between the base sequence, DNA bending,
interactions with water molecules and the internal
dynamics in the specific attachment of core-SRF to
SRE
fos
.
Results
Electric charge distribution in SRE containing
oligonucleotides at 10
°
C
The electric charge distribution along the phosphate
backbone plays a crucial role in the recognition of
DNA by proteins [39]. Certain changes within this
distribution can affect the fluorescence emission of
fluorescein linked to the oligonucleotide [32]. In solu-
tion at pH 8.5, fluorescein exists as an equilibrium of
mono- and dianionic forms. Upon excitation at
490 nm, the unlinked fluorescein fluoresces with a
maximum at 516 nm. The emission spectrum shifts to
520 nm when fluorescein is conjugated to SRE
fos
(Fig. 1), the electrostatic potential of DNA generating
a new equilibrium between the mono- and dianionic
populations of the fluorescein [7]. By contrast, the
mutations performed in the native SRE
fos
sequence
do not affect the fluorescein emission profile indica-
ting that the fluorescent reporter experiences almost
the same environment in SRE
fos
, SRE
Gfos
and
SRE
GGfos
. The electric charges cannot, therefore, be
considered responsible for the differences in stoichio-
metry observed previously between the complexes
of SRE
fos
, SRE
Gfos
and SRE
GGfos
formed with the
core-SRF.
Interactions between neighboring bases of the
SRE oligonucleotides at 10
°
C
The CD spectra of oligonucleotides are influenced by
both the base composition of the nearest neighbor
and the mutual arrangement of bases [28]. The CD
spectra of SRE
fos
, SRE
Gfos
and SRE
GGfos
, recorded at
10 °C, are of the B-DNA family with a positive band
centered at 272 nm and a negative band close to
250 nm (Fig. 2). Slight differences can be assigned to
small changes in local interactions introduced by the
mutations.
Implication of CArG sequence in SRE flexibility J. Stepanek et al.
2334 FEBS Journal 274 (2007) 2333–2348 ª 2007 The Authors Journal compilation ª 2007 FEBS
Basic character of the temperature effect on SRE
oligonucleotides: singular value decomposition
analysis of Raman spectra
The Raman spectra of the three duplexes are sensi-
tive to temperature variations between 10 and 65 °C.
To find out the basic character of these changes,
each set of spectra was statistically treated by means
of singular value decomposition (SVD) [40]. SVD
outputs were similar for the three SREs. Those for
SRE
fos
are given in Fig. 3. A factor dimension of 3,
means that all Raman spectra obtained between 10
and 65 °C can be expressed from three spectral com-
ponents (Fig. 3). The first component, S
1
,isan
invariable spectral residuum with an almost constant
V
1
contribution in each Raman spectrum. The other
two components, S
2
and S
3
, account for two types
of change induced by temperature. Their contribu-
tions, V
2
and V
3
, reveal two kinds of temperature
processes separated by a boundary between 30 and
40 °C: V
2
and V
3
exhibit an inflexion and a mini-
mum. While the second dimension (V
2
,S
2
) shows
spectral features that are common for both transi-
tions, the third dimension (V
3
,S
3
) reflects the differ-
ences between them.
Above 40 °C, spectral changes are related to the
melting of the duplexes. V
2
and V
3
show a parallel
increase with temperature and the changes induced by
temperature are given by the summation of the spec-
tral components S
2
and S
3
. The most significant chan-
ges include (Fig. 3): a decrease in the intensity of the
Raman bands of deoxyribose phosphate backbone
typical of B-type structures [789, 838, 891 (893),
1092 cm
)1
] [29,30,41] and of some bands characteris-
tic for 2¢-endo ⁄ anti conformation of deoxynucleotides
[671 (dT), 681 (dG), 1255 (dA, dC), 1338 cm
)1
(dA)]
[41–44]. By contrast, there is an increase in the Ra-
man bands at 729 (dA), 1238 (dT), 1303 (dA), 1488
(dA, dG), and 1667 cm
)1
(dT) in response to base
destacking in the oligonucleotides [29,30,41–43,45–49].
Between 10 and 25 °C, within the premelting domain,
spectral changes are reflected in a gradual increase in
the contribution of V
2
and a simultaneous decrease in
the contribution of V
3
.V
3
is normalized and its
amplitude looks very similar for all three duplexes in
a temperature region where the premelting is domin-
ant. By contrast, V
2
is mainly normalized according
to melting and weak variations between the three
duplexes can be seen during premelting. In this study,
we are interested in the premelting transitions because
they reveal subtle variations without dissociation of
the DNA strands.
Changes occurring in SRE oligonucleotides
between 25 and 10
°
C
B-DNA conformation of duplexes at 25
°
C
At 25 °C, the three duplexes display very similar
Raman spectra. Several peaks can be assigned to
known characteristic vibrational bands (Figs 4–6,
upper). Bands from the deoxyribose-phophate back-
bone (790, 838, 1093 and 1421 cm
)1
) at a position
diagnostic of the B-type conformation [41,42] are
identified together with bands from deoxyoligonucleo-
tides [681 (dG), 750 (dT), 1255 (dC) and 1339 cm
)1
(dA)] related to the C2¢-endo ⁄ anti conformation
[41,42,44]. The resemblances between the spectra
-2
0
2
4
200 240 280
Wavelength (nm)
Ellipticity (m.deg.)
Fig. 2. CD spectra of SRE
fos
(e), SRE
Gfos
(h) and SRE
GGfos
(n).
Temperature 10 °C. Ellipticity is expressed in millidegrees. Optical
path length 0.1 cm. Oligonucleotide concentration: 10
)6
M.
500 520 540 560 580
Wavelength (nm)
Fluorescence intensity (a.u.)
Fig. 1. Conjugation effect of SRE oligonucleotides on fluorescein
fluorescence emission. Fluorescence emission spectrum of fluo-
rescein (—). Fluorescence emission spectrum of fluorescein conju-
gated to SRE
fos
(e). Both spectra are normalized. The fluorescence
emission spectra of fluorescein conjugated to the three oligonucleo-
tides are identical. Spectra obtained at 10 °C with an excitation
wavelength at 490 nm.
J. Stepanek et al. Implication of CArG sequence in SRE flexibility
FEBS Journal 274 (2007) 2333–2348 ª 2007 The Authors Journal compilation ª 2007 FEBS 2335
Fig. 3. Results of the factor analysis applied to the set of temperature Raman spectra of SRE
fos
. Raman spectrum Y
i
at each temperature is
decomposed into M independent subspectra S
j
. Upper: (left) Singular values W
j
evaluating statistical weight of individual spectral compo-
nents S
j
, (right) residual errors for various numbers of considered spectral components M. Both panels show that the true factor dimension,
i.e. the minimum number of spectral components sufficient to approximate all Raman spectra, is 3. Middle: Relevant spectral components
S
j
,j¼ 1, 2, 3. Lower: Coefficients V
ij
,j¼ 1, 2, 3, indicating the relative contribution of each spectral component S
j
into the spectrum Y
i
.
Spectral components (S
1
,S
2
,S
3
) and coefficients (V
1
,V
2
,V
3
) are normalized so that the sum of their squares over spectral points or tem-
perature, respectively, is equal to 1. Dashed lines indicate marker bands of the duplex melting, observable as coincidently oriented peaks in
the both S2 and S3 spectral components.
Implication of CArG sequence in SRE flexibility J. Stepanek et al.
2336 FEBS Journal 274 (2007) 2333–2348 ª 2007 The Authors Journal compilation ª 2007 FEBS
indicate that the three oligonucleotides have very
similar B-DNA conformations.
Spectral changes in the three duplexes between 25
and 10
°
C
The effects of decreasing the temperature from 25 to
10 °C are illustrated by the difference Raman spectra
(Figs 4–6, lower). For the same oligonucleotide, the
shape of the difference spectra between two tempera-
tures is conserved. When we compare the shape of the
spectra from one oligonucleotide with the two others,
high levels of similarity are also apparent. Essentially,
the band intensities and a few band positions vary
slightly. Spectral conservation allows us to make a
common analysis of the temperature effect on the three
duplexes, in agreement with the similarity of the results
provided by their respective SVD analysis. Changes of
intensity and position of the Raman bands are given
in Table 1.
Effect of the temperature decrease on base stacking
and backbone geometry
The 790 ⁄ 784 cm
)1
doublet undergoes both an upshift
of its 784 cm
)1
component and an increase in the
intensity of its 790 cm
)1
component, thus expressing
changes in the geometry of the phosphodiester group,
and ⁄ or in the conformation of deoxycytidine or deoxy-
thymidine, these becoming closer to the 2¢-endo ⁄ anti
geometry [41,42,47]. The differential profile around
1339 cm
)1
shows that the corresponding adenine band
is upshifted to its position of 2¢-endo ⁄ anti conforma-
tion [41]. For cytosine, the shift in the 1255 cm
)1
band
to 1265 cm
)1
very probably indicates a change in de-
oxynucleoside sugar pucker from the C3¢-endo ⁄ anti
family to the C2¢endo ⁄ anti family [41–43]. The shift in
the 838 cm
)1
band toward higher wavenumbers,
though moderate, is generally interpreted as a sign of
minor groove narrowing [29,41,45]. Wavenumber up-
shift can be also seen for the sugar vibration at
Fig. 4. Raman spectrum of SRE
fos
at 25 °C and the effect of a
decrease in temperature to 10 °C. Upper: Spectrum at 25 °C.
Lower: Temperature effect on the Raman spectrum: spectrum at
10, 15 or 20 °C minus spectrum at 25 °C. The intensity scale is the
same in Figs 4–6.
Fig. 5. As Fig. 4, but for SRE
Gfos
.
Fig. 6. As Fig. 4, but for SRE
GGfos
.
J. Stepanek et al. Implication of CArG sequence in SRE flexibility
FEBS Journal 274 (2007) 2333–2348 ª 2007 The Authors Journal compilation ª 2007 FEBS 2337
Table 1. Temperature-induced change in the Raman spectra of SRE
fos
, SRE
Gfos
and SRE
GGfos
and difference in Raman spectra between
SRE
fos
and SRE
Gfos
and between SRE
fos
and SRE
GGfos
.
Peak position
at 25 °C
a,b
Effect of
temperature
decrease
from 25
to 10 °C
a,c
Difference
spectrum
SRE
fos
-SRE
Gfos c
Difference
spectrum
SRE
fos
-SRE
GGfos c
Assignment
d,e
Significance
d
10 °C25°C10°C25°C
671 m fl 662
dT, dA [41,42] dT 2¢-endo ⁄ anti at 665 [41]
681 m › 691 flflfl fldG [41,42] dG 2¢-endo ⁄ anti at 684 [41,44]
729 s › 731 A breath [41,42] hypochromic [45,49]
750 m › 754 fl 755 fl 755 dT [41] dT 2¢-endo ⁄ anti at 748,
3¢-endo ⁄ -anti at 745 [41]
784 m, sh Þ›780 › 780 › 780 › 780 dC [41,42] dC 2¢-endo ⁄ anti at 782,
3¢-endo ⁄ anti at 780 [41]
790 vs ›››
bk O-P-O str + dr, dT [41] B-DNA g
–
–g
–
of a ⁄ f torsion
dT 2¢-endo ⁄ anti [41,47]
838 m ›Þ › bk O-P-O str [41] B-DNA, exact position sensitive
to minor-groove dimension [41,45]
893 w ÞÜ›885 Ü dr C2¢H
2
rock [29,30] B DNA, sensitive to premelting [30]
924 w, br, as ››928 › 926 › 928 › 928 dr ring str [45] sensitive to B-B¢ transition [30]
973 w, br › T C6H op-def [45], bk [42]
1013 m, br ››1006 › 1006 › 1006 › 1005 G NH def [44],
TCH
3
rock [45],
dr at 1003 [43]
1057 w, as ›››bk C-O str [29,30]
1093 vs ÜÜPO
2–
sym str [41] B-DNA [41], sensitive to
electrostatic environment [46]
1144 w › 1149 dT [42,45]
1178 w, as flfl1186 dT [42,45]; dG [29,43],
dC [51]
1213 w, br, sh ››1218 › 1218 dT, dA [41,42]; dG [43] dT 2¢-endo ⁄ anti at 1208 [41]
1240 w, sh fl dT [42], dC [43] T hypochromic [47]
1255 s › 1265–1269 › 1258 › 1257 › 1270 dC, dA, dT [42],
also dG in [51]
dC 2¢-endo ⁄ anti at 1255,
shift to 1265 for 3¢-endo ⁄ syn [41]
against 2¢-endo ⁄ anti at 1268 [43];
signature of adenine
non Watson–Crick bonding [45]
1294 m,sh › 1299 › 1298 › 1299 › 1299 dC [42,51]
1303 s ›
dA, dT [42,45] dA hypochromic [30]
fl 1321 fl 1321 fl 1322 dG [43,44] dG 2¢-endo ⁄ syn [44])
1339 vs, br Þ
dA, dG [41,42] dA 2¢-endo ⁄ anti at 1339,
3¢-endo ⁄ anti at 1335 [41];
dG 2¢-endo ⁄ anti at 1336 [44]
fl 1361 fl 1363 fl 1361 fl 1364 dG [44] dG 2¢-endo ⁄ anti [44]
1375 vs › 1379
TCH
3
def [45];
dA, dG [42]
intensity increase in hydrophobic
environment of T methyl [29,47]
fl 1396–1403 fl 1402
1421 sdr
C5¢H
2
def, dA [42] B-DNA [41]
1444 w, br › dr C5¢H
2
def [42]
1462 w › dr C2¢H
2
def [42]
1488 vs, as ›Þ fl fl fl fl
G imi ring [46], dA, dT [42] hypochromic [41,47];
N7 bonding to guanine causes
intensity decrease [49] and
frequency downshift [47]
1510 m ›Þ fl
dA, dC [42] upshift with A N7 bonding [45]
1532 w, sh dC, dG [42]
1577 vs ›Þ fl1580 fl 1583 flfl1574 dG, dA [42] G, A hypochromic [41,45]
Implication of CArG sequence in SRE flexibility J. Stepanek et al.
2338 FEBS Journal 274 (2007) 2333–2348 ª 2007 The Authors Journal compilation ª 2007 FEBS
893 cm
)1
[29]. The intensity increase for the 731 (729),
754 (750), 1306 (1303), 1379 (1375), 1490 (1488), 1584
(1577), 1662 (1668) and 1695–1730 cm
)1
(dT) bands
results from partial base unstacking affecting mainly
adenine and thymine, and to a lesser degree also guan-
ine [30,41,42,44–49]. Globally, Raman bands related to
the sugar–phosphate backbone conformation and to
base-stacking reflect conformational changes taking
place in various regions of the DNA duplexes. The
changes induced in our spectra by the decrease in tem-
perature from 25 to 10 °C are similar to those resulting
from the formation of a sharp bend in the DNA
octamer duplex (HMG box) due to binding of the
human SRY–HMG protein. The decrease in tem-
perature results in striking similarities between both
Raman signatures (Figs 4–6, lower) [47,50]. We may
therefore conclude that SRE
fos
and its two mutants
exhibit, at 10 °C, a large population of bent conform-
ers. The bend is not limited to the central (A ⁄ T)
sequence of the CArG box, but includes the bordering
G ⁄ C base pairs, because guanine and cytosine signals
(1488, 1578 cm
)1
and 780, 1257, 1299 cm
)1
, respect-
ively) are also affected [41,42,46,51]. The structural
adjustment resulting in a bent population at 10 °C
underlies a more favored linear B form at higher tem-
peratures. The increase in intensity of the 926 (924),
1444 and 1462 cm
)1
vibrational bands of deoxyribose
and of the 790 and 1056 cm
)1
bands of backbone
reflects the disappearance of this linear population
[29,30,41,42,45]. The increase in both well-resolved
bands at 1444 and 1462 cm
)1
correlates with a broad
band around 1400 cm
)1
at 25 °C of about the same
integral intensity, indicating a larger population of lin-
ear conformers. The upshift and increase in intensity
of the peak at 838 cm
)1
suggest that the backbone
conformation is altered to the detriment of a more
canonical B form [41,45].
Effect of a decrease in temperature on hydrogen-bond
interactions and hydration
From 25 to 10 °C, numerous base vibrations exhibit
spectral shifts indicating changes in the hydrogen bond
array. However, these do not concern regular Watson–
Crick hydrogen bonds. The upshift of the adenine
bands at 1510 cm
)1
(sensitive to binding at N7) and
1577 cm
)1
, like that of the guanine band at 1488 cm
)1
(also sensitive to interaction at N7), are signs of hydro-
gen-bond formation [42,45–47,49]. The downshift of
the 1668 cm
)1
band to 1662 cm
)1
is connected with
a change in hydrogen-bond interaction at the O4 of
thymine [41,42,45,48]. These changes can be assigned
to a redistribution of water molecules or hydrated ions
on the above-mentioned base. This is in accordance
with the weak wavenumber downshift of the PO
2
–
Table 1. Continued.
Peak position
at 25 °C
a,b
Effect of
temperature
decrease
from 25
to 10 °C
a,c
Difference
spectrum
SRE
fos
-SRE
Gfos c
Difference
spectrum
SRE
fos
-SRE
GGfos c
Assignment
d,e
Significance
d
10 °C25°C10°C25°C
1602 w, sh dC [42], G N1H def [41]
1652 m, sh T (C4O ⁄ C5C6) str [42],
dC [43]
1668 s, br › 1662 Ü›1662 T (C4O ⁄ C5C6) str [42,48] shift to 1662 in case of
extra H-bonding at C ¼ O [41,45]
› 1695–1720 › 1699 T C2O str [42,48] at 1689, shift to 1681 in case of
extra H-bonding at C2 ¼ O [41,45]
› 1730 › 1711
› 1736
dG: CO str [44] variable position 1686–1722 [44]
a
Common characteristics for the three DNA duplexes.
b
Peak positions are in wavenumber units (cm
)1
). Numbers in bold correspond to
well-resolved bands; precision of the peak position ± 1 cm
)1
. Numbers in standard type correspond to shoulders, asymmetrical or partly
overlapped bands, and also to peaks in difference spectra; precision of the peak position ± 3 cm
)1
. Added are basic characteristics of Raman
band intensities: w ¼ weak, m ¼ medium, s ¼ strong, vs ¼ very strong, sh ¼ shoulder, br ¼ broad, as ¼ asymmetric.
c
Symbols: › inten-
sity increase, fl intensity decrease, Þ upshift of vibrational frequency, Ü downshift of vibrational frequency. If the intensity increase or
decrease in the difference spectrum is not pronounced exactly at the frequency corresponding to the basic Raman band position (first col-
umn), the position of the peak or nick in the difference spectrum is indicated.
d
Abbreviations: A, C, G, T ¼ adenine, cytosine, guanine, thy-
mine; dA, dC, dG, dT ¼ deoxynucleotide containing given nucleobase; bk ¼ backbone; dr ¼ deoxyribose.
e
In case of overlapping Raman
bands of several vibrational modes, the dominating mode is underlined. Abbreviations for vibrational modes: str ¼ stretching, def ¼ deforma-
tion, breath ¼ breathing, rock ¼ rocking, op ¼ out-of-plane, sym ¼ symmetric.
J. Stepanek et al. Implication of CArG sequence in SRE flexibility
FEBS Journal 274 (2007) 2333–2348 ª 2007 The Authors Journal compilation ª 2007 FEBS 2339
symmetric stretching vibration (1092 cm
)1
) expected to
be sensitive to solvent charge interactions in the envi-
ronment of phosphate groups [46].
Effect of mutations
Even though the temperature difference spectra look
similar between one oligonucleotide and the other two
(Figs 4–6, lower), their mutual differences reveal some
disparities. These are visible at 10 and 25 °C in the
spectra shown in Figs 7 and 8, respectively, and in
Table 1. At a given temperature, spectra of SRE
fos
and
SRE
Gfos
bearing one mutation are very similar, but
they differ much more significantly from the spectrum
of SRE
GGfos
bearing two mutations.
Effect on G:C base pairs
As expected, the mutations entail visible, local con-
formational changes between the native C
)5
C
)4
and
single mutated C
)5
G
)4
steps (SRE
Gfos
), and the double
mutated G
)5
G
)4
step (SRE
GGfos
). The main effect of
the mutations concerns the region of the two G:C base
pairs, whose orientation is reversed. There are signs
of increased intensity for several guanosine signals
(troughs at 679, 1321, 1361, 1488 and 1578 cm
)1
)
[41–44,46,48], including the markers of deoxyguanosine
2¢-endo ⁄ anti conformation (679 and 1361 cm
)1
) and
also the 1321 cm
)1
band considered to be a 2¢-endo ⁄
syn conformation marker [44]; the increased intensity
of several of these bands reflects increased unstacking
of the guanine residue. By contrast, several positive
peaks in the difference spectra (780, 1257 and
1299 cm
)1
) are attributable to a decreased cytidine
intensity [41,42,51]. They indicate that, in the case of
cytidine, the mutation causes better stacking and also
reduces the probability of the 3¢-endo ⁄ anti conforma-
tion (the 780 cm
)1
band) [41].
In the spectral differences at 10 and 25 °C the muta-
tional effects are conserved for the guanosine bands,
whereas they are substantially weaker at increased tem-
perature for the cytidine bands.
Effect on hydrogen-bond interactions, hydration
and stability of the various SREs
At 10 °C (Fig. 7), the negative band at 755 cm
)1
attributed to the deoxythymidine 2¢-endo ⁄ anti confor-
mation appears somewhat more pronounced in the
mutated versions [41]. The two deoxyribose vibration
bands (positive peaks at 885 and 928 cm
)1
) become
less intensive in both mutant spectra [29,30,45]. For
the double mutant SRE
GGfos
, the simultaneous upshift
of the 1668 cm
)1
band suggests a weakening of the
extra hydrogen bonding of the thymine carbonyl with
the surrounding water molecules [41,42,45,48]. Because
no bands appear around 1093 cm
)1
the electrostatic
environment of the three duplexes cannot be distin-
guished [46].
At 25 °C (Fig. 8), the difference in the Raman spec-
tra between the oligonucleotides increases. The differ-
ent intensities of the bands at 1402 cm
)1
and at 790,
838, 927, 1056 cm
)1
of the deoxyribose and the back-
bone [29,30,41,45] reflect the relative disappearance of
Fig. 7. Difference in Raman spectra at 10 °C between SRE
fos
and
SRE
Gfos
and between SRE
fos
and SRE
GGfos
. The intensity scale is
the same as in Figs 4–6.
Fig. 8. As Fig. 7, but at 25 °C.
Implication of CArG sequence in SRE flexibility J. Stepanek et al.
2340 FEBS Journal 274 (2007) 2333–2348 ª 2007 The Authors Journal compilation ª 2007 FEBS
the bend population for the benefit of the linear one.
Concurrently, the bands from extra hydrogen bonding
at thymine (1662, 1699 cm
)1
) [41,42,45,48] amplified
by the increase in temperature, varies with the band at
1093 cm
)1
(positive peak at 1086 cm
)1
, trough at
1098 cm
)1
), most probably due to modified interac-
tions between the (A ⁄ T) domain and solvent mole-
cules. These changes concern mainly the SRE
GGfos
and
to a lesser extent the SRE
Gfos
. Thus, an increase in
temperature decreases the thermal stability of the bent
form in the order: SRE
fos
< SRE
Gfos
< SRE
GGfos
.
The bent structure of SRE
fos
is the most stable and
preserved of the three duplexes, whereas the double
mutation brings about a higher instability of that
structure.
Internal dynamics of SRE helices
The dynamics of the three SRE oligonucleotides were
assessed using time-resolved fluorescence anisotropy
decays with the fluorescein group fixed at the 5¢-end as
a fluorescence reporter. During the lifetime of its exci-
ted state (4 ns), the fluorescein group is involved in
several motions: rotation as a whole, together with the
internal motions of the oligonucleotide; and the proper
rotations of the fluorophore around its link with the
oligonucleotide. Correlation times for the multiexpo-
nential anisotropy decays with their relative propor-
tions are shown in Table 2. The shortest correlation
time (i.e. F ¼ 0.4 ns) carries the strongest weight in
the composite decay. This correlation time is linked
to the time of fluorescein rotation around its link with
the oligonucleotide. The correlation time for rotation
of the SRE molecule as a whole, estimated to be 10 ns
from hydrodynamic measurements [7,52], was hard to
detect in our experiments. In any case, the fast depo-
larization process due to fluorescein motions prevents
monitoring of the entire oligonucleotide rotation.
Because the fluorescent reporter experiences the same
environment for the three oligonucleotides, we con-
clude that the longest correlation time reflects the
internal dynamics of helix strands that drive fluoresc-
ein with them. The longest correlation time for SRE
fos
,
i.e. F ¼ 3.2 ns, slows to F ¼ 3.9 ns in SRE
Gfos
,
whereas the double mutation shortens it to F ¼ 1.8 ns
in SRE
GGfos
. The inverse of the correlation time (1 ⁄F)
represents the twisting oscillation frequency (m) of the
double helix. The oscillation frequency increases in the
order (Table 2): SRE
Gfos
< SRE
fos
< SRE
GGfos
.
Table 2 also gives the statistical weight (b) for the lon-
gest correlation times which increases in the order:
SRE
fos
< SRE
Gfos
< SRE
GGfos
.
For each oligonucleotide, this weight decreases when
the temperature increases from 10 to 30 °C (not
shown), indicating a lower population that depolarizes
at higher temperature. Because the population of the
bent form decreases at higher temperature, we must
assume that the linear form does not give a detectable
depolarization signal. Thus, fluorescence anisotropy
decay mainly detects the helix twisting of the bent
form offering enough thermal amplitude motions. In
addition, b-value and thermal instability of the bent
form detected using differences in Raman spectra
between the oligonucleotides increase in the same
order.
Discussion
The C fi G mutations at the )5 and )4 positions of
the CArG box alter the binding stoichiometry in a dra-
matic manner [7]. Here we show that, at 10 °C, such
mutations do not affect electric charge repartition
along the oligonucleotides and preserve the same
B-DNA conformation. Essentially, the interactions at
the mutated positions are modified together with the
arrangement of water molecules and the internal
dynamics.
Premelting effect on the equilibrium of the bent
linear form
The premelting transition has been studied in detail by
Raman spectroscopy for alternating [poly(dA–dT)]
2
and homogenous poly(dA):poly(dT) sequences [30,45].
The similarity to the effects of temperature on our
Raman spectra emphasizes its influence on the six cen-
tral (A ⁄ T) base pairs of the CArG boxes. Detailed
analysis of Raman spectra has confirmed that the
Table 2. Relation between parameters of the fluorescence aniso-
tropy decays of fluorescein labeling the various SRE oligonucleo-
tides and the number of bound core-SRF monomers at 10 °C.
F
a
ns
(± 0.1 ns)
b
b
%
(± 2%)
m ¼
1
U
c
10
6
Hz N
d
SRE
Gfos
0.4 86
3.9 14 260 ± 10 1
SRE
fos
0.4 88
3.2 12 310 ± 10 2
SRE
GGfos
0.4 82
1.8 18 560 ± 20 % 4
a
F, correlation time. The longest correlation time characterizes the
internal motion of the DNA duplex.
b
b, weight of the exponential
component.
c
m, oscillation frequency.
d
N, number of core-SRF
monomer bound to DNA fragment [7].
J. Stepanek et al. Implication of CArG sequence in SRE flexibility
FEBS Journal 274 (2007) 2333–2348 ª 2007 The Authors Journal compilation ª 2007 FEBS 2341
premelting transition conserves the basic local confor-
mation features of B-DNA. (A ⁄ T)-rich sequences have
been found to be highly polymorphic and depend
strongly on the temperature [53,54]. Indeed, the change
in the array of the hydrogen bonds at thymine of
SRE
GGfos
is probably a sign of perturbation in the
hydration scheme along the minor groove of the (A ⁄ T)
domain. The G–C base pair is characterized by a large
dipole and both inversions change the local electric
charge repartition at )5 and )4 positions of the CArG
box, and as a consequence the interactions with water
molecules of the (A ⁄ T) domain [55,56]. Premelting
transitions are ascribed to the disruption of water
molecules specifically bound to DNA [31,45,57]. The
presence of a ‘low-temperature form’, referred to as
B¢-type DNA, is correlated with tight binding between
water molecules and bases, especially in the narrow
minor groove of the (A ⁄ T) domains [53,54,58].
At low temperatures, between 5 and 10 °C, free
SRE
fos
appears more bent using Raman spectroscopy
than was found using electrophoresis [23,59]. Relevant
to the vibrational timescale (10
)14
s), Raman spectros-
copy allows the signals of the bent and linear conform-
ers to be differentiated whatever their conversion time,
whereas electrophoretic techniques average the signals
of both conformers [59]. Thus, it is more a transient
bent population than a stable one that is observed in
solution. From one oligonucleotide to the other two,
the temperature difference Raman spectra (Figs 4–6),
like the difference spectra at 10 and 25 °C (Figs 7,8),
exhibit a high degree of spectral pattern conservation
with uniform low-intensity variations. The SRE
fos
and
its two mutants oscillate between a bent and a linear
form keeping the same average conformations. Thus,
an increase in temperature displaces the equilibrium,
increasing the amplitude of motion around the regular
states within the frame of the same average geometries.
These results suggest that the conversion process arises
from global thermal fluctuations of the oligonucleo-
tides and the mutations mainly influence the probabil-
ity of their occurrence [60].
Bending magnitude of SRE
fos
In order to evaluate the bend angle induced by the
decrease in temperature from 25 to 10 °C, the Raman
spectral changes for SRE
fos
were compared with those
resulting from the formation of a sharp bend in a
DNA octamer duplex (HMG box) upon interaction
with the SRY(HMG) protein [47]. The CArG and
HMG boxes have very similar proportions of A:T vs.
G:C base pairs (6:4 in our case and 5:3 in HMG box),
and approximately the same size region is expected to
be subject to a sharp bend. Moreover, the SREs used
in this study (20-mers) contain 2.5 times more nucleo-
tides than the HMG box (octamer used for compar-
ison). The spectral changes occurring in SRE
fos
between 10 and 25 °C correspond to approximately
half of that caused by the SRY–HMG protein in the
HMG box. Otherwise, the temperature-induced struc-
tural changes in the Raman spectra during premelting
are mainly characterized, in SVD analysis, by variation
in the V
2
contribution of the spectral component S
2
.
Actually, the temperature profile of the V
2
contribu-
tion is in accordance with the reduction in the bent
population in the oligonucleotide. Thereby, we can
deduce that 10 °C corresponds closely to the tempera-
ture transition between the bent form and the linear
form, since their populations are roughly equivalent.
The agreement between our results and those reported
by Benevides et al. [47] for the 70° sharp bend induced
in the HMG box seems very interesting. Indeed, the
bend determined by Raman for the free SRE
fos
in
solution is roughly similar to that formed in SRE
fos
in the crystal of its complex with the core-SRF [24].
This study does not provide information on the local
repartition of the angles involved in the SRE
fos
helix
bending.
Relative effect of bending strain
There are several indications of a redistribution of
the strains exerted on the oligonucleotide by the
bend: partial unstacking of some adenine, thymine
and guanine bases and a more distinct presence of
2¢-endo conformations of furanose rings at 10 °C
against a higher percentage of 3¢-endo ⁄ anti at 25 °C.
Because the bend is present at low temperature, its
stabilization must be favored from the point of view
of enthalpy, but unfavored from the point of view of
entropy. A 25 °C, the higher entropy of the linear
form is likely due to its higher flexibility, the higher
mobility of the hydration shell, or both. In the
curved conformation, the strain exerted on the secon-
dary structure of the double helix increases its tor-
sional stiffness [61].
Dynamic effects of mutations on SRE helices
G fi C base mutations at positions )4 and )5 of the
CArG box induce only slight local structural differ-
ences but important interactional changes between
the bases. The extensive empirical study of El Hassan
and Calladine [56] showed that the CA step adopts a
wide continuous range of conformations. However,
the persistence of the backbone conformation restricts
Implication of CArG sequence in SRE flexibility J. Stepanek et al.
2342 FEBS Journal 274 (2007) 2333–2348 ª 2007 The Authors Journal compilation ª 2007 FEBS
the space devoted to the motions of this step. Within
the CArG box of SRE
fos
and SRE
Gfos
, the C
)4
A
)3
step retains a large part of its original flexibility.
Conversely, the GA step adopts a restricted range
of conformational space. Thus, for the CArG box
of SRE
GGfos
, the rigid G
)4
A
)3
step inhibits (by
mechanical locking) the local freedom brought about
by the C
)4
A
)3
step in SRE
fos
. We should note that the
C
)5
C
)4
step in SRE
fos
, the G
)5
C
)4
step in SRE
Gfos
and the G
)5
G
)4
step in SRE
GGfos
belong to the class
of loose steps. Their conformational bistable space is
not limited by mechanical locking, but by strong elec-
trostatic interactions [56]. The stiffness of the whole
double helix depends on each local elasticity modulus
and the strains involved between neighboring bases
appear to be the main factor [38,62]. Other local
strains, such as hydration level and oligonucleotide
bending, also act on the elastic properties of the entire
SRE helix. Premelting transition reveals that the muta-
tions affect the hydration of the SRE minor groove.
Thus, this alteration contributes to the change in over-
all elasticity. In this way, the global elastic modulus of
each oligonucleotide is linked (by Hook’s law) to the
elastic force on the central (A ⁄ T) domain of the CArG
box and on the base sequence flanking it [63]. Thus,
the internal dynamics of each oligonucleotide are
directly correlated with its global stiffness and the be-
havior of the torsional oscillations reveals these chan-
ges in elasticity. Only the fluorescein reporters swept
by oligonucleotide molecules with sufficient stiffness
experience part of the SRE internal movements. If the
conversion between a bent and a linear form occurs at
a shorter or longer timescale than the fluorescence
excited state of fluorescein (4 ns), the frequency m ¼
1 ⁄F is linked to the stiffness of the bent form and
reflects the speed of helix twisting. But if some of the
conversion process is performed during fluorescence
emission, the anisotropy decreases and the frequency
m ¼ 1 ⁄F mirrors the helix stiffness mediated by the
concomitant bent–linear conversion. In that case, the
weight b of the longest correlation time is related to
the population of the bent form, which varies with the
speed of conversion between the bent and linear forms.
Thus, the b population value of the double mutant
SRE
GGfos
reveals a faster conversion rate between the
bent and linear form, whereas SRE
fos
and SRE
Gfos
probably have their conversion rates close to each
other. Indeed, thermal fluctuations in SRE
fos
and
SRE
Gfos
make the most of the large conformational
range allowed by the C
)4
A
)3
step, whereas, owing to
the restricted conformational space allowed by the
G
)4
A
)3
step, SRE
GGfos
can only take the effects of the
thermal fluctuations by a higher frequency of helix
twisting [56]. The double mutation brings a higher
rigidity and instability of the bent form, correlated to
the higher aptitude of the G
)4
A
)3
step (SRE
GGfos
)
compared with the C
)4
A
)3
step (SRE
fos
, SRE
Gfos
)to
fluctuate between the BI and the BII phosphodiester
states [64–66]. Indeed, a dynamic bend resulting from
a ‘BI ⁄ BII’ equilibrium has been observed previously
[67]. The fluctuations between these phosphodiester
states probably interfere with the conversion between
linear and bent conformers on a nanosecond timescale
[68]. BI conformers have a straight helix axis, whereas
BII conformers display a global dynamic curvature
[67]. Upon an increase in temperature the ‘BI ⁄ BII’
equilibrium is displaced from the BII to the BI con-
formers [69].
Basis of SRE
fos
recognition
A previous working model of the core-SRF ⁄ DNA
interaction suggested that core-SRF forms a stable
dimer in solution under physiological conditions [70].
But these studies were carried out in the presence of
DNA, which induces a conformational change in core-
SRF and leads to a particular monomer structure
[7,23]. The dimerization constant of core-SRF, alone
in solution, remains unknown. In vivo, binding of core-
SRF to DNA is never in equilibrium but rather is a
kinetic process. Yet, nothing could exclude that two
independent monomers bind nonspecifically to DNA
and move randomly to associate on the CArG box tar-
get in a specific dimer.
Some features pre-exist in the free DNA and are
required for preferential interactions with proteins.
Analysis of the crystal structure of specific complexes
reveals that core-SRF modulates the inducible con-
formational properties of SRE [23,24]. The origin of
the adequate conformational deformation of the CArG
boxes lies in the polymorphism of the (A ⁄ T) domain.
Yet within the known CArG box–core-SRF com-
plexes, the CArG box remains bent whatever the
mutations performed in the (A ⁄ T) sequence [23,24,26].
There is a direct correlation between the degree of
DNA bending and the ability of core-SRF to recognize
a CArG consensus [25,26]. Crystallographic data show
that core-SRF residues K154 and K165 of the a
1
helix
and residues T191 and H193 of the b loop stabilize the
DNA into a bent conformation. Residue K154 plays a
major role in specificity determination [23,25]. Thus,
DNA bending appears to be a major determinant of
SRE–core-SRF binding specificity.
SRE
Gfos
displays stabilization of the stoichiometry
brought about by binding of a monomer, whereas
SRE
GGfos
recruits an average of four monomers, which
J. Stepanek et al. Implication of CArG sequence in SRE flexibility
FEBS Journal 274 (2007) 2333–2348 ª 2007 The Authors Journal compilation ª 2007 FEBS 2343
pile up on this oligonucleotide. The bases at positions
)4 ⁄ )5 and +4 ⁄ +5 of the CArG box are highly con-
served [19]. In the case of SRE
Gfos
, the G–C base pair
inversion at )5 position precludes formation of the
hydrogen bond between the K163 residue of the
core-SRF proximal subunit and the G
)5
base. For
SRE
GGfos
, in the same manner, inversion of the G–C
base pairs at positions )5 and )4, prevents formation
of the specific double-hydrogen bond between residue
K163 and both G
)5
and G
)4
bases, and moreover,
between residue T140 and C
)4
base [23,24]. Actually,
mutations of this highly conserved K163 residue pre-
vent complex formation [6]. This specific double
hydrogen bond is essential for stabilization of the
a
1
helix of core-SRF. Thus, both single and double
mutations affect binding of the proximal core-SRF
subunit to the first half-site of the CArG box. As a
matter of fact, the structure of the (A ⁄ T) domain of
the three oligonucleotides is similar. It is likely that
both mutations do not induce any structural perturba-
tion which could prevent, or favor, fixation of a core-
SRF monomer to the second half-site. Thus, structural
constraints alone cannot explain why a core-SRF
monomer could establish or not, some links with the
second half-site.
The main difference between SRE
fos
and SRE
Gfos
,
on the one hand, and SRE
GGfos
, on the other hand,
consists in the distinct strains acting on the helix ply of
these oligonucleotides. Conversion between the bent
and linear forms depends on local SRE constraints. A
decrease in the strains should freeze some conversion
and consequently alter the topology and the popula-
tion of the bent form. A greater strain in the SRE-ply
enhances its rigidity, which in turn reduces the ampli-
tude and increases the frequency of the twist. If the
frequency of helix twisting is too high many core-SRF
gather without specific association to DNA (i.e.
SRE
GGfos
) [7]. We should note that SRE
GGfos
posses-
ses a hydration state different from the other two
oligonucleotides. Thus, more than structural con-
straints, dynamics and hydration play a key role in the
failing of a core-SRF monomer to establish specific
links with the second half-site of SRE
GGfos
. The chan-
ges brought about by C fi G base mutations are a
consequence of a complex balance between structural
and dynamical effects. Previous results indicated that
the dynamics of core-SRF and SRE
fos
are crucial dur-
ing complex assembly [7]. The specific recognition is in
need of a particular DNA dynamic status of the
bent form allowing the core-SRF to lock this tran-
sient conformer into a specific stable bent form
[23,24]. Thus, the dynamics of the bent form deter-
mine when the core-SRF switch from nonspecific to
specific interactions with SRE
fos
, even if this complex
results from the interplay of interactions between both
partners.
Conclusion
CArG box sequences play a key role in hydration and
dynamics within SRE double helices. A premelting
transition of SREs reveals a dynamic equilibrium
between a bent and a linear form involving poly-
morphism of the (A ⁄ T) domain of the CArG box.
These pre-existing features of free SRE
fos
contribute to
the specific recognition with core-SRF. The poly-
morphism of the (A ⁄ T) domain and the dynamics of
the bent form one determinant for specific complex
formation. They appear to be as important as the con-
servation of the DNA base sequence. Therefore, the
basic question is no longer what prerequisite site on
the DNA determines the specific complex formation,
but rather what dynamical scenario leads to stabiliza-
tion of the core-SRF on the consensus CArG
sequence. From this point of view, the various interac-
tions connecting the bases of the CArG box play the
key role in the physiological activity of DNA.
Experimental procedures
Oligonucleotides
The oligonucleotide SRE
fos
5¢-d(GGATGTCCATATTA
GGACAT)-3¢ reproduces the sequence of the SRF recog-
nition element of the c-fos enhancer [2,27]. The mut-
ants SRE
Gfos
5¢-d(GGATGTgCATATTAGGACAT)-3¢ and
SRE
GGfos
5¢-d(GGATGTggATATTAGGACAT)-3¢ have
one (C fi G) and two (CC fi GG) mutations, respectively,
at the end of the CArG consensus sequence underlined
above (mutations are indicated by lower case letters).
HPLC-purified single strands were purchased from Invitro-
gen (Cergy Pontoise, France). These sequences and their
complementary strands were annealed by two heating cycles
followed by slow cooling to room temperature. Concentra-
tions of double-stranded DNA were determined from sin-
gle-strand DNA concentrations, estimated by absorbance
measurements at 260 nm and using extinction coefficients
(in mm
)1
cm
)1
) of 14.7 (dA), 6 (dC), 11.8 (dG), and 8.7
(dT). For fluorescence experiments, the single-stranded
oligonucleotide sequences presented above were labeled
with fluorescein (Invitrogen) at their 5¢-ends. After associ-
ation of the complementary strand, the remaining single
strands and excess free fluorescein were removed by column
chromatography on Sephadex G25 (Pharmacia, Saclay,
France).
Absorption spectra were recorded on a Varian Cary3E
spectrophotometer equipped with a thermostatically
Implication of CArG sequence in SRE flexibility J. Stepanek et al.
2344 FEBS Journal 274 (2007) 2333–2348 ª 2007 The Authors Journal compilation ª 2007 FEBS
controlled sample holder. The cell path length was 1 cm.
All experiments were done in a 2 mm Tris buffer, pH 8.5,
0.1 m NaCl, 1 mm EDTA and 1 mm dithiothreitol.
Raman spectra
The 488.0 nm line of an Ar
+
laser ($ 200 mW at the sam-
ple) was used for excitation. Samples were placed in a tem-
perature-stabilized microcell of 12 lL volume. Raman
scattered light was collected in a standard 90° geometry
and recorded in a Jobin–Yvon T64000 CCD Raman spec-
trometer. The effective spectral resolution was $ 4cm
)1
.
Raman spectra of 0.4 mm SRE
fos
, SRE
Gfos
and SRE
GGfos
duplex solutions were measured in the 600–1800 cm
)1
spec-
tral region between 10 and 65 °C. Total exposure time per
spectrum ranged from 4000 to 6000 s, depending on the
residual fluorescence level. Before measurement of each
spectrum, the sample temperature was kept constant for
10 min. To correct for possible drifts in the wavenumber
scale, a neon glow-lamp spectrum was recorded after every
analyzed sample and the Raman shift values were corrected
by using an automatic recalibration procedure. Subtle chan-
ges in Raman spectra were visualized by calculating differ-
ence spectra. When spectra of particular duplexes were
subtracted, the band of PO
2
–
symmetric stretching vibra-
tion commonly used as intensity standard in Raman
spectroscopy of DNA [30] was used to determine the right
scaling factor. No scaling factor was used for subtraction
of Raman spectra obtained for the same sample at various
temperatures; the correctness of difference spectra was nev-
ertheless evidenced by the zero integral intensity in the
region around 1092 cm
)1
.
Raman spectra were corrected by using a unified semi-
automatic procedure (subtraction of solvent spectrum, scat-
tered light from the microcell glass walls and background
represented by a sixth degree polynomial). Sets of tempera-
ture-dependent Raman spectra of each DNA duplex were
treated by factor analysis –SVD algorithm [40].
Fluorescence measurements
To minimize possible inner filter effect, all fluorescence
measurements were carried out in fluorescein-labeled oligo-
nucleotide solutions having at the excitation wavelength an
optical density < 0.05 on a 1 cm path length.
Steady-state fluorescence emission spectra were recorded
on a SLM Aminco-Bowman series 2 spectrofluorometer
between 500 and 600 nm with an excitation at 490 nm.
Both excitation and emission bandwidths were 4 nm. Fluor-
escence spectra were corrected for the buffer background.
Time-resolved fluorescence anisotropy decays were obtained
by the time correlated single-photon counting method in
using synchrotron radiation (superACO, LURE) as a
source of exciting pulsed polarized light, with a repeat fre-
quency of 8.33 MHz. Excitation (with a 2 nm bandwidth
through a Jobin-Yvon double monochromator) and emis-
sion (10 nm bandwidth) were set at 490 and 520 nm,
respectively. Vertical and horizontal polarized light emis-
sions were collected alternately on the experimental set-up
(installed on the SB1 window). Automatic sampling cycles
included a 30 s accumulation time for the instrument
response function (measured with a glycogen scattering
solution) and a 90 s acquisition time for each polarized
fluorescent component. This was repeated until a total of
(2–4) · 10
6
counts was obtained on each intensity decay
component.
Fluorescence anisotropy decay curves A(t) were analyzed
by the maximum entropy method [71], in using the distribu-
tion function AðtÞ¼
P
i
b
i
exp
Àt
U
i
; the b
i
parameters being
the contribution weights related to the corresponding corre-
lation times F
i
.
CD measurements
UV CD spectra were recorded on a Jasco model J-810 spec-
tropolarimeter equipped with a thermoelectrically con-
trolled cell holder. A 0.1 cm quartz cell was used. Each
spectrum, monitored between 200 and 320 nm by steps of
1 nm, represents an average of 3 · 5 scans. Results are pre-
sented in ellipticity (millidegrees) as a function of wave-
length (nm).
Acknowledgements
This investigation was supported by the Association
Franc¸ aise contre les Myopathies (grant N°9693) and
the Fondation pour la Recherche Me
´
dicale (ACE
20030 92 61 87). J. Stepanek thanks the University
Denis Diderot for their invitation. We are greatly
indebted to A. Huet for his help in the samples prepar-
ation and to the members of the synchrotron at LURE
and the linear Accelerator Laboratory (Orsay, France)
for running Super ACO.
References
1 Minty A & Kedes L (1986) Upstream regions of
the human cardiac actin gene that modulate its
transcription in muscle cells: presence of an
evolutionary conserved repeated motif. Mol Cell
Biol 6, 2125–2136.
2 Treisman R (1986) Identification of a protein-binding
site that mediates the transcriptional response of the
c-fos gene to serum factors. Cell 46, 567–574.
3 Prywes R & Roeder RG (1986) Inducible binding of a
factor to the c-fos enhancer. Cell 47, 777–784.
4 Gilman MZ, Wilson RN & Weinberg RA (1986) Multi-
ple protein-binding sites in the 5¢-flanking region regu-
late c-fos expression. Mol Cell Biol 6, 4305–4316.
J. Stepanek et al. Implication of CArG sequence in SRE flexibility
FEBS Journal 274 (2007) 2333–2348 ª 2007 The Authors Journal compilation ª 2007 FEBS 2345
5 Nurrish SJ & Treisman R (1995) DNA binding specifi-
city determinants in MADS-box transcription factors.
Mol Cell Biol 15, 4076–4085.
6 Shore P & Sharrocks AD (1995) The MADS-box family
of transcription factors. Eur J Biochem 229, 1–13.
7 Huet A, Parlakian A, Arnaud M-C, Glandie
`
res J-M,
Valat P, Fermandjian S, Paulin D, Alpert B & Zentz
C (2005) Mechanism of binding of serum response
factor to serum response element. FEBS J 272, 3105–
3119.
8 Lee T, Shi Y & Schwartz RJ (1992) Displacement of
BrdUrd-induced YY1 by serum response factor acti-
vates skeletal a-actin transcription in embryonic myo-
blasts. Proc Natl Acad Sci USA 89, 9814–9818.
9 Croissant JD, Kim J-H, Eichele G, Goering L, Lough J,
Prywes R & Schwartz RJ (1996) Avian serum response
factor expression restricted primarily to muscle cell
lineages is required for a-actin gene transcription. Dev
Biol 177, 250–264.
10 Kim JH, Johansen F-E, Robertson N, Catino JJ,
Prywes R & Kumar CC (1994) Suppression of ras trans-
formation by serum response factor. J Biol Chem 269,
13740–13743.
11 Hill CS, Wynne J & Treisman R (1994) Serum-regulated
transcription by serum response factor (SRF): a novel
role for the DNA binding domain. EMBO J 13, 5421–
5432.
12 Parlakian A, Tuil D, Hamard G, Tavernier G, Hentzen
D, Concordet J-P, Paulin D, Li Z & Daegelen D (2004)
Targeted inactivation of serum response factor in the
developing heart results in myocardial defects and
embryonic lethality. Mol Cell Biol 24, 5281–5289.
13 Xing Zhang S, Garcia-Gras E, Wycuff DR, Marriot SJ,
Kadeer N, Yu W, Olson EN, Garry DJ, Parmacek MS
& Schwartz RJ (2005) Identification of direct serum-
response factor gene target during Me
2
SO-induced P19.
J Biol Chem 280, 19115–19126.
14 Mericskay M, Parlakian A, Porteu A, Dandre F,
Bonnet J, Paulin D & Li Z (2000) An overlapping
CArG ⁄ octamer element is required for regulation of
desmin gene transcription in arterial smooth muscle
cells. Dev Biol 226, 192–208.
15 Leung S & Miyamoto NG (1989) Point mutational ana-
lysis of the human c-fos serum response factor binding
site. Nucleic Acids Res 17, 1177–1195.
16 Gustafson TA & Kedes L (1989) Identification of multi-
ple proteins that interact with functional regions of the
human cardiac alpha-actin promoter. Mol Cell Biol 9,
3269–3283.
17 Chen CY, Croissant J, Majesky M, Topouzis S,
McQuinn T, Frankovsky MJ & Schwartz RJ (1996)
Activation of the cardiac alpha-actin promoter depends
upon serum response factor; Tinman homologue, Nkx-
2.5, and intact serum response element. Dev Gen 19,
119–130.
18 Madsen CS, Hershey JC, Hautmann MB, White SL &
Owens GK (1997) Expression of the smooth muscle
myosin heavy chain gene is regulated by a negative-act-
ing GC-rich element located between two positive-acting
serum response factor-binding element. J Biol Chem
272, 6332–6340.
19 Miano JM (2003) Serum response factor: toggling
between disparate programs of gene expression. J Mol
Cell Cardiol 35, 577–593.
20 Treisman R (1994) Ternary complex factors: growth
factor regulated transcriptional activators. Curr Opin
Genet Dev 4, 96–101.
21 Sartorelli V, Kurabayashi M & Kedes L (1993) Muscle-
specific gene expression. A comparison of cardiac and
skeletal muscle transcription strategies. Circ Res 72,
925–931.
22 Hautmann MB, Madsen CS, Mack CP & Owens GK
(1998) Substitution of the degenerate smooth muscle
(SM) a-actin CC(A ⁄ T)
6
GG elements with c-fos serum
response elements results in increased basal expression
but relaxed SM cell specificity and reduced angiotensin
II inducibility. J Biol Chem 273, 8398–8406.
23 Pellegrini L, Tan S & Richmond TJ (1995) Structure of
serum response factor core bound to DNA. Nature 376,
490–498.
24 Mo Y, Ho W, Johnston K & Marmorstein R (2001)
Crystal structure of a ternary SAP-1 ⁄ SRF ⁄ c-fos SRE
DNA complex. J Mol Biol 314, 495–506.
25 West AG, Shore P & Sharrocks AD (1997) DNA bind-
ing by MADS-box transcription factors: a molecular
mechanism for differential DNA bending. Mol Cell Biol
17, 2876–2887.
26 West AG & Sharrocks AD (1999) MADS-box transcrip-
tion factors adopt alternative mechanisms for bending
DNA. J Mol Biol 286, 1311–1323.
27 Deschamps J, Meijlink F & Verma IM (1985) Identifica-
tion of a transcriptional enhancer element upstream
from the proto-oncogene fos. Science 230, 1174–1177.
28 Rodger A & Norden B (1997) Circular dichroism of
biomolecules. In Circular Dichroism and Linear
Dichroism (Compton RG, Davies SG & Evans J, eds),
pp. 15–32. Oxford University Press, Oxford.
29 Deng H, Bloomfield VA, Benevides JM & Thomas GJ
Jr (1999) Dependence of the Raman signature of geno-
mic B-DNA on nucleotide base sequence. Biopolymers
50, 656–666.
30 Movileanu L, Benevides JM & Thomas GJ Jr (1999)
Temperature dependence of the Raman spectrum of
DNA. Part I – Raman signature of premelting and
melting transitions of poly(dA–dT) poly(dA–dT).
J Raman Spectrosc 30, 637–649.
31 Movileanu L, Benevides JM & Thomas GJ Jr (2002)
Determination of base and backbone contributions to
the thermodynamics of premelting and melting transi-
tions in DNA. Nucleic Acids Res 30, 3767–3777.
Implication of CArG sequence in SRE flexibility J. Stepanek et al.
2346 FEBS Journal 274 (2007) 2333–2348 ª 2007 The Authors Journal compilation ª 2007 FEBS
32 Sjoback R, Nygren J & Kubista M (1995) Absorption
and fluorescence properties of fluorescein. Spectrochim
Acta A 51, L7–L21.
33 Ashikawa I, Kinosita K Jr, Ikegami A, Nishimura Y,
Tsuboi M, Watanabe K, Iso K & Nakano T (1983)
Internal motions of deoxyribonucleic acid in chromatin.
Nanosecond fluorescence studies of intercalated
ethidium. Biochemistry 22, 6018–6026.
34 Nordlund TM, Andersson S, Nilsson L, Rigler R,
Graslund A & McLaughlin LW (1989) Structure and
dynamics of a fluorescent DNA oligomer containing the
EcoRI recognition sequence: fluorescence, molecular
dynamics, and NMR studies. Biochemistry 28,
9095–9103.
35 Strobel OK, Keyes RS & Bobst AM (1990) Base
dynamics of local Z-DNA conformations as detected by
electron paramagnetic resonance with spin-labeled
deoxcycytidine analogues. Biochemistry 29, 8522–8528.
36 Hustedt EJ, Spaltenstein A, Kirchner JJ, Hopkins PB &
Robinson BH (1993) Motions of short DNA duplexes:
an analysis of DNA dynamics using an EPR-active
probe. Biochemistry 32, 1774–1787.
37 Ramreddy T, Sen S, Rao BJ & Krishnamoorthy G
(2003) DNA dynamics in rec-a filaments: ATP
hydrolysis-related flexibility in DNA. Biochemistry 42,
12085–12094.
38 Hogan ME & Austin RH (1987) Importance of DNA
stiffness in protein–DNA binding specificity. Nature
329, 263–266.
39 Von Hippel PH & Berg OG (1989) Facilitated target
location in biological systems. J Biol Chem 264, 675–
678.
40 Malinowski ER (2002) Factor Analysis in Chemistry,
3rd edn. Wiley-Interscience, New York.
41 Benevides JM, Overman SA & Thomas GJ Jr (2005)
Raman, polarized Raman and ultraviolet resonance
Raman spectroscopy of nucleic acids and their com-
plexes. J Raman Spectrosc 36, 279–299.
42 Benevides JM & Thomas GJ Jr (2005) Local conforma-
tional changes induced in B-DNA by ethidium interca-
lation. Biochemistry 44, 2993–2999.
43 Hernandez B, Baumruck V, Gouyette C & Ghomi M
(2005) Thermal stability, structural features, and B-to-Z
transition in DNA tetraloop hair pins as determined
by optical spectroscopy in d(CG)3T4(CG)3 and
d(CG)3A4(CG)3 oligonucleotides. Biopolymers 78 ,
21–34.
44 Krafft C, Benevides JM & Thomas GJ Jr (2002) Sec-
ondary structure polymorphism in oxytricha nova telo-
meric DNA. Nucleic Acids Res 30, 3981–3991.
45 Movileanu L, Benevides JM & Thomas GJ Jr (2002)
Temperature dependence of the Raman spectrum of
DNA. II. Raman signature of premelting and melting
transitions of poly(dA) poly(dT) and comparison with
poly(dA–dT) poly(dA–dT). Biopolymers 63, 181–194.
46 Deng H, Bloomfield VA, Benevides JM & Thomas GJ
Jr (2000) Structural basis of polyamine-DNA recogni-
tion: spermidine and spermine interactions with genomic
B-DNAs of different GC content probed by Raman
spectroscopy. Nucleic Acids Res 28, 3379–3385.
47 Benevides JM, Chan G, Lu X-J, Olson WK, Weiss MA
& Thomas GJ Jr (2000) Protein-directed DNA struc-
ture. I. Raman spectroscopy of a high-mobility-group
box with application to human sex reversal. Biochemis-
try 39, 537–547.
48 Benevides JM, Wang AH-J, Van der Marel GA, Van
Boom JH & Thomas GJ Jr (1989) Effect of the G–T
mismatch on backbone and sugar conformation of
Z-DNA and B-DNA: analysis by Raman spectroscopy
of crystal and solutions structures of d(CGCGTG) and
d(CGCGCG). Biochemistry 28, 304–310.
49 Puppels GJ, Otto C & Greve J (1994) Raman
microscopic study of low-pH induced changes in DNA
structure of polytene chromosomes. Biochemistry 33
,
3386–3395.
50 Serban D, Benevides JM & Thomas GJ Jr (2003) HU
protein employs similar mechanisms of minor-groove
recognition in binding to different B-DNA sites:
demonstration by Raman spectroscopy. Biochemistry
42, 7390–7399.
51 Ruiz-Chica AJ, Medina MA, Sanchez-Jiminez F &
Ramirez FJ (2004) Characterization by Raman spectro-
scopy of conformational changes on guanine–cytosine
and adenine–thymine oligonucleotides induced by ami-
nooxy analogues of spermidine. J Raman Spectrosc 35,
93–100.
52 Duhamel J, Kanyo J, Dinter-Gottlieb G & Lu P (1996)
Fluorescence emission of ethidium bromide intercalated
in defined DNA duplexes: evaluation of hydrodynamics
components. Biochemistry 35, 16687–16697.
53 Shatzky-Schwartz M, Arbuckle ND, Eisenstein M,
Rabinovich D, Bareket-Samish A, Haran TE, Luisi BF
& Shakked Z (1997) X-Ray and solution studies of
DNA oligomers and implications for the structural basis
of A-tract-dependent curvature. J Mol Biol 267,
595–623.
54 Yuan H, Quintana J & Dickerson RE (1992) Alternative
structures for alternating poly(dA–dT) tracts: the struc-
ture of the B-DNA decamer C-G-A-T-A-T-A-T-C-G.
Biochemistry 31, 8009–8021.
55 Hunter CA (1993) Sequence-dependent DNA structure.
The role of base stacking interactions. J Mol Biol 230,
1025–1054.
56 El Hassan ME & Calladine CR (1997) Conformational
characteristics of DNA: empirical classifications and a
hypothesis for the conformational behaviour of dinu-
cleotide steps. Phil Trans R Soc Lond A 355, 43–100.
57 Chen YZ & Prohofsky EW (1992) The role of a minor
groove spine of hydration in stabilizing poly(dA)
poly(dT) against fluctuational interbase H-bond
J. Stepanek et al. Implication of CArG sequence in SRE flexibility
FEBS Journal 274 (2007) 2333–2348 ª 2007 The Authors Journal compilation ª 2007 FEBS 2347
disruption in the premelting temperature regime. Nucleic
Acids Res 20, 415–419.
58 Arai S, Chatake T, Ohhara T, Kurihara K, Tanaka I,
Suzuki N, Fujimoto Z, Mizuno H & Niimura N (2005)
Complicated water orientation in the minor groove of
the B-DNA decamer d(CCATTAATGG)2 observed by
neutron diffraction measurements. Nucleic Acids Res 33,
3017–3024.
59 Gustafson TA, Taylor A & Kedes L (1989) DNA bend-
ing is induced by a transcription factor that interacts
with the human c-fos and a-actin promoters. Proc Natl
Acad Sci USA 86, 2162–2166.
60 Bell AF, Hecht L & Barron LD (1998) Evidence for
global mobility in the premelting of a polynucleotide
from temperature-dependent Raman optical activity.
Biospectroscopy 4, 107–111.
61 Heath PJ, Clendenning JB, Fujimoto BS & Schurr JM
(1996) Effect of bending strain on the torsion elastic
constant of DNA. J Mol Biol 260, 718–730.
62 Coleman BD, Olson WK & Swigon D (2003) Theory of
sequence-dependent DNA elasticity. J Chem Phys 118,
7127–7140.
63 Gavish B (1977) The role of geometry and elastic strains in
dynamic states of proteins. Biophys Struct Mech 4, 37–52.
64 Grzeskowiak K, Yanagi K, Prive
´
GG & Dickerson RE
(1991) The structure of B-helical C-G-A-T-C-G-A-T-C-G
and comparison with C-C-A-C-G-T-T-G-G. The effect of
base pair reversals. J Biol Chem 266, 8861–8883.
65 Chou S-H, Cheng J-W, Fedoroff OY, Chuprina VP &
Reid BR (1992) Adjacent G:A mismatch base pairs
contain BII phosphodiesters in solution. J Am Chem
Soc 114, 3114–3115.
66 Chou S-H, Cheng J-W & Reid BR (1992) Adjacent G:A
mismatches stabilized by cross-strand base-stacking and
BII phosphate groups. J Mol Biol 228, 138–155.
67 Tisne
´
C, Hantz E, Hartmann B & Delepierre M (1998)
Solution structure of a non-palindromic 16 base-pair
DNA related to the HIV jB site: evidence for BI–BII
equilibrium inducing a global dynamic curvature of the
duplex. J Mol Biol 279, 127–142.
68 Winger RH, Liedl KR, Rudisser S, Pichler A, Hallbruc-
ker A & Mayer E (1998) B-DNA BI–BII conformer
substate dynamics is coupled with water migration.
J Phys Chem 102, 8934–8940.
69 Gorenstein DG (1992)
31
P NMR of DNA. In Methods
in Enzymology: DNA Structures, Part A, Synthesis and
Physical Analysis of DNA (Lilley DMJ & Dahlberg
JE, eds), Vol. 211, pp. 254–286. Academic Press,
London.
70 Norman C, Runswick M, Pollock R & Treisman R
(1988) Isolation and properties of cDNA clones encod-
ing SRF, a transcription factor that binds to the c-fos
serum response element. Cell 55, 989–1003.
71 Gentin M, Vincent M, Brochon JC, Livesey AK,
Cittanova N & Gallay J (1990) Time-resolved
fluorescence of the single tryptophan residue in rat
alpha-fetoprotein and rat serum albumin: analysis by
the maximum entropy method. Biochemistry 29,
10405–10412.
Implication of CArG sequence in SRE flexibility J. Stepanek et al.
2348 FEBS Journal 274 (2007) 2333–2348 ª 2007 The Authors Journal compilation ª 2007 FEBS