Báo cáo khoa học: A new approach for distinguishing cathepsin E and D activity in antigen-processing organelles pdf
Bạn đang xem bản rút gọn của tài liệu. Xem và tải ngay bản đầy đủ của tài liệu tại đây (799.4 KB, 12 trang )
A new approach for distinguishing cathepsin E and D
activity in antigen-processing organelles
Nousheen Zaidi
1
, Timo Herrmann
1,5
, Daniel Baechle
2
, Sabine Schleicher
3
, Jeannette Gogel
4
,
Christoph Driessen
4
, Wolfgang Voelter
5
and Hubert Kalbacher
1,5
1 Medical and Natural Sciences Research Centre, University of Tu
¨
bingen, Germany
2 PANATecs GmbH, Tu
¨
bingen, Germany
3 Children’s Hospital Department I, University of Tu
¨
bingen, Germany
4 Department of Medicine II, University of Tu
¨
bingen, Germany
5 Interfacultary Institute of Biochemistry, University of Tu
¨
bingen, Germany
Cathepsin E (CatE; EC 3.4.23.34) and D (CatD; EC
3.4.23.5) are the major intracellular aspartic protein-
ases. They have similar enzymatic properties, e.g.
susceptibility to various proteinase inhibitors such as
pepstatin A and similar substrate preferences, as
both prefer bulky hydrophobic amino acids at P1
and P1¢ positions [1]. In addition, both enzymes
have approximately the same acidic pH optimum
towards various protein substrates such as hemo-
globin [2,3].
However, these enzymes have different tissue distri-
bution and cellular localization, suggesting that they
might have more specific physiological functions. CatE
is a nonlysosomal proteinase with a limited distribu-
tion in certain cell types, including gastric epithelial
cells [4], but is mainly present in cells of the immune
Keywords
antigen-presenting cells; cathepsin D;
cathepsin E; enzyme activity assay;
fluorescent substrate
Correspondence
H. Kalbacher, Ob dem Himmelreich 7,
72074 Tu
¨
bingen, Germany
Fax: +49 7071 294507
Tel: +49 7071 2985212
E-mail:
Website: -
tuebingen.de
(Received 27 March 2007, revised 24 April
2007, accepted 25 April 2007)
doi:10.1111/j.1742-4658.2007.05846.x
Cathepsin E (CatE) and D (CatD) are the major aspartic proteinases in the
endolysosomal pathway. They have similar specificity and therefore it is
difficult to distinguish between them, as known substrates are not exclu-
sively specific for one or the other. In this paper we present a substrate-
based assay, which is highly relevant for immunological investigations
because it detects both CatE and CatD in antigen-processing organelles.
Therefore it could be used to study the involvement of these proteinases in
protein degradation and the processing of invariant chain. An assay combi-
ning a new monospecific CatE antibody and the substrate, MOCAc-Gly-
Lys-Pro-Ile-Leu-Phe-Phe-Arg-Leu-Lys(Dnp)-d-Arg-NH
2
[where MOCAc
is (7-methoxycoumarin-4-yl)acetyl and Dnp is dinitrophenyl], is presented.
This substrate is digested by both proteinases and therefore can be used to
detect total aspartic proteinase activity in biological samples. After deple-
tion of CatE by immunoprecipitation, the remaining activity is due to
CatD, and the decrease in activity can be assigned to CatE. The activity of
CatE and CatD in cytosolic, endosomal and lysosomal fractions of B cells,
dendritic cells and human keratinocytes was determined. The data clearly
indicate that CatE activity is mainly located in endosomal compartments,
and that of CatD in lysosomal compartments. Hence this assay can also be
used to characterize subcellular fractions using CatE as an endosomal mar-
ker, whereas CatD is a well-known lysosomal marker. The highest total
aspartic proteinase activity was detected in dendritic cells, and the lowest
in B cells. The assay presented exhibits a lower detection limit than com-
mon antibody-based methods without lacking the specificity.
Abbreviations
CatD, cathepsin D; CatE, cathepsin E; EBV, Epstein–Barr virus; NAG, N-acetyl-b-
D-glucosaminidase; TAPA, total aspartic proteinase activity.
3138 FEBS Journal 274 (2007) 3138–3149 ª 2007 The Authors Journal compilation ª 2007 FEBS
system, such as macrophages [5], lymphocytes [5],
microglia [6] and dendritic cells [7]. It is reported to be
localized in different cellular compartments, such as
plasma membranes [8], endosomal structures [6], endo-
plasmic reticulum and Golgi apparatus [6,9,10]. In
contrast, CatD is a typical lysosomal enzyme widely
distributed in almost all mammalian cells [5,9,11,12].
Studies with CatE-deficient and CatD-deficient mice
have provided additional evidence of the association
of these enzymes with different physiological effects.
CatD-deficient mice develop massive intestinal necrosis
[13], thromboembolia [13], lymphopenia [13], and neur-
onal ceroid lipofuscinosis [14]. CatE-deficient mice are
found to develop atopic dermatitis-like skin lesions
[15]. It was reported recently that CatE-deficient mice
show increased susceptibility to bacterial infection
associated with decreased expression of multiple cell
surface Toll-like receptors [16]. According to a very
recent study [17], CatE deficiency induces a novel form
of lysosomal storage disorder in which there is an
accumulation of lysosomal membrane sialoglycopro-
teins and an increase in lysosomal pH in macrophages.
CatD has also been suggested to play a role in deter-
mining the metastatic potential of several types of can-
cer; high levels of CatD have been found in prostate
[18], breast [19] and ovarian cancer [20]. CatE is
expressed in pancreatic ductal adenocarcinoma [21],
and its presence in pancreatic juice is reported to be a
diagnostic marker for this cancer [22]. Increased con-
centrations of CatE in neurons and glial cells of aged
rats are suggested to be related to neuronal degener-
ation and re-activation of glial cells during the normal
aging process of the brain [23].
CatE and CatD both play an important role in the
MHC class II pathway. CatD is reported to be
involved in processing MHC II-associated invariant
chain [24] in antigen processing and presentation
[25,26]. CatE is also reported to be involved in antigen
processing by B cells [27,28] microglia [29] and murine
dendritic cells [7].
Several studies have determined the subcellular
localization of CatE and CatD in different cell types,
but there are few reports on the activity of these
enzymes in organelles relevant to antigen-processing
[5,30]. Previous reports have described highly selective
substrates for aspartic proteinases, but none of the
substrates described is exclusively specific for CatE or
CatD [30–32]. In most of the studies, additional meth-
ods or inhibitors are used to measure the specific activ-
ity of CatE or CatD. For example, to specifically
determine CatD activity, a CatD digest and pull-down
assay has been described [30]. Other studies have util-
ized a specific inhibitor of CatE, the Ascaris pepsin
inhibitor, which inhibits pepsins and CatE [33], but
does not affect other types of aspartic proteinases
including CatD [31,34]. This inhibitor was originally
isolated from the round worm Ascaris lumbricoides
[35]. However, it is not commercially available.
In the present study, CatE and CatD activities were
determined in subcellular fractions (lysosomal, endo-
somal and cytosolic) of antigen-presenting cells. For
measuring total aspartic proteinase activity (TAPA) in
biological samples, the previously described peptide
substrate MOCAc-Gly-Lys-Pro-Ile-Leu-Phe-Phe-Arg-
Leu-Lys(Dnp)-D-Arg-NH
2
[where MOCAc is (7-meth-
oxycoumarin-4-yl)acetyl and Dnp is dinitrophenyl] [31]
was used, which is digested by both CatE and CatD.
It is an intramolecularly quenched fluorogenic peptide
derivative in which the fluorescent signal of the fluoro-
phore MOCAc is quenched by the chromophoric resi-
due Dnp. After cleavage of the peptide, the quenching
efficiency is decreased, resulting in an increase in
fluorescence. The activity determined in subcellular
fractions was completely inhibited by pepstatin A.
Therefore, this activity can be only attributed to aspar-
tic proteinases and represents TAPA. For the specific
determination of CatE and CatD activity, CatE was
specifically depleted by immunoprecipitation. The
remaining activity is due to CatD, and the decrease in
activity is assigned to CatE. This approach allows the
specific and highly sensitive measurement of both CatE
and CatD activities in biological samples.
Results and Discussion
Expression of CatE mRNA in different cell lines
To determine the expression of CatE at the mRNA
level in different cell lines, RT-PCR was performed
using RNA extracted from DCs (monocyte-derived
human dendritic cells), WT100 [Epstein–Barr virus
(EBV)-transformed B-cell line] and HaCaT (immortal-
ized human keratinocyte cell line). PCR products from
the cell lines were analyzed by gel electrophoresis and
found to contain a band of the expected size (241 bp)
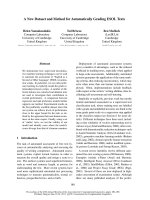
(Fig. 1). As these cell lines were found to be positive
for CatE mRNA, they were used to determine the
enzymatic activity of CatE and CatD. Previous studies
have also shown that murine dendritic cells [7] as well
as another EBV-transformed B-cell line (Fc7) are pos-
itive for CatE mRNA [27].
Determination of antibody specificity
The monospecific antibody for CatE was raised against
the antigenic peptide SRFQPSQSSTYSQPG (CatE
N. Zaidi et al. Determination of cathepsin E and D activity
FEBS Journal 274 (2007) 3138–3149 ª 2007 The Authors Journal compilation ª 2007 FEBS 3139
118–132). This peptide was selected from the CatE
sequence using laser gene software (dnastar, Madi-
son, WI, USA) for antigenicity and surface probabil-
ity. blast tool analysis showed that the selected
peptide sequence does not exhibit significant homology
with sequences in CatD or any other known protein,
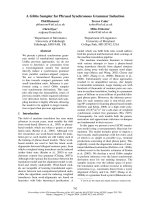
therefore it is specifically present in CatE. Figure 2A
shows sequence alignment of CatE and CatD.
The antiserum obtained was further purified by
affinity chromatography on CH-activated Sepharose
containing the peptide SRFQPSQSSTYSQPG immobi-
lized via stable peptide bonds.
To determine the specificity and cross-reactivity of
the resulting CatE antibody, indirect ELISA, competit-
ive inhibition ELISA (CI-ELISA) and western blot
analysis were performed.
The results of indirect ELISA (Fig. 2B) showed that
the antibody specifically recognized CatE and the anti-
genic peptide SRFQPSQSSTYSQPG used to generate
the antibody, and gave a complete negative reaction
towards CatD.
CI-ELISA was performed to further enhance the
specificity of the antibody. The antibody was preincu-
bated with different concentrations of CatE and CatD,
before a standard ELISA was performed to detect the
antigenic peptide SRFQPSQSSTYSQPG. Preincuba-
tion of CatE with the antibody showed a dose-depend-
ent inhibition of antibody binding (IC
50
¼ 48.6 ng;
Fig. 2C). Increasing concentrations of CatD did not
affect antibody binding. This experiment shows that
CatE specifically binds to the monospecific antibody in
a free system.
Western blot analysis also confirmed that the mono-
specific antibody specifically recognizes CatE and not
CatD (data not shown).
Characterization of subcellular fractions
To control the quality of subcellular fractions,
N-acetyl-b-d-glucosaminidase (NAG; EC 3.2.1.52)
activity was determined, as it is a wide-spread and
well-established marker for endosomal ⁄ lysosomal
compartments [36]. Table 1 shows the activity of
NAG in subcellular fractions of different cell lines.
As expected, all cell lines showed highest NAG
activity in lysosomal fractions with lower activity in
endosomal fractions. Cytosolic fractions had very
low NAG activity.
Western blot analysis of subcellular fractions
from different cell lines used for CatE and CatD
determination
For immunochemical determination of subcellular
localization of CatE and CatD, western blot analysis
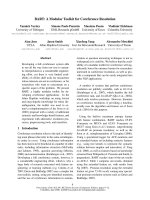
was performed. No CatE was recovered from any sub-
cellular fraction of WT100. Endosomal fractions of
DCs and HaCaT contained a significantly larger
amount of CatE than the respective lysosomal frac-
tions, but no CatE was found in the cytosolic fractions
of any of the cell lines (Fig. 3). As expected, higher
amounts of CatD were detectable in lysosomal frac-
tions. No CatD was detected by western blotting in
the cytosolic fraction of any of the three cell types
(Fig. 3).
Specific inhibition of CatE by
immunoprecipitation
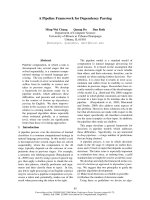
To determine the specificity of our immobilized CatE
antibody in depleting CatE from the samples, we tes-
ted it with CatE and CatD. CatE (recombinant) was
completely immunoprecipitated by the antibody
against CatE (Fig. 4A), whereas it had almost no
effect on CatD activity (Fig. 4B). This approach for
depleting proteinase activity from complex biological
samples is flexible and can be used for other proteinases
as well.
Activity of Cat E and CatD in subcellular fractions
of different cell types
The activity of CatE and CatD was determined in
subcellular fractions of different cell types using a
combination of the peptide substrate, aspartic prote-
inase inhibitor (pepstatin A) and depletion of CatE
by immunoprecipitation. Activities were determined
by linear regression using a minimum of five
measurement points as described in Experimental
CatE (241bp)
M
Negative
Control
DCs
HaCaT
WT100
Fig. 1. CatE expression at mRNA level in different cell lines. Total
RNA was extracted from HaCaT, WT100 and DCs. Equal amounts
of total RNA (2 lg) from each sample were used for RT-PCR. After
reverse transcription, specific primers for human CatE were used
to amplify CatE cDNA.
Determination of cathepsin E and D activity N. Zaidi et al.
3140 FEBS Journal 274 (2007) 3138–3149 ª 2007 The Authors Journal compilation ª 2007 FEBS
procedures. The activity in all subcellular fractions
of these different cell types was completely inhibited
when the samples were preincubated with pepsta-
tin A (TAPA).
For differential measurements of CatE and CatD
activity, samples were subjected to immunoprecipita-
tion of CatE. The decrease in activity after immuno-
precipitation is attributed to CatE, and the
remaining activity is assigned to CatD. As expected,
the highest CatD activity was determined in the lyso-
somal fractions of all three cell types tested [30]. In
contrast, CatE activity was mainly detected in endo-
somal fractions, as indicated in Table 2 and Fig. 5.
A low level of CatD activity was determined in
endosomal fractions of all three cell types. In
HaCaT and DCs, a low level of CatE activity was
found in lysosomal fractions. In the EBV-trans-
formed B-cell line (WT100) an almost equal level of
CatE and CatD activity was found in the lysosomal
fraction, probably because of overlapping subcellular
Fig. 2. (A) Sequence alignment of CatE and
CatD. The alignment was performed using
a conventional
BLAST search engine. Only
the small region of CatE containing the
sequence SRFQPSQSSTYSQPG (antigenic
peptide, CatE 118–132, which was used for
generating monospecific antibody) was
included during the
BLAST operation
(sequence can be seen underlined in the
figure). This peptide was selected from the
CatE sequence using laser gene software
(
DNASTAR, Madison, WI, USA) for antige-
nicity and surface probability.
BLAST tool ana-
lysis showed that the selected peptide
sequence does not exhibit significant homol-
ogy with sequences in CatD or any other
known protein, therefore it is specifically
present in CatE. (B) Determination of specif-
icity of monospecific antibody (raised
against SRFQPSQSSTYSQPG) by indirect
ELISA. The purified monospecific antibody
specifically recognized CatE (10 ng) and the
antigenic peptide (SRFQPSQSSTYSQPG),
and gave a complete negative reaction
towards the same amount of CatD (10 ng).
Values are mean ± SD, n ¼ 3. (Insertion:
10 ng CatE and CatD and 1 ng antigenic
peptide were incubated on an ELISA plate.
CatE and CatD antibodies were used for the
detection at dilutions of 1 : 10000 and
1 : 5000.) (C) Competitive inhibition of anti-
body (raised against SRFQPSQSSTYSQPG)
binding to SRFQPSQSSTYSQPG-coated
plates by CatE. Immunoplates were
coated with antigenic peptide
(SRFQPSQSSTYSQPG; 0.1 lg ⁄ well).
Monospesific antibodies were preincubated
with different concentrations of CatE or
CatD, before standard ELISA. ELISA was
performed as described in Experimental pro-
cedures. The increasing concentration of
CatE caused inhibition of antibody binding
giving the IC
50
value of 48.6 ng. The same
concentrations of CatD had no effect
on antibody binding. Data points are
mean ± SD, n ¼ 2.
N. Zaidi et al. Determination of cathepsin E and D activity
FEBS Journal 274 (2007) 3138–3149 ª 2007 The Authors Journal compilation ª 2007 FEBS 3141
fractions. Cytosolic fractions of all three cell types
showed very low CatE activity, and no CatD activ-
ity. Moreover, the overall activity in the subcellular
fractions of the three cell types tested varied substan-
tially, as did CatE and CatD activity. DCs showed
the highest, and WT100 cells, the lowest overall
activity.
As shown in Table 2, endosomal fractions of
HaCaT showed 5.5-fold higher CatE activity than
the corresponding fractions of WT100, whereas endo-
somal fractions of DCs showed 19 times higher CatE
activity than the endosomal fractions of WT100.
Table 2 also shows that the lysosomal fraction of
HaCaT had 7.2 times higher CatD activity than the
corresponding fraction of WT100, and this subcellular
fraction from DCs had 16.6 times higher CatD activ-
ity than that from WT100.
Analysis of peptide fragments obtained by
digestion of the fluorogenic substrate with
subcellular fractions, CatE or CatD, using
RP-HPLC and MALDI-MS
To further confirm that the activity measured in the
subcellular fractions by the fluorescence assay was only
due to aspartic proteinases, the peptide substrate was
digested by CatE, CatD or subcellular fractions (as
described in Experimental procedures) The peptide
fragments thus generated were separated by RP-HPLC
using fluorescence detection (k
ex
¼ 350, k
em
¼ 450)
and identified by MALDI-MS (Table 3). This method
allowed detection of only N-terminal fragments con-
taining the fluorophore MOCAc.
Figure 6A shows the chromatogram of the undigest-
ed peptide substrate MOCAc-Gly-Lys-Pro-Ile-Leu-
Phe-Phe-Arg-Leu-Lys(Dnp)-d-Arg-NH
2
as a negative
control. The fluorescence signal is quenched as a result
of resonance energy transfer between the fluorophore
Table 1. NAG activity (fluorescence per min per lg protein) in sub-
cellular fractions of different cell lines. Activities were determined
by linear regression analysis taking at least seven measurement
points. Values are mean ± SD (n ¼ 3).
Cell line Subcellular fraction NAG activity
HaCaT Cytosolic 0.5 ± 0.05
Lysosomal 15.2 ± 0.3
Endosomal 7.0 ± 0.37
WT100 Cytosolic 0.4 ± 0.02
Lysosomal 9.6 ± 0.1
Endosomal 2.2 ± 0.07
DCs Cytosolic 0.7 ± 0.07
Lysosomal 25.2 ± 0.07
Endosomal 8.0 ± 0.2
Fig. 3. CatE and CatD expression at protein level in relevant anti-
gen-processing organelles of different cell lines. Equal amounts of
total protein (50 lg) from each sample were applied for SDS ⁄ PAGE
followed by western blot analysis. Representative immunoblots
with the monospecific CatE antibody and reprobe of the same blot
with the CatD antibody are shown. C, Cytosolic fraction; L, lyso-
somal fraction; E, endosomal fraction.
Fig. 4. Effect of immunoprecipitation of CatE and pepstatin A treat-
ment on (A) CatE and (B) CatD activities. (A) (j) Hydrolysis of the
fluorogenic peptide substrate (1 l
M) by 10 ng CatE in 50 mM
sodium acetate buffer (pH 4) at 37 °C. (m) Incubation with pepsta-
tin A for 15 min at 37 °C before hydrolysis reaction inhibited the
activity of CatE completely. (d ) immunoprecipitation of CatE before
hydrolysis reaction also completely inhibited the activity of CatE.
(B) (j) Hydrolysis of the fluorogenic peptide substrate (1 l
M)by
10 ng CatD in 50 m
M sodium acetate buffer (pH 4) at 37 °C. (m)
Incubation with pepstatin A for 15 min at 37 °C before hydrolysis
reaction inhibited the activity of CatD completely. (d) immunopre-
cipitation of CatE before hydrolysis has no effect on CatD activity,
hence immunoprecipitation was specific for CatE only.
Determination of cathepsin E and D activity N. Zaidi et al.
3142 FEBS Journal 274 (2007) 3138–3149 ª 2007 The Authors Journal compilation ª 2007 FEBS
and the quencher group. Figure 6B shows the results
of digestion of the substrate with CatE, leading to only
one cleavage product, because only the Phe-Phe bond
is susceptible to cleavage by CatE or CatD [31]. The
peak with a retention time of 25.54 min corresponds
to the fragment, MOCAc-Gly-Lys-Pro-Ile-Leu-Phe, as
analyzed by MALDI-MS (Table 3). Figure 6C shows
digestion of the substrate with CatD, giving a profile
similar to that of CatE, i.e. only one peak is visible
with the same retention time. However, when digested
with the lysosomal fraction of HaCaT (Fig. 6E), an
additional peak with a retention time of 22.87 min was
observed. Digestion of substrate with the endosomal
fraction of HaCaT (Fig. 6F) gave a similar RP-HPLC
profile to the lysosomal fraction.
Digestion of the substrate with lysosomal and endo-
somal fractions (Fig. 6H,I) was completely inhibited
by pepstatin A, confirming that the activity observed
in our assay was solely due to aspartic proteinases.
The additional peak observed after digestion of the
substrate with these fractions (Fig. 6E,F) was a C-ter-
minal-truncated peptide (MOCAc-Gly-Lys-Pro-Ile-
Leu), as analyzed by MALDI-MS. This carboxypeptidase
activity can only occur after aspartic proteinases have
created cleavage products, as the undigested substrate
contains a protective d-Arg residue at the C-terminus.
Substrate digestion by the lysosomal fraction
(Fig. 6K) after immunoprecipitation of CatE had almost
no effect on the RP-HPLC profile. This indicates that
the activity observed in the lysosomal fraction was
mainly due to CatD. Digestion by the endosomal frac-
tion (Fig. 6L) was inhibited after immunoprecipitation
of CatE, indicating that the activity in this fraction was
primarily CatE activity. No cleavage was indicated in the
cytosolic fraction, hence no CatE or CatD activity was
observed by RP-HPLC. This agrees with the results from
the fluorescence assay, in which only very low activity
was determined in the cytosolic fraction. Digestion of
substrate with subcellular fractions of DCs and WT100
gave similar RP-HPLC profiles (data not shown).
In conclusion, the combination of methods described
here facilitates the specific and parallel measurement of
CatE and CatD activity in antigen-processing organ-
elles. The data clearly show that our approach for
detecting CatE and CatD is more sensitive than immu-
nodetection by western blot analysis. It allows detec-
tion of CatE activity in subcellular fractions of
WT100, as compared to western blot analysis by which
no CatE was detectable in any WT100 fraction. It was
also possible to discriminate between CatD activity in
endosomal and lysosomal fractions, whereas the distri-
bution of CatD in lysosomal and endosomal fractions
was not significantly distinguishable when detected by
western blot.
Theses experimental conditions are also more speci-
fic than previous assays, because specificity of detec-
tion was not only based on the peptide sequence but
was markedly increased by the use of a monospecific
antibody used to deplete CatE. This type of assay is
flexible and can be used to discriminate activity of
other proteinases with similar enzymatic properties.
This approach distinguishes between the activities of
the enzymatically similar proteinases, CatE and CatD,
and can therefore be used to investigate the involvement
of these enzymes in antigen processing and presentation.
Experimental procedures
Enzymes and chemicals
CatD (bovine kidney) was purchased from Calbiochem
(Darmstadt, Germany) and stored as a 300 UÆmL
)1
stock
solution in 0.1 m sodium citrate buffer, pH 4.5, at )20 °C.
CatE was purchased from R&D systems (Wiesbaden,
Germany) and stored as a 0.1 mgÆmL
)1
stock solution in
50 mm sodium citrate buffer, pH 6.5, containing 150 mm
Table 2. CatE and CatD activity (pmol MOCAc liberated per min per 20 lg total protein) in subcellular fractions of different cell lines. Activit-
ies were determined by linear regression analysis taking at least five measurement points. Values are mean ± SD (DCs, n ¼ 2; HaCaT and
WT100, n ¼ 3; where n is the number of individual experiments performed). ND, not detectable.
Cell line Activity Cytosolic fraction Lysosomal fraction Endosomal fraction
HaCaT TAPA 13.4 ± 2.15 106.3 ± 6.94 82.0 ± 11.33
Cat E 13.4 ± 2.15 25.3 ± 14.01 65.4 ± 11.22
Cat D ND 80.9 ± 12 16.6 ± 8.40
WT100 TAPA 0.49 ± 0.19 20.9 ± 1.99 13.7 ± 0.69
Cat E 0.49 ± 0.19 9.5 ± 0.54 11.8 ± 1.23
Cat D ND 11.3 ± 2.54 1.9 ± 0.77
DCs TAPA 0.76 ± 0.24 210.7 ± 18.40 232.8 ± 49.65
Cat E 0.76 ± 0.24 23.2 ± 20.54 225.7 ± 50.38
Cat D ND 187.5 ± 2.19 7.1 ± 0.72
N. Zaidi et al. Determination of cathepsin E and D activity
FEBS Journal 274 (2007) 3138–3149 ª 2007 The Authors Journal compilation ª 2007 FEBS 3143
NaCl at )20 °C. Pepstatin A (Calbiochem) was dissolved in
methanol. Activated CH Sepharose 4B was purchased from
Amersham Biosciences (Munich, Germany). The substrate
MOCAc-Gly-Lys-Pro-Ile-Leu-Phe-Phe-Arg-Leu-Lys(Dnp)-d-
Arg-NH
2
[31] was obtained from Bachem (Weil am Rhein,
Germany).
Generation and immobilization of a monospecific
CatE antibody
The antigenic peptide SRFQPSQSSTYSQPG (CatE 118–
132) was selected from the protein sequence using the laser
gene software (dnastar, Madison, WI, USA) and
controlled for specificity to CatD. It was synthesized as a
single peptide and as a multiple antigen peptide, (SRFQPS-
QSSTYSQPG)
8
-(Lys)
4
-(Lys)
2
-Lys-Gly-OH, using standard
Fmoc ⁄ tBu [37] chemistry on a multiple peptide synthesizer,
Syro II (MultiSynTech, Witten, Germany). The peptides
were purified using RP-HPLC and the identity was con-
firmed using ESI-MS. Peptide purities were determined by
analytical RP-HPLC and were >90%. The single peptide
was coupled to key hole limpet hemocycanin using the glu-
tardialdehyde method. The antiserum was obtained after
repeated immunization of a rabbit with a 1 : 1 mixture of
the peptide–key hole limpet hemocycanin conjugate and the
multiple antigen peptide. This antiserum was further puri-
fied by affinity chromatography on a CH-activated Seph-
arose 4B column (Amersham Biosciences) containing the
peptide immobilized via a stable peptide bond. Peptide
immobilization was performed as described by the manu-
facturer. The antiserum was applied to the column at
0.5 mLÆmin
)1
and recycled overnight. The column was
washed with 20 column volumes of NaCl ⁄ P
i
(Gibco Life
Technologies, Paisley, UK). Elution was performed with 10
volumes of 0.1 m glycine ⁄ HCl (pH 2.5). Antibody-contain-
ing fractions were immediately neutralized with 1 m
Tris ⁄ HCl (pH 8.5) and then concentrated on a 20-kDa
membrane. The resulting antibody was retested by ELISA
and showed the expected specificity to the peptide epitopes
and the CatE protein, but a completely negative reaction to
CatD. The purified monospecific antibody was immobilized
on CH-activated Sepharose as described by the manufac-
turer. After coupling for 3 h at room temperature, the gel
was deactivated with 0.1 m Tris ⁄ HCl, pH 8.0, for an addi-
tional 2 h at room temperature. To block any remaining
active sites, the material was further incubated with 5%
BSA for an additional 2 h. After a wash with NaCl ⁄ P
i
, the
immobilized antibody was stored in NaCl ⁄ P
i
containing
0.02% (w ⁄ v) NaN
3
at 4 °C.
ELISA
The wells of microtiter plates (Nunc Brand Products, Maxi-
Sorb surface, Wiesbaden, Germany) were coated with CatE
(10 ng), CatD (10 ng) or the peptide SRFQPSQSSTYSQPG
(1 ng) in NaCl ⁄ P
i
in a final volume of 100 lL ⁄ well at 4 °C
overnight. The plates were washed three times with 200 lL
washing buffer (NaCl ⁄ P
i
⁄ 0.05% Tween 20, pH 7.0) and
blocked with blocking buffer (NaCl ⁄ P
i
⁄ 0.05% Tween 20,
pH 7.0, containing 2% BSA) for 2 h at 37 °C. After a
wash, the plates were treated for 1 h at 37 °C with our
monospecific CatE antibody (diluted in NaCl ⁄ P
i
⁄ 0.05%
Tween 20, pH 7.0, containing 0.5% BSA) or commercial
CatD antibody. After a wash, the plates were incubated
with horseradish peroxidase-conjugated goat anti-rabbit Ig
(Dianova, Hamburg, Germany; 1 : 5000 diluted in
NaCl ⁄ P
i
⁄ 0.05% Tween 20 ⁄ 0.5% BSA). Then 100 lL azino-
diethylbenzthiazoline sulfonate ⁄ H
2
O
2
in substrate buffer
0 20 40 60 80 100 120
Endosomes
Lysosomes
Cytosol
Endosomes
Lysosomes
Cytosol
Endosomes
Lysosomes
Cytosol
pmol MOCAc liberated/min/20µg total protein
0 50 100 150 200 250 300
p
mol MOCAc liberated/min/20
µg
total
p
rotein
0 5 10 15 20 25
pmol MOCAc liberated/min/20µg total protein
TAPA
CatE activity
CaD activity
TAPA
CatE activity
CaD activity
TAPA
CatE activity
CaD activity
A
B
C
Fig. 5. Distribution of TAPA, CatE and CatD activity in subcellular
fractions of the cell lines (A) HaCaT, (B) WT100 and (C) DCs. Equal
amounts of total protein (20 lg) were used for the determination of
CatE and CatD activities, determined by linear regression analysis
using a minimum of five measurement points. Values are
mean ± SD (DCs, n ¼ 2; HaCaT and WT100, n ¼ 3; where n is the
number of individual experiments).
Determination of cathepsin E and D activity N. Zaidi et al.
3144 FEBS Journal 274 (2007) 3138–3149 ª 2007 The Authors Journal compilation ª 2007 FEBS
(100 mm sodium citrate buffer, pH 4.5) was added per well,
and the colour development analyzed at a wavelength of
405 nm.
For competitive inhibition ELISA, antiserum was prein-
cubated with different concentrations of CatE or CatD
(40 min, room temperature) and then used as primary anti-
body for standard ELISA to detect the antigenic peptide
SRFQPSQSSTYSQPG (0.1 lg ⁄ well).
Cell culture
The EBV-transformed human B-cell line, WT100, and the
immortalized human keratinocyte cell line, HaCaT, were
cultured in RPMI 1640 medium (Gibco Life Technol-
ogies) supplemented with 10% (v ⁄ v) heat-inactivated fetal
calf serum (Gibco), penicillin (final concentration
100 UÆmL
)1
; Gibco) and streptomycin (final concentration
0.1 mgÆmL
)1
; Gibco) at 37 °C in tissue culture flasks
(Nunc).
Peripheral blood mononuclear cells were isolated by
Ficoll ⁄ Paque (PAA Laboratories, Pasching, Austria) den-
sity gradient centrifugation of heparinized blood obtained
from buffy coats. Isolated peripheral blood mononuclear
cells were plated (1 · 10
8
cells ⁄ 8 mL flask) into 75 cm
2
Cellstar tissue culture flasks (Greiner Bio-One GmbH, Fric-
kenhausen, Germany) in RPMI 1640 under the same cul-
ture conditions as for WT100 and HaCaT. After 1.5 h of
incubation at 37 °C, nonadherent cells were removed and
adherent cells were cultured in complete culture medium
supplemented with granulocyte ⁄ macrophage colony-stimu-
lating factor (Leukomax; Sandoz, Basel, Switzerland) and
interleukin 4 (R&D systems) for 6 days as described previ-
ously [38]. This resulted in a cell population consisting of
70% DCs (data not shown), as determined by flow
cytometry (BD FACSCalibur, Heidelberg, Germany).
Determination of CatE mRNA expression levels
using RT-PCR
RNA was extracted from DCs, WT100 and HaCaT cells
using the TRIazol reagent as described by the manufacturer
(Invitrogen, Karlsruhe, Germany). Reverse transcription of
2 lg total RNA was initialized by 200 U Superscript II
reverse transcriptase (Invitrogen), 4 lL synthesis buffer
(fivefold concentrated; Invitrogen), 2.5 lL Random Primers
(10 mm; Promega, Mannheim, Germany), 1 lL dithiothrei-
tol (100 mm; Invitrogen), 1 lL dNTP mix (10 mm; Prome-
ga) and 0.5 lL rRNAsin (Promega) in a final volume of
20 lL. After incubation at room temperature for 10 min,
the reaction mixtures were set to 42 °C for 1 h. Then
amplification was carried out, adding 5 lL generated
cDNA to 45 lL reaction mixture [11.0% (v ⁄ v) 10-fold
PCR buffer (Roche, Basel, Switzerland), 3.3% (v ⁄ v) both
primers (5¢-CATGATGGAATTACGTT-3¢ and 5¢-GA
ATGATCCAGGTACAGCAT-3¢)10lm each (Operon
Technologies Alameda, CA, USA), 2.2% (v ⁄ v) dNTP mix
(10 mm; Promega) in molecular-grade water and 1.1%
(v ⁄ v) Taq DNA polymerase (Roche)] and running 35 cycles
each for 35 s at 94 °C, 30 s at 50 °C, and 60 s at 72 °C.
Single PCR amplicons were analysed using agarose gel
electrophoresis.
Subcellular fractionation and western blot
analysis
Cell fractionation was performed as previously described by
Schroter et al. [39]. Briefly, (4–8) · 10
7
cells were harvested,
resuspended in 1.5 mL fractionation buffer (10 mm
Tris ⁄ HCl buffer, 250 mm sucrose, pH 6.8), and then homo-
genized using a cell cracker (HGM Laboratory Equipment,
Heidelberg, Germany). Then debris was separated by cen-
trifugation at 8000 g for 10 min with a Minifuge RF 2150
(Heraeus, Osterode, Germany). Mitochondria and the
endolysosomal fractions were separated by ultracentrifuga-
tion at 100 000 g for 5 min (Beckman TL100 ultracentri-
fuge, Palo Alto, CA, USA). Finally, lysosomes were
separated from endosomes by hypotonic lysis with double-
distilled water ( 2.5-fold of the pellet volume for keratino-
cytes and DCs, and fivefold of the pellet volume for B cells)
and centrifugation at 100 000 g for 5 min with a Beckman
TL100 ultracentrifuge. Lysosomal material was released
into the supernatant, and endosomes remained in the
pellet. Total protein content was determined as described
by Bradford [40].
Table 3. Peptides after digestion of fluorogenic peptide substrate by CatE, CatD and subcellular fractions of HaCaT identified by MALDI-MS.
Retention times allude to those in Fig. 6.
Sample Digestion products
Retention time
(min)
Expected mass
[M +H]
+
[M +H]
+
DDa
CatE MOCAc-GLPILF-OH 25.54 890.80 890.77 0.03
CatD MOCAc-GLPILF-OH 25.19 890.80 891.76 0.96
Lysosomal fraction MOCAc-GLPILF-OH 25.90 890.80 890.90 0.1
MOCAc-GLPIL-OH 22.87 743.70 743.70 0.0
Endosomal fraction MOCAc-GLPILF-OH 25.44 890.80 890.80 0.0
MOCAc-GLPIL-OH 22.38 743.70 743.80 0.1
N. Zaidi et al. Determination of cathepsin E and D activity
FEBS Journal 274 (2007) 3138–3149 ª 2007 The Authors Journal compilation ª 2007 FEBS 3145
Subcellular fractions were separated by SDS ⁄ PAGE
(50 lg total protein per lane) on a 12% separating gel
and transferred to a poly(vinylidene difluoride) membrane
(Amersham Biosciences, Freiburg, Germany). Membranes
were then blocked for 1 h using NaCl ⁄ Tris [0.15 m
NaCl, 10 mm Tris ⁄ HCl, 0.05% (v ⁄ v) Tween 20, pH 8.0]
containing 10% (v ⁄ v) RotiÒ Block (Roth, Karlsruhe,
Germany). Rabbit antibody to human CatD (Calbio-
chem) was diluted 1 : 5000, and rabbit antibody to
human CatE was diluted 1 : 2000. Western blots were
developed according to the ECL protocol of Amersham
Biosciences.
Detection of NAG activity
NAG activity was measured as described by Schmid et al.
[36]. Briefly, 1 lg protein from each fraction was added to
100 lL 0.1 m citrate buffer, pH 5, containing 0.8 mm
4-methylumbelliferyl-N-acetyl-b-d-glucosaminide (Sigma,
Deisenhofen Germany) and 0.1% Triton X-100. Fluores-
cence (k
ex
¼ 360 nm, k
em
¼ 465 nm) was measured every
5 min at 37 °C using a fluorescence reader (Tecan Spectra
Fluor, Crailsheim, Germany). NAG activity was deter-
mined by linear regression using a minimum of seven meas-
urement points.
A Undigested substrate B Substrate + CatE C Substrate + CatD
Relative Fluorescence Relative Fluorescence Relative Fluorescence
25.54
5
10
15
20
25
30
35
25.19
5
10
15
20
25
30
35
5
10
15
20
25
30
35
5
10
15
20
25
30
35
5
10
15
20
25
30
35
5
10
15
20
25
30
35
22.87
25.90
5
10
15
20
25
30
35
22.38
25.44
5
10
15
20
25
30
35
22.91
25.92
5
10
15
20
25
30
35
5
10
15
20
25
30
35
5
10
15
20
25
30
35
Elution time (min)
D Substrate + CF E Substrate + LF F Substrate + EF
G Substrate + CF + PepA H Substrate + LF + PepA I Substrate + EF + PepA
J Substrate + CF (IP) K Substrate + LF (IP) L Substrate + EF (IP)
5
10
15
20
25
30
35
Fig. 6. RP-HPLC profiles of peptide fragments obtained after digestion of the substrate with CatE, CatD or subcellular fractions of HaCaT.
Fluorogenic peptide substrate (10 l
M) was incubated at 37 °C in digestion buffer (50 mM sodium acetate buffer, pH 4.0) containing CatE
(10 ng), CatD (10 ng) or a subcellular fraction (20 lg). (A) Undigested fluorogenic substrate, MOCAc-Gly-Lys-Pro-Ile-Leu-Phe-Phe-Arg-Leu-
Lys(Dnp)-
D-Arg-NH2. Substrate digested with (B) CatE, (C) CatD, (D) cytosolic fraction (CF), (E) lysosomal fraction (LF), (F) endosomal fraction
(EF), (G) cytosolic fraction after pepstatin A treatment, (H) lysosomal fraction after pepstatin A treatment, (I) endosomal fraction after pepsta-
tin A treatment, (J) cytosolic fraction after immunoprecipitation of CatE, (K) lysosomal fraction after immunoprecipitation of CatE, and (L)
endosomal fraction after immunoprecipitation of CatE.
Determination of cathepsin E and D activity N. Zaidi et al.
3146 FEBS Journal 274 (2007) 3138–3149 ª 2007 The Authors Journal compilation ª 2007 FEBS
Parallel detection of CatE and CatD activity
TAPA and specific catalytic activities of CatE and CatD
were determined fluorimetrically by hydrolysis of the
substrate MOCAc-Gly-Lys-Pro-Ile-Leu-Phe-Phe-Arg-Leu-
Lys(Dnp)-d-Arg-NH
2
. Appropriate amounts of CatE,
CatD or subcellular fraction (20 lg total protein) were
added to 80 lL digestion buffer (50 mm sodium acetate
buffer, pH 4.0), and the reaction was started by the addi-
tion of 1 lL substrate solution (stock solution 2 mm in
dimethyl sulfoxide). Fluorescent product formation was
recorded using a fluorescence reader (Tecan Spectra Fluor)
on kinetic mode at 37 ° C(k
ex
¼ 340, k
em
¼ 405). Activities
were determined by linear regression analysis using a mini-
mum of five measurement points. All the experiments were
performed in triplicate yielding TAPA, i.e. CatE and CatD
activity. Aspartic proteinase activity could be completely
inhibited using 1 lL1mm pepstatin A solution in meth-
anol (1 lL methanol showed no inhibitory effect).
For the specific determination of CatE activity, samples
were subjected to immunoprecipitation of CatE before the
above assay. Then 20 lg total protein from each subcellular
fraction was incubated with 20 lL monospecific CatE anti-
body immobilized on CH-activated Sepharose at 4 °C over-
night. With this method, the measured increase in
fluorescence intensity is exclusively caused by CatD. The
difference between total aspartic proteinase and CatD activ-
ity can be assigned to CatE activity.
Analytical RP-HPLC
The fluorogenic peptide substrate (1 mm in dimethyl sulfox-
ide; 1 lL) was incubated at 37 °Cin80lL digestion buffer
(50 mm sodium acetate buffer, pH 4.0) containing the appro-
priate amount of CatE, CatD or a subcellular fraction (with
or without pepstatin A treatment or after immunoprecipita-
tion of CatE). The reaction was terminated by addition
of 25 lL stop solution [5% (v ⁄ v) acetonitrile, 1% (v ⁄ v) tri-
fluoroacetic acid] in water. Then 5 lL of the reaction mixture
was separated by analytical RP-HPLC using a C8 column
(150 · 2 mm; Reprosil 100; Dr Maisch GmbH, Tu
¨
bingen,
Germany) with the following solvent systems: (A) 0.055%
(v ⁄ v) trifluoroacetic acid in water and (B) 0.05% (v ⁄ v) tri-
fluoroacetic acid in 80% (v ⁄ v) acetonitrile in water. Elution
was performed using a linear gradient from 5% to 80% sol-
vent B within 35 min. Fluorescence detection was carried out
at k
em.
¼ 350 and k
ex
¼ 450. Appropriate fractions were
collected and analysed by MALDI-MS.
MALDI-MS
First, 0.5 lL each RP-HPLC fraction was mixed with
0.5 lL DHB-matrix [10 mgÆmL
)1
(w ⁄ v) 2,5-dihydroxy-
benzoic acid in 60% (v ⁄ v) ethanol containing 0.1% (v ⁄ v)
trifluoroacetic acid] and applied to a gold target for
MALDI-MS using a MALDI-TOF system (Reflex IV,
serial number 26159.00007; Bruker Daltonics, Bremen, Ger-
many). Signals were generated by accumulating 120–210
laser shots. Raw data were analyzed using the software
Flex Analysis 2.4 (Bruker Daltonics).
Acknowledgements
We gratefully acknowledge Andreas Dittmar and Flo-
rian Kramer for their technical assistance. This work
was supported by Deutsche Forschungsgemeinschaft
(SFB 685), Higher Education Commission Pakistan,
and German Academic Exchange Service (DAAD),
Germany.
References
1 Kay J & Dunn BM (1992) Substrate specificity and inhi-
bitors of aspartic proteinases. Scand J Clin Lab Invest
Suppl 210, 23–30.
2 Yamamoto K, Katsuda N, Himeno M & Kato K
(1979) Cathepsin D of rat spleen. Affinity purification
and properties of two types of cathepsin D. Eur J
Biochem 95, 459–467.
3 Takeda M, Ueno E, Kato Y & Yamamoto K (1986)
Isolation, and catalytic and immunochemical properties
of cathepsin D-like acid proteinase from rat erythro-
cytes. J Biochem (Tokyo) 100, 1269–1277.
4 Muto N, Yamamoto M, Tani S & Yonezawa S (1988)
Characteristic distribution of cathepsin E which immu-
nologically cross-reacts with the 86-kDa acid proteinase
from rat gastric mucosa. J Biochem (Tokyo) 103, 629–
632.
5 Sakai H, Saku T, Kato Y & Yamamoto K (1989)
Quantitation and immunohistochemical localization
of cathepsins E and D in rat tissues and blood cells.
Biochim Biophys Acta 991, 367–375.
6 Sastradipura DF, Nakanishi H, Tsukuba T, Nishishita
K, Sakai H, Kato Y, Gotow T, Uchiyama Y &
Yamamoto K (1998) Identification of cellular com-
partments involved in processing of cathepsin E in
primary cultures of rat microglia. J Neurochem 70,
2045–2056.
7 Chain BM, Free P, Medd P, Swetman C, Tabor AB &
Terrazzini N (2005) The expression and function of
cathepsin E in dendritic cells. J Immunol 174, 1791–1800.
8 Yoshimine Y, Tsukuba T, Isobe R, Sumi M, Akamine
A, Maeda K & Yamamoto K (1995) Specific immuno-
cytochemical localization of cathepsin E at the ruffled
border membrane of active osteoclasts. Cell Tissue Res
281, 85–91.
9 Saku T, Sakai H, Shibata Y, Kato Y & Yamamoto K
(1991) An immunocytochemical study on distinct
N. Zaidi et al. Determination of cathepsin E and D activity
FEBS Journal 274 (2007) 3138–3149 ª 2007 The Authors Journal compilation ª 2007 FEBS 3147
intracellular localization of cathepsin E and cathepsin D
in human gastric cells and various rat cells. J Biochem
(Tokyo) 110, 956–964.
10 Tsukuba T, Hori H, Azuma T, Takahashi T, Taggart
RT, Akamine A, Ezaki M, Nakanishi H, Sakai H &
Yamamoto K (1993) Isolation and characterization of
recombinant human cathepsin E expressed in Chinese
hamster ovary cells. J Biol Chem 268, 7276–7282.
11 Snyder DS, Simonis S, Uzman BG & Whitaker JN
(1985) Rat neural tissue cathepsin D: ultrastructural
immunocytochemistry. J Neurocytol 14, 579–596.
12 Yokota S & Atsumi S (1983) Immunoelectron micro-
scopic localization of cathepsin D in lysosomes of rat
nerve cells. Histochemistry 79, 345–352.
13 Saftig P, Hetman M, Schmahl W, Weber K, Heine L,
Mossmann H, Koster A, Hess B, Evers M, von Figura
K, et al. (1995) Mice deficient for the lysosomal protein-
ase cathepsin D exhibit progressive atrophy of the intes-
tinal mucosa and profound destruction of lymphoid
cells. EMBO J 14, 3599–3608.
14 Koike M, Nakanishi H, Saftig P, Ezaki J, Isahara K,
Ohsawa Y, Schulz-Schaeffer W, Watanabe T, Waguri S,
Kametaka S, et al. (2000) Cathepsin D deficiency indu-
ces lysosomal storage with ceroid lipofuscin in mouse
CNS neurons. J Neurosci 20, 6898–6906.
15 Tsukuba T, Okamoto K, Okamoto Y, Yanagawa M,
Kohmura K, Yasuda Y, Uchi H, Nakahara T, Furue
M, Nakayama K, et al. (2003) Association of cathepsin
E deficiency with development of atopic dermatitis.
J Biochem (Tokyo) 134, 893–902.
16 Tsukuba T, Yamamoto S, Yanagawa M, Okamoto K,
Okamoto Y, Nakayama KI, Kadowaki T & Yamamoto
K (2006) Cathepsin E-deficient mice show increased sus-
ceptibility to bacterial infection associated with the
decreased expression of multiple cell surface Toll-like
receptors. J Biochem (Tokyo) 140, 57–66.
17 Yanagawa M, Tsukuba T, Nishioku T, Okamoto Y,
Okamoto K, Takii R, Terada Y, Nakayama KI,
Kadowaki T & Yamamoto K (2007) Cathepsin E
deficiency induces a novel form of lysosomal storage
disorder showing the accumulation of lysosomal
membrane sialoglycoproteins and the elevation of lyso-
somal pH in macrophages. J Biol Chem 282, 1851–1862.
18 Hara I, Miyake H, Yamanaka K, Hara S & Kamidono
S (2002) Serum cathepsin D and its density in men with
prostate cancer as new predictors of disease progression.
Oncol Rep 9, 1379–1383.
19 Duffy MJ, Brouillet JP, Reilly D, McDermott E, O’Hig-
gins N, Fennelly JJ, Maudelonde T & Rochefort H
(1991) Cathepsin D concentration in breast cancer cyto-
sols: correlation with biochemical, histological, and clin-
ical findings. Clin Chem 37, 101–104.
20 Kozyreva EA, Zhordaniia KI, Bassalyk LS & Vasil’ev
AV (1991) Proteolytic lysosomal enzymes in ovarian
cancer. Vopr Med Khim 37, 20–23.
21 Azuma T, Hirai M, Ito S, Yamamoto K, Taggart RT,
Matsuba T, Yasukawa K, Uno K, Hayakumo T &
Nakajima M (1996) Expression of cathepsin E in pan-
creas: a possible tumor marker for pancreas, a prelimin-
ary report. Int J Cancer 67, 492–497.
22 Uno K, Azuma T, Nakajima M, Yasuda K, Hayakumo
T, Mukai H, Sakai T & Kawai K (2000) Clinical signifi-
cance of cathepsin E in pancreatic juice in the diagnosis
of pancreatic ductal adenocarcinoma. J Gastroenterol
Hepatol 15, 1333–1338.
23 Nakanishi H, Tominaga K, Amano T, Hirotsu I, Inoue
T & Yamamoto K (1994) Age-related changes in activ-
ities and localizations of cathepsins D, E, B, and L in
the rat brain tissues. Exp Neurol 126, 119–128.
24 Zhang T, Maekawa Y, Hanba J, Dainichi T, Nashed
BF, Hisaeda H, Sakai T, Asao T, Himeno K, Good RA
& Katunuma N (2000) Lysosomal cathepsin B plays an
important role in antigen processing, while cathepsin D
is involved in degradation of the invariant chain inoval-
bumin-immunized mice. Immunology 100, 13–20.
25 Hewitt EW, Treumann A, Morrice N, Tatnell PJ, Kay J
& Watts C (1997) Natural processing sites for human
cathepsin E and cathepsin D in tetanus toxin: implica-
tions for T cell epitope generation. J Immunol 159,
4693–4699.
26 Rhodes JM & Andersen AB (1993) Role of cathepsin D
in the degradation of human serum albumin by perito-
neal macrophages and veiled cells in antigen presenta-
tion. Immunol Lett 37, 103–110.
27 Sealy L, Mota F, Rayment N, Tatnell P, Kay J &
Chain B (1996) Regulation of cathepsin E expression
during human B cell differentiation in vitro. Eur J
Immunol 26, 1838–1843.
28 Bennett K, Levine T, Ellis JS, Peanasky RJ, Samloff
IM, Kay J & Chain BM (1992) Antigen processing for
presentation by class II major histocompatibility com-
plex requires cleavage by cathepsin E. Eur J Immunol
22, 1519–1524.
29 Nishioku T, Hashimoto K, Yamashita K, Liou SY,
Kagamiishi Y, Maegawa H, Katsube N, Peters C, von
Figura K, Saftig P, et al. (2002) Involvement of cathep-
sin E in exogenous antigen processing in primary cul-
tured murine microglia. J Biol Chem. 277, 4816–4822.
30 Baechle D, Cansier A, Fischer R, Brandenburg J, Bur-
ster T, Driessen C & Kalbacher H (2005) Biotinylated
fluorescent peptide substrates for the sensitive and speci-
fic determination of cathepsin D activity. J Pept Sci 11,
166–174.
31 Yasuda Y, Kageyama T, Akamine A, Shibata M, Kom-
inami E, Uchiyama Y & Yamamoto K (1999) Charac-
terization of new fluorogenic substrates for the rapid
and sensitive assay of cathepsin E and cathepsin D.
J Biochem (Tokyo) 125, 1137–1143.
32 Yasuda Y, Kohmura K, Kadowaki T, Tsukuba T &
Yamamoto K (2005) A new selective substrate for
Determination of cathepsin E and D activity N. Zaidi et al.
3148 FEBS Journal 274 (2007) 3138–3149 ª 2007 The Authors Journal compilation ª 2007 FEBS
cathepsin E based on the cleavage site sequence of
alpha2-macroglobulin. Biol Chem 386, 299–305.
33 Keilova H & Tomasek V (1972) Effect of pepsin inhibi-
tor from Ascaris lumbricoides on cathepsin D and E.
Biochim Biophys Acta 284, 461–464.
34 Jupp RA, Richards AD, Kay J, Dunn BM, Wyckoff
JB, Samloff IM & Yamamoto K (1988) Identification of
the aspartic proteinases from human erythrocyte mem-
branes and gastric mucosa (slow-moving proteinase) as
catalytically equivalent to cathepsin E. Biochem J 254,
895–898.
35 Abu-Erreish GM & Peanasky RJ (1974) Pepsin inhibi-
tors from Ascaris lumbricoides. Isolation, purification,
and some properties. J Biol Chem 249, 1558–1565.
36 Schmid H, Lindmeier I, Schmitt H, Eissele R, Neuhaus
G & Wehrmann M (1993) Nephrotoxicity of cyclospor-
ine A in the rat. II. Reversible changes in intranephronal
and urinary catalytic activities of N-acetyl-beta-D-gluco-
saminidase. Ren Physiol Biochem 16, 222–232.
37 Chan WC & White PD (2000) Basic procedure. In Fmoc
Solid Phase Peptide Synthesis: A Practical Approach
(Chan WC & White PD, eds), pp. 41–74. Oxford
University Press, Oxford.
38 Lautwein A, Burster T, Lennon-Dumenil AM, Overkle-
eft HS, Weber E, Kalbacher H & Driessen C (2002)
Inflammatory stimuli recruit cathepsin activity to late
endosomal compartments in human dendritic cells. Eur
J Immunol 32, 3348–3357.
39 Schroter CJ, Braun M, Englert J, Beck H, Schmid H &
Kalbacher H (1999) A rapid method to separate endo-
somes from lysosomal contents using differential centri-
fugation and hypotonic lysis of lysosomes. J Immunol
Methods 227, 161–168.
40 Bradford MM (1976) A rapid and sensitive method for
the quantitation of microgram quantities of protein util-
izing the principle of protein-dye binding. Anal Biochem
72, 248–254.
N. Zaidi et al. Determination of cathepsin E and D activity
FEBS Journal 274 (2007) 3138–3149 ª 2007 The Authors Journal compilation ª 2007 FEBS 3149