Báo cáo khoa học: The autophagic response to nutrient deprivation in the hl-1 cardiac myocyte is modulated by Bcl-2 and sarco⁄endoplasmic reticulum calcium stores ppt
Bạn đang xem bản rút gọn của tài liệu. Xem và tải ngay bản đầy đủ của tài liệu tại đây (936.08 KB, 14 trang )
The autophagic response to nutrient deprivation
in the hl-1 cardiac myocyte is modulated by Bcl-2 and
sarco
⁄
endoplasmic reticulum calcium stores
Nathan R. Brady
1
, Anne Hamacher-Brady
1
, Hua Yuan
1,2
and Roberta A. Gottlieb
1,2
1 Department of Molecular and Experimental Medicine, The Scripps Research Institute, La Jolla, CA, USA
2 BioScience Center, San Diego State University, CA, USA
Macroautophagy (hereafter referred to as autophagy)
is a highly regulated process by which the cell
degrades portions of its cytoplasm and is distinct
from chaperone-mediated autophagy and microauto-
phagy [1]. The autophagic process consists of three
phases: formation and engulfment, in which portions
of the cytoplasm, such as mitochondria and protein
aggregates, are surrounded by double-membrane
vesicles called autophagosomes; delivery of auto-
phagosomes and their contents to lysosomes; and
Keywords
autophagy; Bcl-2; Beclin 1; HL-1 cardiac
myocyte; GFP-LC3
Correspondence
R. A. Gottlieb, BioScience Center, San
Diego State University, 5500 Campanile
Drive, San Diego, CA 92182-4650, USA
Fax: +1 619 594 8984
Tel: +1 619 594 8981
E-mail:
(Received 17 July 2006, revised 23 April
2007, accepted 27 April 2007)
doi:10.1111/j.1742-4658.2007.05849.x
Macroautophagy is a vital process in the cardiac myocyte: it plays a pro-
tective role in the response to ischemic injury, and chronic perturbation is
causative in heart disease. Recent findings evidence a link between the
apoptotic and autophagic pathways through the interaction of the anti-
apoptotic proteins Bcl-2 and Bcl-X
L
with Beclin 1. However, the nature of
the interaction, either in promoting or blocking autophagy, remains
unclear. Here, using a highly sensitive, macroautophagy-specific flux assay
allowing for the distinction between enhanced autophagosome production
and suppressed autophagosome degradation, we investigated the control of
Beclin 1 and Bcl-2 on nutrient deprivation-activated macroautophagy. We
found that in HL-1 cardiac myocytes the relationship between Beclin 1 and
Bcl-2 is subtle: Beclin 1 mutant lacking the Bcl-2-binding domain signifi-
cantly reduced autophagic activity, indicating that Beclin 1-mediated
autophagy required an interaction with Bcl-2. Overexpression of Bcl-2 had
no effect on the autophagic response to nutrient deprivation; however, tar-
geting Bcl-2 to the sarco ⁄ endoplasmic reticulum (S ⁄ ER) significantly sup-
pressed autophagy. The suppressive effect of S ⁄ ER-targeted Bcl-2 was in
part due to the depletion of S ⁄ ER calcium stores. Intracellular scavenging
of calcium by BAPTA-AM significantly blocked autophagy, and thapsigar-
gin, an inhibitor of sarco ⁄ endoplasmic reticulum calcium ATPase, reduced
autophagic activity by 50%. In cells expressing Bcl-2–ER, thapsigargin
maximally reduced autophagic flux. Thus, our results demonstrate that
Bcl-2 negatively regulated the autophagic response at the level of S ⁄ ER cal-
cium content rather than via direct interaction with Beclin 1. Moreover, we
identify calcium homeostasis as an essential component of the autophagic
response to nutrient deprivation.
Abbreviations
Baf, bafilomycin A
1
; E64d, (2S,3S)-trans-epoxysuccinyl-L-leucylamido-3-methylbutane ethyl ester; FM, full medium; GFP, green fluorescent
protein; LC3, microtubule-associated protein light chain 3; MKH, modified Krebs–Henseleit buffer; PepA, pepstatin A methyl ester; Rm,
rapamycin; S ⁄ ER, sarco ⁄ endoplasmic reticulum; SERCA, sarco ⁄ endoplasmic reticulum calcium ATPase; TG, thapsigargin.
3184 FEBS Journal 274 (2007) 3184–3197 ª 2007 The Authors Journal compilation ª 2007 FEBS
degradation of the autophagosomes and cargo by
lysosomal proteases [2,3].
The autophagic pathway is crucial for maintaining
cell homeostasis and disruption to the pathway can be
a contributing factor to many diseases. Decreased
autophagy may promote the development of cancer [4]
and neurodegenerative conditions including Alzheimer’s
[5] and Parkinson’s diseases [6]. In the heart, autophagy
may protect against apoptosis activated by ischemic
injury [7], and its chronic perturbation is causative in a
genetic form of heart disease [8]. Conversely, autophagy
can also act as a form of programmed cell death linked
to, but distinct from, apoptosis [9,10].
Beclin 1, a class III phosphatidylinositol 3-kinase-
interacting protein [11], plays a role in promoting
autophagy [12]. Beclin 1 contains a Bcl-2-binding
domain which may serve as a point of cross-talk between
the autophagic and apoptotic pathways. Recently, a
BH3 domain in the Bcl-2-binding domain of Beclin 1
was shown to bind to Bcl-X
L
[13]. Anti-apoptotic Bcl-2
and Bcl-X
L
have been shown to activate the autophagic
response during programmed cell death in mouse
embryonic fibroblasts [10]. Conversely, Bcl-2 has been
shown to suppress starvation-induced autophagy in
MCF7 cancer cells [14].
Autophagy begins with formation of the autophago-
some. The machinery controlling formation of the
autophagosome involves two ubiquitin-like conjuga-
tion systems. The first is the conjugation of Atg12 to
Atg5 [15]. The other is the processing of the micro-
tubule-associated protein light chain 3 (LC3). Upon
activation of autophagy, cytosolic LC3-I undergoes
covalent conjugation to phosphatidylethanolamine [16]
to form LC-II, which is then recruited into the auto-
phagosome-forming membrane, with Atg12 conjuga-
tion to Atg5 as a necessary prerequisite [17]. The
recent characterization of green fluorescent protein
(GFP)–LC3 is a driving force in the autophagy field as
it functions as a unique and specific indicator for
autophagosomes in live cells [18]. Currently, demon-
stration of GFP–LC3 punctae visualized by fluores-
cence imaging, or LC3-I processing detected by
western blotting [18] are widely used methods for
detecting changes in autophagic activity and autophag-
osome formation. However, it is important to note
that lysosomal degradation of LC3-II varies according
to cell type [19,20]. Moreover, increased numbers of
autophagosomes can reflect impaired fusion with lyso-
somes rather than an upregulation of autophagic activ-
ity [21]. Lysosomal degradation of LC3-II is regarded
as a more accurate reflection of autophagic activity,
and therefore the accumulation of LC3-II in the
presence of lysosomal inhibitors is a more accurate
indicator of autophagy [20]. For these reasons, studies
which rely on steady-state LC3-II concentrations or
the steady-state abundance of autophagosomes may
reach incorrect conclusions, as increased numbers
of autophagosomes do not always correlate with
increased autophagic activity.
The goal of this study was to determine the roles
of Beclin 1 and Bcl-2 in controlling autophagy. We
employed a highly sensitive systematic approach for
evaluating autophagy under high-nutrient conditions
and in response to nutrient deprivation in the HL-1
cardiac cell line. Active autophagic flux in a cell was
determined based upon the increase in GFP–LC3-II
accumulation in the presence of lysosomal inhibitors.
We found that Bcl-2 has both an activating and
suppressive effect on autophagy. Although the Bcl-2-
binding domain of Beclin 1 is required for autophagy,
Bcl-2 destabilization of sarco ⁄ endoplasmic reticulum
(S ⁄ ER) calcium stores can override Beclin 1 induction
of autophagy. These findings reveal additional levels of
complexity in the control of autophagy. Physiologic
and pathophysiologic implications of this relationship
to cardiomyocyte function are discussed.
Results
Inhibiting lysosomal activity to quantify
autophagic flux
During the initiation of autophagy, cytosolic LC3
(LC3-I) is cleaved and lipidated to form LC3-II
[16,20]. LC3-II is then recruited to the autophagosomal
membrane [17]. Transient transfection of the fusion
protein, GFP–LC3, allows detection of autophago-
somes which appear as punctae by fluorescence micros-
copy of live or fixed cells.
In this study, we utilized the extent of GFP–LC3-
labeled autophagosome formation during a set amount
of time as a specific index of macroautophagic activ-
ity. To determine the autophagic flux, a lysosomal
inhibitor cocktail consisting of the cell-permeable
pepstatin A methyl ester (PepA; 5 lgÆlL
)1
, inhibitor of
cathepsin D), (2S,3S)-trans-epoxysuccinyl-l-leucylami-
do-3-methylbutane ethyl ester (E64d; 5 lgÆlL
)1
, inhib-
itor of cathepsin B) and bafilomycin A
1
(Baf; 50 lm;
inhibitor of the vacuolar proton ATPase) was used to
block lysosomal degradation of autophagosomes [20].
Inhibition of cathepsin activity was verified utilizing
the fluorescent MagicRed cathepsin B substrate [22].
Under normal conditions processing of the MagicRed
substrate to its fluorescent form by the lysosomal pro-
tease cathepsin B allows detection of individual organ-
elles representing the lysosomes. In cells treated with
N. R. Brady et al. Bcl-2 and calcium control of autophagy
FEBS Journal 274 (2007) 3184–3197 ª 2007 The Authors Journal compilation ª 2007 FEBS 3185
the inhibitor cocktail, fluorescence intensity was lower
due to decreased MagicRed processing by cathepsin B
(Fig. 1A). Similarly, LysoTracker Red, which accumu-
lates in acidic organelles, serves to reveal lysosomal
acidification, which is required for protease activity
[23] and autophagosome–lysosome fusion [24]. Baf
effectively blocked lysosomal acidification (Fig. 1B).
Quantifying autophagy and autophagic flux in
HL-1 cardiac myocytes
We first characterized the basal level of autophagy in
fully supplemented medium [25]. GFP–LC3-expressing
HL-1 cells were incubated without or with lysosomal
inhibitor cocktail for 3.5 h. Autophagosomes were
visualized by fluorescence microscopy, revealing two
distinct populations: cells containing few or no GFP–
LC3 punctae (‘low’), and a small population of cells
exhibiting numerous GFP–LC3 punctae (‘high’). To
evaluate the effect of rapamycin (Rm), which is known
to stimulate autophagy even under high nutrient condi-
tions [26–28], GFP–LC3-expressing HL-1 cells were
treated with or without 1 lm Rm in the presence or
absence of the lysosomal inhibitors. After 30 min incu-
bation with Rm, cells showed a robust increase in the
numbers of GFP–LC3 dots per cell (Fig. 2A, right).
Next, we quantified the percentage of cells showing
numerous GFP–LC3 dots⁄ cell by fluorescence micros-
copy. The results, shown in the bar graph (Fig. 2B),
indicate the percentage of cells showing numerous
GFP–LC3 dots ⁄ cell at steady-state. Similar scoring in
the presence of the lysosomal inhibitors, allows deter-
mination of cumulative autophagosome formation
over a defined time interval. The difference in the num-
ber of cells with high autophagosome content in the
presence or absence of inhibitors (numbers inserted in
graphs) represents the percentage of cells with high
autophagic flux. Under full medium (FM) conditions,
in the presence of lysosomal inhibitors, only a small,
statistically insignificant increase in the percentage of
cells exhibiting high autophagosome content was
observed, indicating low autophagic flux under high
nutrient conditions. In contrast, Rm stimulated a signi-
ficant increase in autophagic flux. Furthermore, our
results demonstrate that Rm-stimulated autophagy in
FM exceeds the capacity for autophagosome degrada-
tion, as steady-state levels of autophagy increased even
though flux was greatly enhanced.
In order to further characterize autophagic flux in
cell populations, GFP–LC3-expressing cells in FM
were treated with or without Rm in the absence of
lysosomal inhibitors, and the number of GFP–LC3
A
B
MagicRed
MKH MKH + i
LTR
MKH
MKH + i
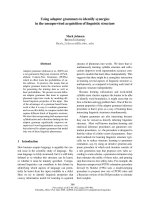
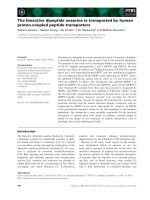
Fig. 1.
16
Inhibition of lysosomal activity with
the inhibitor cocktail. (A) Inhibition of cathep-
sin B activity by lysosomal inhibitors.
Activity and intracellular distribution of cath-
epsin B, a predominant lysosomal protease,
was assessed using (z-RR)
2
-MagicRed-Cath-
epsin B substrate (MagicRed). HL-1 cells
were treated with lysosomal inhibitors
(PepA, E64d and Baf) in MKH buffer for 2 h
with MagicRed present during the last
30 min of the experiment, and then imaged.
(B) Inhibition of vacuolar proton ATPase
activity by lysosomal inhibitors. Following
2 h incubation in MKH + lysosomal inhibi-
tors (MKH + i), cells were loaded with
50 n
M LysoTracker Red for 5 min. The
buffer was then replaced with dye-free
MKH and cells were analyzed by fluores-
cence microscopy. Scale bar, 20 l m.
Bcl-2 and calcium control of autophagy N. R. Brady et al.
3186 FEBS Journal 274 (2007) 3184–3197 ª 2007 The Authors Journal compilation ª 2007 FEBS
punctae in individual cells was quantified. As shown in
Fig. 2C, histogram analysis revealed a bimodal distri-
bution between ‘low’ and ‘high’ numbers of GFP–LC3
dots ⁄ cell. In the absence of lysosomal inhibitors, the
majority of cells had < 20 GFP–LC3 dots ⁄ cell and
none had > 30 GFP–LC3 dots ⁄ cell. In contrast, the
majority of cells treated with Rm exhibited > 60
GFP–LC3 dots ⁄ cell. Cells with intermediate numbers
of autophagosomes were very infrequent. Thus, this
distinctive bimodal distribution allows straightforward
evaluation of autophagy in a population of cells.
Autophagic response to nutrient deprivation
Autophagy is strongly upregulated in response to
nutrient deprivation [19,29]. To examine the autopha-
gic response to starvation in HL-1 cells, GFP–LC3-
expressing cells were subjected to nutrient deprivation
by incubation in modified Krebs-Henseleit buffer
(MKH), which lacks amino acids and serum. Interest-
ingly, after incubation in MKH in the absence of
lysosomal inhibitors, most cells exhibited few auto-
phagosomes (Fig. 3), resembling cells incubated in FM
(Fig. 2B). This observation in HL-1 cells differs from
results in other cell lines [14,20]. However, the addition
of lysosomal inhibitors for 3.5 h revealed robust auto-
phagic activity, with 90% of cells displaying high
numbers of GFP–LC3 dots ⁄ cell (Fig. 3). The remain-
ing 10% of cells showed low numbers of GFP–LC3
punctae, possibly because they were in a phase of the
cell cycle in which autophagy is suppressed [30,31].
These results demonstrate that autophagic flux was
substantially upregulated in HL-1 cells in response to
nutrient deprivation, consistent with previous reports
[32,33].
Beclin 1 control of the autophagic response to
nutrient deprivation requires a functional
Bcl-2
⁄
-X
L
-binding domain
We next investigated the control of Beclin 1 and its
binding partner, Bcl-2, on autophagic activity. Beclin 1
was the first mammalian protein described to mediate
autophagy [12]. Beclin 1 interaction with the class III
B
A
0
4
8
12
16
Control
Rm
Cell Numbers
0-9
10-19
20-29
30-59
60-79
80-99
100+
0
20
40
60
80
100
% Cells with Numerous
GFP-LC3 Punctae
Steady-state
Cumulative
42.3
Control Rm
*
**
9.3
**
*
C
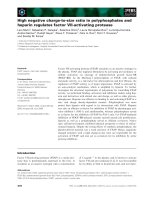
FM FM + Rm
Cumulative
Steady-State
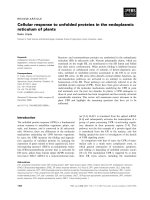
Fig. 2. Basal and Rm-activated autophagic
activity in FM. (A) GFP–LC3 transfected
HL-1 cells were treated with 1 l
M Rm for
30 min in FM, followed by an additional
3.5 h incubation with or without the lyso-
somal inhibitor cocktail, and fixed with para-
formaldehyde. Z-stacks of representative
cells were acquired and subsequently proc-
essed by 3D blind deconvolution (Auto-
Quant). Images represent the maximum
projections of total cellular GFP–LC3 fluores-
cence. Scale bar, 15 lm. (B) The percent-
ages of cells with numerous GFP–LC3
punctae at steady state (without lysosomal
inhibitor cocktail, solid bars) and cumulative
(after incubation with lysosomal inhibitor
cocktail, hatched bars) were quantified and
compared between FM and Rm-treated.
*P<0.05 for Rm versus FM (steady-state);
**P<0.01 for Rm versus FM (cumulative);
***P<0.001 for Rm versus FM (flux). (C)
Population distribution of cells containing
various numbers of autophagosomes (X
axis, number of autophagosomes per cell)
in FM or FM + Rm (without lysosomal
inhibitors).
N. R. Brady et al. Bcl-2 and calcium control of autophagy
FEBS Journal 274 (2007) 3184–3197 ª 2007 The Authors Journal compilation ª 2007 FEBS 3187
phosphatidylinositol 3-kinase hVps34 is required for
activation of the autophagic pathway [34]. Beclin 1
contains a Bcl-2-binding domain which has been
shown to interact with antiapoptotic Bcl-2 and Bcl-X
L
,
but not proapoptotic Bcl-2 family members [35]. How-
ever, the nature of the relationship between Beclin 1
and Bcl-2 remains unclear. Recent studies have sugges-
ted that Bcl-2 plays a role in the suppression of starva-
tion-induced autophagy [14,36]; others have shown
that Bcl-2 positively regulates autophagic cell death
activated by etoposide [10].
Here we sought to determine the effect of Beclin 1
and its mutant lacking the Bcl-2-binding domain
(Beclin 1DBcl2BD) [14] on autophagic activity under
high- and low-nutrient conditions. Both Flag–Beclin 1
and its mutant constructs express at comparable levels
in HL-1 cells [32]. Under high-nutrient conditions,
steady-state and cumulative autophagy were similar
between control and Beclin 1-transfected cells (Fig. 4).
In MKH buffer, both control and Beclin 1-over-
expressing cell populations responded to nutrient
deprivation with generalized upregulation of auto-
phagy (Fig. 4). In contrast, Beclin 1DBcl2BD expres-
sion significantly reduced autophagic flux in both
high- and low-nutrient conditions (Fig. 4), indicating
that Beclin 1-mediated autophagy required the Bcl-2-
binding domain for maximal autophagic response.
Bcl-2 suppression of the autophagic response to
nutrient deprivation is dependent on its
subcellular localization
Our ability to quantify autophagic flux (versus the
commonly reported autophagosome content) revealed
the surprising finding that Beclin 1DBcl2BD sup-
pressed autophagy. This was in contrast to the studies
of Pattingre et al. [14], who showed that in cancer
cells, Beclin 1DBcl2BD, as well as other Beclin 1
mutants lacking the ability to interact with Bcl-2,
increased the percentage of cells containing numerous
autophagosomes; these mutants have been shown to
activate cell death during nutrient deprivation, attrib-
uted to excessive autophagy. In addition, they showed
that Bcl-2 decreased steady-state autophagy through
its interaction with the Beclin 1 Bcl-2-binding domain.
To explore potential reasons for this discrepancy, we
quantified autophagic flux in order to evaluate the
effect of Bcl-2 overexpression on the response to nutri-
ent deprivation. HL-1 cells were cotransfected with
mCherry–LC3 and GFP–Bcl-2-wt (wild-type) or
GFP–Bcl-2-ER (S ⁄ ER-targeted) (Fig. 5A). Although
we found that Beclin 1DBcl2BD expression greatly
reduced autophagic flux, expression of wild-type Bcl-2
did not alter flux (Fig. 5B). Endogenous Bcl-2 is found
in the cytosol, at the mitochondria, and at the S ⁄ ER
[37]. Forced localization of Bcl-2 to the S ⁄ ER has
previously been reported to suppress autophagy in
response to nutrient deprivation, as indicated by the
decrease in the percentage of cells displaying numerous
autophagosomes [14]. Our measurement of autophagic
activity in the presence and absence of lysosomal
inhibitors revealed that Bcl-2-ER, unlike Bcl-2-wt,
potently suppressed autophagic flux in response to
nutrient deprivation (Fig. 5B).
Bcl-2 overexpression inhibits autophagy due to
depletion of sequestered S
⁄
ER Ca
2+
stores
The strong suppressive effect on autophagy exerted by
Beclin 1DBcl2BD, the profound suppressive effect of
Bcl-2-ER, and the minimal suppressive effect of Bcl-2-
wt were inconsistent with the notion that Bcl-2 func-
tions as a direct suppressor of Beclin 1 activity. These
results suggested the existence of another mechanism
B
% Cells with Numerous
GFP-LC3 Punctae
MKH
120
0
20
40
60
80
100
Steady-state
Cumulative
*
82
A
MKH MKH+i (high)
GFP-LC3
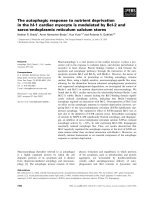
Fig. 3. Autophagic flux under nutrient deprivation. (A) GFP–LC3
transfected HL-1 cells were incubated in low nutrient modified
MKH with or without the lysosomal inhibitor cocktail for 3.5 h and
fixed with paraformaldehyde. Z-stacks of representative cells were
acquired and subsequently processed by 3D blind deconvolution
(AutoQuant). Scale bar, 10 lm. (B) The percentages of cells with
numerous GFP–LC3 punctae without (steady-state, solid bar) and
with lysosomal inhibitors (cumulative, hatched bar) were quantified
under conditions of nutrient deprivation (MKH). *P<0.001.
Bcl-2 and calcium control of autophagy N. R. Brady et al.
3188 FEBS Journal 274 (2007) 3184–3197 ª 2007 The Authors Journal compilation ª 2007 FEBS
controlling autophagic activity. Bcl-2 increases the
permeability of the S ⁄ ER to Ca
2+
[38] through its
interaction with sarco ⁄ endoplasmic reticulum calcium
ATPase (SERCA), which is responsible for pumping
Ca
2+
from the cytosol back into the S ⁄ ER [39].
Intriguingly, S ⁄ ER Ca
2+
stores are required for the
activation of autophagy [40] as well as downstream
lysosomal function [41]. We hypothesized that Bcl-2
targeted to the S ⁄ ER inhibits autophagy in part due to
modulation of the S ⁄ ER Ca
2+
content.
We first sought to determine whether overexpression
of Bcl-2 significantly reduced Ca
2+
content in HL-1
cardiac cells. S ⁄ ER Ca
2+
homeostasis is maintained by
the opposing processes of release by the ryanodine
receptor and re-uptake by SERCA. Thapsigargin (TG),
a selective SERCA inhibitor, can be used to deplete
S ⁄ ER calcium stores by blocking reuptake [42]. Experi-
ments were performed in the presence of norepinephrine
(0.1 mm) to stimulate S ⁄ ER Ca
2+
release, and S ⁄ ER
Ca
2+
content was inferred by measuring the increase in
cytosolic Ca
2+
1 min after TG treatment, using the
fluorescent Ca
2+
indicator Fluo-4 (2 lm). TG-mediated
depletion of S ⁄ ER Ca
2+
was similar in control and
Bcl-2-wt transfected cells, but was significantly reduced
in cells transfected with Bcl-2-ER (Fig. 6). These results
demonstrate that the capacity for S ⁄ ER Ca
2+
release,
an index of S ⁄ ER Ca
2+
content, is reduced by Bcl-2-ER
in the HL-1 cardiac myocyte, in agreement with studies
performed in other cell lines [39,43].
Positive regulation of autophagy by S
⁄
ER Ca
2+
We then sought to determine whether low levels of
cytosolic Ca
2+
might influence the activation of auto-
phagy by nutrient deprivation. BAPTA-AM (25 lm), a
membrane-permeable Ca
2+
chelator [44,45], was added
to HL-1 cells, and autophagic flux was quantified.
BAPTA-AM treatment resulted in nearly complete
inhibition of autophagic activity (Fig. 7A). Moreover,
BAPTA-AM decreased autophagy even in the presence
of Rm (1 lm; results not shown).
To determine whether S ⁄ ER Ca
2+
content affected
autophagic activity, we depleted S ⁄ ER Ca
2+
with TG.
In control, Bcl-2-wt, and Bcl-2-ER-transfected
cells, TG (1 lm) significantly suppressed nutrient
deprivation-induced autophagic activity (Fig. 7B).
Vector
Beclin1 Beclin1
Bcl2
-
BD
A
B
MKH + i
0
20
40
60
80
100
Vector Beclin1 Beclin1
Bcl2BD
FM MKH
*
15.7
10.4
5.6
80.3
78.2
42.9
% Cells with Numerous
GFP-LC3 Punctae
Vector Beclin1 Beclin1
Bcl2BD
Steady-state
Cumulative
**
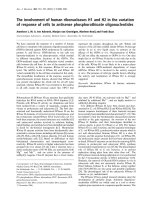
Fig. 4. Beclin 1 regulation of autophagic
response. HL-1 cells were cotransfected
with GFP–LC3 and a plasmid encoding
FLAG–Beclin 1, FLAG–Beclin 1DBcl2BD or
empty vector, then incubated in either high-
nutrient FM or low-nutrient MKH. Parallel
wells of cells were incubated without or
with the lysosomal inhibitor cocktail, fixed
with paraformaldehyde, and imaged. (A)
Autophagic flux, quantified by comparison of
the percentages of cells with numerous
GFP–LC3 dots ⁄ cell without (steady-state,
black bars) and with lysosomal inhibitors
(cumulative, hatched bars), was determined
in cells expressing GFP–LC3 and the indica-
ted constructs. *P<0.01 Vector versus
Beclin 1DBcl2BD (MKH, cumulative);
**P ¼ NS vector versus Beclin 1 (MKH,
cumulative). (B) Representative images of
HL-1 cells incubated in MKH with lysosomal
inhibitors (MKH + i) and expressing the indi-
cated constructs. Scale bar, 10 lm.
N. R. Brady et al. Bcl-2 and calcium control of autophagy
FEBS Journal 274 (2007) 3184–3197 ª 2007 The Authors Journal compilation ª 2007 FEBS 3189
Furthermore, in cells expressing Bcl-2-ER, TG reduced
autophagic activity to an even greater extent.
Discussion
In this study, we established a method for the quanti-
tative assessment of autophagic activity among a pop-
ulation of cells in order to investigate the control over
autophagy exerted by Beclin 1 and its putative inter-
acting partner Bcl-2. By making a distinction between
steady-state autophagosome accumulation and auto-
phagic flux, we revealed a complex role for Bcl-2 in
the regulation of autophagy: under normal conditions
Bcl-2 positively regulates autophagy via its interaction
with Beclin 1, yet under conditions in which Bcl-2 is
concentrated at the S ⁄ ER, the consequent depletion of
S ⁄ ER lumenal Ca
2+
results in an overriding inhibition
of autophagy.
Determination of autophagic flux
To quantify autophagy in our experimental system, we
inhibited lysosomal degradation and analyzed the accu-
mulation of GFP–LC3-positive punctae by fluores-
cence microscopy. Although stable transfection of GFP–
LC3 was reported to increase monodansylcadaverine
labeling [46], a fluorescent dye that labels endolyso-
B
A
Vector
% Cells with Numerous
GFP-LC3 Punctae
Steady-state Cumulative
Bcl-2-wt Bcl-2-ER
*
0
25
50
75
100
Vector
Bcl-2-wt
Endo-Bcl-2
GFP-Bcl-2
Bcl-2-ER
Fig. 5. Bcl-2 control of autophagic activity. HL-1 cells were trans-
fected with mCherry-LC3 and empty vector, GFP–Bcl-2-wt, or GFP–
Bcl-2-ER. Experiments were carried out 24 h after transfection. (A)
Western blots of cell lysates from transfected cells shows the
expression of GFP–Bcl-2 constructs and endogenous Bcl-2 (endo).
The whole population of cells from each condition was collected for
western blot and therefore includes untransfected cells. Transfec-
tion efficiency was noticeably higher with GFP–Bcl-2-ER, accounting
for the difference seen on western blot. However, the apparent
intensity of fluorescence in cells expressing GFP–Bcl-2-ER was sim-
ilar to that of GFP–Bcl-2-wt (results not shown), thus allowing us to
conclude that differential effects of Bcl-2-ER were due to its localiza-
tion rather than a difference in expression levels. (B) Cells were
incubated in MKH buffer in the absence (steady-state, solid bars) or
presence of lysosomal inhibitor cocktail (cumulative, hatched bars)
for 3.5 h, then fixed. The accumulation of autophagosomes was
quantified only in doubly transfected cells. Flux values are shown in
inset boxes. *P<0.008 for Bcl-2-ER versus vector (cumulative).
-20
-10
0
10
20
30
40
% TG-induced Change in
Fluo-4 Fluorescence
Vector Bcl-2-wt
Bcl-2-ER
B
*
**
A
Fluo-4 +TG
Vector
WT
S/ER
Fig. 6. Bcl-2 localized to the S ⁄ ER reduces S ⁄ ER calcium content.
HL-1 cells were cotransfected with mito-CFP and either Bcl-2-wt or
Bcl-2-ER at a ratio of 1 : 3. Cells were incubated with 2 l
M Fluo-4 for
20 min followed by washout in dye-free MKH buffer containing nor-
epinephrine (0.1 m
M) to facilitate Ca
2+
cycling. (A) Images were col-
lected before and 1 min after the addition of 1 l
M TG (+ TG). Scale
bar, 20 lm. (B) The average percent change in Fluo-4 fluorescence
after addition of TG was determined. *P<0.01 for vector versus
Bcl-2-wt; **P<0.001 for vector versus Bcl-2-ER. The small negative
percent change seen with Bcl-2-ER may be due to photobleaching.
Bcl-2 and calcium control of autophagy N. R. Brady et al.
3190 FEBS Journal 274 (2007) 3184–3197 ª 2007 The Authors Journal compilation ª 2007 FEBS
somes [47], it is not known whether GFP–LC3 over-
expression truly upregulates autophagy. Importantly,
however, transgenic mice expressing GFP–LC3 can
develop normally without detectable abnormalities
[19]. The application of maximal projections of
Z-stacks provides a more complete assessment to
detect the number of GFP–LC3-positive dots than that
obtained by 2D imaging or electron microscopy, which
is limited to the plane of focus or selected intracellular
regions. Moreover, unlike commonly used assays
measuring degradation of long-lived proteins, the
technique we employed is specific to quantify macroau-
tophagy. Such a distinction is relevant, as chaperone-
mediated autophagy, which targets cytosolic proteins,
is strongly stimulated by ketone bodies, which build
up during starvation [48], and by oxidative stress [49].
In fact, recent findings indicate that chaperone-medi-
ated autophagy and macroautophagy may have com-
pensatory functions [50]. In agreement with previous
reports [20,51], our results further dispute the widely
held assumption that cellular autophagosome numbers
correlate with autophagic activity: we show that in
response to nutrient deprivation low autophagosome
numbers can reflect either high lysosomal turnover of
autophagosomes or low autophagic flux. Notably,
HL-1 cells in FM (low autophagic activity) or under-
going nutrient deprivation (high autophagic activity)
exhibit low steady-state levels of GFP–LC3-positive
punctae. This result was surprising, as the upregulation
of autophagy by starvation has been reported in vivo
[19], in isolated primary cells [33], and in other cell
lines [52] [14,20]. This discrepancy may be a character-
istic of HL-1 cells. The turnover rate of lysosomal deg-
radation may be faster than in other cell types. In
addition, the presence of glucose in MKH buffer might
have permitted efficient clearance of autophagosomes,
in contrast to studies in which glucose, as well as
serum and amino acids, was eliminated. We suggest
that the best indicator of autophagic activity is flux,
which we define as the percentage of cells with numer-
ous autophagosomes after lysosomal inhibition (cumu-
lative), minus the percentage of cells with numerous
autophagosomes in the absence of lysosomal inhibitors
(steady-state). An increase in steady-state autophagy
without a corresponding increase in cumulative auto-
phagy would indicate a defect in autophagosome clear-
ance (a failure to route autophagosome to lysosomes
or to degrade them once fused with lysosomes). Con-
versely, decreased steady-state autophagy in conjunction
with decreased cumulative autophagy would indicate
impaired formation of autophagosomes. This approach
therefore provides additional information about the
process of autophagy, revealing points of impairment,
and reduces the potential for misinterpretation of results
obtained by monitoring LC3–GFP punctae.
Endogenous Bcl-2 enables maximum Beclin
1-mediated autophagic activity during nutrient
deprivation
The effect of the interaction between Beclin 1 and Bcl-
2 ⁄ -X
L
on autophagic activity is unclear. Control cells
exhibited robust autophagic activity in response to
nutrient deprivation and Rm, indicating that endog-
enous levels of Beclin 1 were sufficient to drive maximal
autophagic activity. In contrast, the Beclin 1 mutant
(Beclin 1DBcl2BD) suppressed autophagy, indicating
that Beclin 1DBcl2BD functioned as a dominant-negat-
ive protein during nutrient deprivation. By contrast,
B
A
% Cells with Numerous
GFP-LC3 Punctae
% Cells with Numerous
GFP-LC3 Punctae
MKH Control MKH+BAPTA
0
20
40
60
80
100
Cumulative Cumulative + TG
Vector Bcl-2-wt Bcl-2-ER
*
*
*
*
5.1
75.1
0
20
40
60
80
100
Steady-state
Cumulative
Fig. 7. Role of S ⁄ ER Ca
2+
stores on nutrient deprivation-induced
autophagy. HL-1 cells were transfected with GFP–LC3 and incuba-
ted in low-nutrient MKH buffer. (A) Cells were incubated without
(MKH Control) or with BAPTA-AM (MKH + BAPTA) for 3.5 h; paral-
lel wells were incubated without (steady-state, solid bars) or with
(cumulative, hatched bars) lysosomal inhibitors, then fixed and the
percentages of cells with numerous GFP–LC3 dots ⁄ cell were quan-
tified. *P<0.01, control versus BAPTA (cumulative). Flux values
are indicated as inset numbers. (B) Cells were transfected with
mito-CFP and either Bcl-2-wt or Bcl-2-ER at a ratio of 1 : 3, then
incubated for 3.5 h in low-nutrient MKH buffer, all in the presence
of lysosomal inhibitors, without (cumulative, open bars) or with
1 l
M thapsigargin (cumulative + TG, light gray bars) (*P<0.001,
cumulative versus cumulative + TG).
N. R. Brady et al. Bcl-2 and calcium control of autophagy
FEBS Journal 274 (2007) 3184–3197 ª 2007 The Authors Journal compilation ª 2007 FEBS 3191
Beclin 1DBcl2BD functioned similar to wild-type
Beclin 1 to promote clearance of toxic huntingtin aggre-
gates in neurons [53]. Mouse embryonic fibroblasts over-
expressing Bcl-2 and Bcl-X
L
exhibited increased levels
of Atg5–Atg12 conjugates and more GFP–LC3 punctae
in response to etoposide [10], and Beclin 1 lacking or
mutated in the Bcl-2-binding domain caused a massive
accumulation of autophagosomes and induced cell
death in both FM and under starvation conditions [14].
In light of our findings that autophagic flux is impaired
in cells overexpressing Beclin 1DBcl2BD, it is possible to
reinterpret the observation of increased numbers of
autophagosomes as an indication of impaired autophago-
lysosomal clearance rather than increased autophagy.
Although it is possible that deletion of the Bcl-2-binding
domain has a nonspecific effect on Beclin 1 function, we
think that our results indicate a requirement for Bcl-2
interaction to promote autophagy. One possible inter-
pretation is that a trimolecular complex, comprising
Beclin 1, Bcl-X
L
(or Bcl-2), and the class III phosphati-
dylinositol 3-kinase Vps34, is required for autophago-
some formation. In the case of Beclin 1DBcl2BD, a
nonproductive bimolecular complex (lacking Bcl-2)
would form. Beclin 1DBcl2BD would compete with
Beclin 1 for interaction with Vps34, and in the case of
overexpression, would act as a competitive inhibitor.
Pattingre et al. [14] showed that autophagosome con-
tent was negatively correlated with the amount of Bcl-2
that interacted with Beclin 1, and that Bcl-2 binding of
Beclin 1 interfered with the Beclin 1–Vps34 interaction,
which signals autophagy. In support of this model, the
authors showed that high levels of Bcl-2 and Beclin 1 co-
immunoprecipitated under high-nutrient conditions,
and conversely, Bcl-2 did not coimmunoprecipitate with
Beclin 1 under low-nutrient conditions. However, Zeng
et al. [54] showed that endogenous Bcl-2 did not interact
with Beclin 1 in U-251 cells under FM conditions; only
through overexpression of Bcl-2 was such an interaction
detected. Moreover, Kihara et al. [34] found that under
FM conditions all Beclin 1 in HeLa cells is bound to
Vps34. These diverging reports raise the possibility that
rheostatic control of autophagy by Beclin 1–Bcl)2inter-
action is not a universal mechanism. F urther experiments
are n eeded to clarify the nature of Bcl-2 control of a uto-
phagy at the le vel o f S ⁄ER calcium and Beclin 1 binding.
S
⁄
ER-localized Bcl-2 depletes S
⁄
ER Ca
2+
-content,
thereby inhibiting autophagy
High S ⁄ ER Ca
2+
stores are required for autophagy
[40]. We found that Bcl-2-ER suppressed autophagic
activity, similar to the previous report [14] and reduced
S ⁄ ER Ca
2+
content, as previously shown [39,43].
Moreover, we directly demonstrated the Ca
2+
require-
ment for autophagic activity: intracellular chelation of
Ca
2+
by BAPTA, and depletion of S ⁄ ER Ca
2+
stores
by the SERCA inhibitor TG, both profoundly sup-
pressed autophagy. The recent report by Criollo et al.
[36] found that TG increased the percentage of cells
with numerous autophagosomes, which they inter-
preted as increased autophagic activity. Our studies are
consistent with their steady-state observations, but our
flux measurements allow us to conclude that TG
impairs autophagic flux, and reveal that this effect is
in fact related to S ⁄ ER Ca
2+
stores.
Although overexpression of Bcl-2-wt did not sup-
press autophagy, this may reflect the amount of Bcl-2
localized to the S ⁄ ER, which was considerably less
than when expressing ER-targeted Bcl-2. We speculate
that the specialized S ⁄ ER of the HL-1 cardiac myo-
cyte, which contains high SERCA levels, is able to
overcome some degree of Bcl-2 leak and maintain
S ⁄ ER Ca
2+
content in response to low levels of Bcl-2
[43], yet would be impaired by supra-physiological
levels of Bcl-2 at the S ⁄ ER [39].
It is interesting to note that the physiological impli-
cations of S ⁄ ER-targeted Bcl-2 in the cardiac myocyte
are unclear. Conditions that trigger preferential recruit-
ment of Bcl-2 to the S ⁄ ER have not been shown and it
is not known if this might occur under physiologic or
pathologic conditions. Although enforced Ca
2+
release
from S ⁄ ER stores, by either Bcl-2 or Bcl-X
L
, minim-
izes the Ca
2+
signaling component of apoptosis [55], it
is not known if S ⁄ ER targeted-Bcl-2 affects the ability
of the cardiac myocyte to contract. While the decrease
of S ⁄ ER Ca
2+
stores might be predicted to be harmful
to the heart by reducing its capacity to do work, mice
overexpressing Bcl-2 in the heart do not exhibit overt
cardiac dysfunction [56,57].
The requirement for S ⁄ ER Ca
2+
stores to support
autophagy is clear, yet the regulating mechanism
remains unknown. Suppression of autophagy by BAP-
TA buffering of cytosolic Ca
2+
or by TG-mediated
reduction in ER luminal Ca
2+
suggests that transient
S ⁄ ER Ca
2+
release may be a necessary cofactor for
activation of autophagy. In this scenario, depending
on the nature of amplitude and duration of Ca
2+
release by TG, its administration could conceivably
result in a transient increase in autophagosome forma-
tion, followed by a sustained inhibition of autophagic
flux. As Vps34 contains a C2 domain, we speculate
that transient Ca
2+
elevations would trigger recruit-
ment of the autophagic machinery to the membrane,
in a manner analogous to the recruitment of cytosolic
phospholipase A
2
[58]. In addition, it was recently
reported that calpain is required for autophagy [59,60],
Bcl-2 and calcium control of autophagy N. R. Brady et al.
3192 FEBS Journal 274 (2007) 3184–3197 ª 2007 The Authors Journal compilation ª 2007 FEBS
indirectly implicating calcium necessary to activate cal-
pain. However, this may be a two-edged sword, as it
was reported that calpain converts Atg5 to a BH3-only
protein capable of triggering apoptosis [61].
Significance in the heart
This study was carried out in the HL-1 cardiac myo-
cyte cell line, which represents a useful model that may
extend our understanding of the autophagic processes
in the heart. The cardiac myocyte requires an efficient
supply and delivery of ATP from the mitochondria to
perform work and maintain ion homeostasis. Ca
2+
couples mitochondrial ATP production to demand:
Ca
2+
release during the action potential stimulates
both acto-myosin ATPase activity (contraction) and
mitochondrial oxidative phosphorylation [62] through
activation of the tricarboxylic acid cycle [63]. Our
results reveal that, in addition, Ca
2+
homeostasis is
required for maximal macroautophagic activity in the
cardiac myocytes. It is well known that altered Ca
2+
homeostasis plays a causative role in many forms of
cardiovascular disease [64,65]. Our results also suggest
that under certain conditions Bcl-2 is required for
autophagic activity, supporting previous findings that
increased Bcl-2 and autophagic activity correlated with
protection in an in vivo model of ischemic injury [7,57].
In conclusion, autophagy is emerging as an import-
ant process involved in programmed cell death as well
as cytoprotection. We suggest that the inability to
mount an autophagic response due to depleted S ⁄ ER
Ca
2+
is relevant for paradigms of both cellular protec-
tion and cell death. The additional insights gained
from measurement of autophagic flux may necessarily
lead to re-evaluation and reinterpretation of published
results. The findings of Levine’s [14] and Kroemer’s
[36] groups in relation to this study clearly illustrate
the need to revisit studies in which the steady-state
abundance of autophagosomes was used to infer the
extent of autophagic activity.
Experimental procedures
Reagents
Rm, BAPTA-AM, PepA, E64d, and Baf were purchased
from EMD Biosciences (San Diego, CA)
2
; TG was pur-
chased from Sigma (St Louis, MO).
Cell culture and transfections
Cells of the murine atrial-derived cardiac cell line HL-1 [25]
were plated in gelatin ⁄ fibronectin-coated culture vessels and
maintained in Claycomb medium (JRH Biosciences,
Lenexa, KS)
3
supplemented with 10% fetal bovine serum,
0.1 mm norepinephrine, 2 mml-glutamine, 100 UÆmL
)1
penicillin, 100 UÆ mL
)1
streptomycin, and 0.25 lgÆmL
)1
amphotericin B. Cells were transfected with the indicated
vectors using the transfection reagent Effectene (Qiagen,
Valencia, CA), according to the manufacturer’s instruc-
tions, achieving at least 40% transfection efficiency. For
experiments aimed at determining autophagic flux, HL-1
cells were transfected with GFP–LC3 and the indicated vec-
tor at a ratio of 1 : 3 lg DNA. For calcium imaging experi-
ments, HL-1 cells were transfected with mito-ECFP [66]
and the indicated vector at a ratio of 1 : 3 lg DNA.
High- and low-nutrient conditions
Cells were plated in 14-mm-diameter glass bottom microwell
dishes (MatTek, Ashland, MA)
4
. For high-nutrient condi-
tions, experiments were performed in fully supplemented
Claycomb medium. For low-nutrient conditions, experi-
ments were performed in modified MKH (in mm: 110 NaCl,
4.7 KCl, 1.2 KH
2
PO
4
, 1.25 MgSO
4
, 1.2 CaCl
2
, 25 NaHCO
3
,
15 glucose, 20 Hepes, pH 7.4) and incubation at 95% room
air)5% CO
2
.
Wide-field fluorescence microscopy
Cells were observed through a Nikon TE300 fluorescence
microscope (Nikon, Melville, NY)
5
equipped with a ·10 lens
(0.3 NA, Nikon), a ·40 Plan Fluor and a ·60 Plan Apo
objective (1.4 NA and 1.3 NA oil immersion lenses; Nikon),
a Z-motor (ProScanII, Prior Scientific, Rockland, MA)
6
,a
cooled CCD camera (Orca-ER, Hamamatsu, Bridgewater,
NJ)
7
and automated excitation and emission filter wheels con-
trolled by a LAMBDA 10–2 (Sutter Instrument, Novato,
CA)
8
operated by MetaMorph 6.2r4 (Molecular Devices Co.,
Downington, PA)
9
. Fluorescence was excited through an exci-
tation filter for fluorescein isothiocyanate (HQ480 ⁄·40), and
Texas Red (D560 ⁄·40). Fluorescent light was collected via a
polychroic beamsplitter (61002 bs) and an emission filter for
fluorescein isothiocyanate (HQ535 ⁄ 50 m), and Texas Red
(D630 ⁄ 60 m). All filters were from Chroma. Acquired wide-
field Z-stacks were routinely deconvolved using 10 iterations
of a 3D blind deconvolution algorithm (AutoQuant) to
maximize spatial resolution. Unless stated otherwise, repre-
sentative images shown are maximum projections of Z-stacks
taken with 0.3 lm increments capturing total cellular
volume.
Determination of autophagic content and flux
To analyze autophagic flux, GFP–LC3-expressing cells were
subjected to the indicated experimental conditions with and
without a cocktail of the cell-permeable lysosomal inhibitors
N. R. Brady et al. Bcl-2 and calcium control of autophagy
FEBS Journal 274 (2007) 3184–3197 ª 2007 The Authors Journal compilation ª 2007 FEBS 3193
Baf (50 nm, vacuolar H
+
-ATPase inhibitor) to inhibit
autophagosome–lysosome fusion [24], and E64d (5 lgÆmL
)1
,
inhibitor of cysteine proteases, including cathepsin B), and
PepA (5 lgÆmL
)1
, cathepsin D inhibitor) to inhibit lysosomal
protease activity, for an interval of 3.5 h. Cells were fixed
with 4% formaldehyde in NaCl ⁄ P
i
(pH 7.4) for 15 min.
To quantify the number of GFP–LC3 punctae in a single
cell, Z-stack images of single GFP–LC3-expressing cells
were captured using ·60 oil objective and then background
fluorescence was removed by applying a mean filter
(4-pixel) to each stack image. Maximal projection images
were produced, and the number of GFP–LC3 punctae per
cell was determined using imagej software (NIH, Bethesda,
MD)
10
. For population analysis, cells were inspected at 60·
magnification and classified as: (a) cells with predominantly
diffuse GFP–LC3 fluorescence; or as (b) cells with numer-
ous GFP–LC3 punctae (> 30 dots ⁄ cell), representing
autophagosomes. At least 200 cells were scored for each
condition in three or more independent experiments.
Determining the activity of the lysosomal
compartment
LysoTracker Red is a cell-permeable acidotropic probe that
selectively labels vacuoles with low internal pH and thus
can be used to label functional lysosomes. Following sI ⁄ R
and control experiments, cells were loaded with 50 nm
LysoTracker Red for 5 min in MKH; the medium was then
exchanged with dye-free MKH, and cells were imaged at
·40 magnification by fluorescence microscopy. Activity and
intracellular distribution of cathepsin B, a predominant
lysosomal protease, was assessed using (z-RR)
2
-MagicRed-
Cathepsin B substrate (B-Bridge International, Inc., Moun-
tain View, CA)
11
. MagicRed-Cathepsin B substrate was
added to the cells during the last 30 min of an experiment
according to the manufacturer’s instructions.
Calcium imaging
For dye loading, Fluo-4 was dissolved in in 20% (w ⁄ v) Plu-
ronic F-127 in dimethylsulfoxide (Invitrogen, Carlsbad,
CA; #P-300MP) to a 2 mm stock Fluo-4 ⁄ AM solution.
Cells were incubated for 20 min in 2 lm Fluo-2 ⁄ AM at
37 °C in MKH buffer. Then the dye-containing solution
was replaced with dye-free MKH buffer containing 0.1 mm
norepinephrine and cells were incubated for a further
30 min at 37 °C prior to imaging. Mito-CFP-transfected
cells were selected and 10 consecutive images (1Æs
)1
)of
Fluo-4 were acquired. TG (1 lm) was then added, allowed
to incubate for 1 min, and subsequently 10 consecu-
tive images (1Æs
)1
) of Fluo-4 fluorescence were acquired.
The average change in Fluo-4 fluorescence (F) intensity
(F
initial
⁄ (F
final
) F
initial
)) was determined from cellular image
intensities using the imagej multi-ROI function (rsb.info.
nih.gov ⁄ ij).
Western blotting
Whole-cell lysates were subjected to 10–20% trisglycine
SDS ⁄ PAGE and transferred to nitrocellulose membranes.
Blots were probed with anti-Bcl-2 serum (C-2, 1 : 200,
Santa Cruz Biotechnology, Santa Cruz, CA) or anti-
Beclin 1 serum (1 : 200).
Statistics
The probability of statistically significant differences
between two experimental groups was determined by Stu-
dent’s t-test. Values are expressed as mean ± SEM of at
least three independent experiments unless stated otherwise.
Acknowledgements
HL-1 cells were kindly provided by Dr William Clay-
comb (LSU Health Sciences Center, Louisiana). We
would like to thank Dr Clark Distelhorst (Case West-
ern Reserve University, Cleveland, Ohio) for providing
the Bcl-2 constructs, Dr Roger Tsien (University of
California, San Diego) for providing pRSET-mCherry,
Dr Beth Levine (University of Texas Southwestern,
Texas) for providing the Beclin 1 constructs, including
Beclin 1DBcl2-BD, and Dr Tamotsu Yoshimori (National
Institute of Genetics, Japan) for providing GFP–LC3.
This study was supported by the NIH grants R01-
AG21568 and R01-HL60590 (to RAG) and th e Stein
endowment fund. This is MS#18259 of The Scripps
Research Institute.
References
1 Cuervo AM (2004) Autophagy: many paths to the same
end. Mol Cell Biochem 263, 55–72.
2 Stromhaug PE & Klionsky DJ (2001) Approaching the
molecular mechanism of autophagy. Traffic 2, 524–531.
3 Mizushima N, Ohsumi Y & Yoshimori T (2002) Auto-
phagosome formation in mammalian cells. Cell Struct
Funct 27, 421–429.
4 Yue Z, Jin S, Yang C, Levine AJ & Heintz N (2003)
Beclin 1, an autophagy gene essential for early embryo-
nic development, is a haploinsufficient tumor suppres-
sor. Proc Natl Acad Sci USA 100, 15077–15082.
5 Nixon RA, Wegiel J & Kumar A, Yu WH, Peterhoff C,
Cataldo A & Cuervo AM (2005) Extensive involvement
of autophagy in Alzheimer disease: an immuno-electron
microscopy study. J Neuropathol Exp Neurol 64 ,
113–122.
6 Webb JL, Ravikumar B, Atkins J, Skepper JN &
Rubinsztein DC (2003) Alpha-synuclein is degraded by
both autophagy and the proteasome. J Biol Chem 278,
25009–25013.
Bcl-2 and calcium control of autophagy N. R. Brady et al.
3194 FEBS Journal 274 (2007) 3184–3197 ª 2007 The Authors Journal compilation ª 2007 FEBS
7 Yan L, Vatner DE, Kim SJ, Ge H, Masurekar M, Mas-
sover WH, Yang G, Matsui Y, Sadoshima J & Vatner
SF (2005) Autophagy in chronically ischemic myocar-
dium. Proc Natl Acad Sci USA 102, 13807–13812.
8 Saftig P, Tanaka Y, Lullmann-Rauch R & von Figura
K (2001) Disease model: LAMP-2 enlightens Danon
disease. Trends Mol Med 7, 37–39.
9 Xue L, Fletcher GC & Tolkovsky AM (2001) Mito-
chondria are selectively eliminated from eukaryotic cells
after blockade of caspases during apoptosis. Curr Biol
11, 361–365.
10 Shimizu S, Kanaseki T, Mizushima N, Mizuta T, Ara-
kawa-Kobayashi S, Thompson CB & Tsujimoto Y
(2004) Role of Bcl-2 family proteins in a non-apoptotic
programmed cell death dependent on autophagy genes.
Nat Cell Biol 6, 1221–1228.
11 Furuya N, Yu J, Byfield M, Pattingre S & Levine B
(2005) The evolutionarily conserved domain of Beclin 1
is required for Vps34 binding, autophagy and tumor
suppressor function. Autophagy 1 , 46–52.
12 Liang XH, Jackson S, Seaman M, Brown K, Kempkes
B, Hibshoosh H & Levine B (1999) Induction of auto-
phagy and inhibition of tumorigenesis by beclin 1.
Nature 402, 672–676.
13 Oberstein A, Jeffrey P & Shi Y (2007) Crystal structure
of the BCL–XL–beclin 1 peptide complex: beclin 1 is a
novel BH3-only protein. J Biol Chem 282, 13123–13132.
12
14 Pattingre S, Tassa A, Qu X, Garuti R, Liang XH,
Mizushima N, Packer M, Schneider MD & Levine B
(2005) Bcl-2 antiapoptotic proteins inhibit Beclin
1-dependent autophagy. Cell 122, 927–939.
15 Mizushima N, Noda T, Yoshimori T, Tanaka Y, Ishii
T, George MD, Klionsky DJ, Ohsumi M & Ohsumi Y
(1998) A protein conjugation system essential for auto-
phagy. Nature 395, 395–398.
16 Kabeya Y, Mizushima N, Yamamoto A, Oshitani-
Okamoto S, Ohsumi Y & Yoshimori T (2004) LC3,
GABARAP and GATE16 localize to autophagosomal
membrane depending on form-II formation. J Cell Sci
117, 2805–2812.
17 Mizushima N, Yamamoto A, Hatano M, Kobayashi Y,
Kabeya Y, Suzuki K, Tokuhisa T, Ohsumi Y & Yoshi-
mori T (2001) Dissection of autophagosome formation
using Apg5-deficient mouse embryonic stem cells. J Cell
Biol 152, 657–668.
18 Kabeya Y, Mizushima N, Ueno T, Yamamoto A, Kiri-
sako T, Noda T, Kominami E, Ohsumi Y & Yoshimori
T (2000) LC3, a mammalian homologue of yeast
Apg8p, is localized in autophagosome membranes after
processing. EMBO J 19 , 5720–5728.
19 Mizushima N, Yamamoto A, Matsui M, Yoshimori T
& Ohsumi Y (2004) In vivo analysis of autophagy in
response to nutrient starvation using transgenic mice
expressing a fluorescent autophagosome marker. Mol
Biol Cell 15, 1101–1111.
20 Tanida I, Minematsu-Ikeguchi N, Ueno T & Kominami
E (2005) Lysosomal turnover, but not a cellular level, of
endogenous LC3 is a marker for autophagy. Autophagy
1, 84–91.
21 Webb JL, Ravikumar B & Rubinsztein DC (2004)
Microtubule disruption inhibits autophagosome–lyso-
some fusion: implications for studying the roles of ag-
gresomes in polyglutamine diseases. Int J Biochem Cell
Biol 36, 2541–2550.
22 Lamparska-Przybysz M, Gajkowska B & Motyl T
(2005) Cathepsins and BID are involved in the molecu-
lar switch between apoptosis and autophagy in breast
cancer MCF-7 cells exposed to camptothecin. J Physiol
Pharmacol 56
13
Suppl 3, 159–179.
23 Yoshimori T, Yamamoto A, Moriyama Y, Futai M &
Tashiro Y (1991) Bafilomycin A1, a specific inhibitor of
vacuolar-type H(+)-ATPase, inhibits acidification and
protein degradation in lysosomes of cultured cells.
J Biol Chem 266, 17707–17712.
24 Yamamoto A, Tagawa Y, Yoshimori T, Moriyama Y,
Masaki R & Tashiro Y (1998) Bafilomycin A1 prevents
maturation of autophagic vacuoles by inhibiting fusion
between autophagosomes and lysosomes in rat hepa-
toma cell line, H-4-II-E cells. Cell Struct Funct 23,
33–42.
25 Claycomb WC, Lanson NA Jr, Stallworth BS, Egeland
DB, Delcarpio JB, Bahinski A & Izzo NJ Jr (1998)
HL-1 cells: a cardiac muscle cell line that contracts and
retains phenotypic characteristics of the adult cardio-
myocyte. Proc Natl Acad Sci USA 95, 2979–2984.
26 Noda T & Ohsumi Y (1998) Tor, a phosphatidylinositol
kinase homologue, controls autophagy in yeast. J Biol
Chem 273, 3963–3966.
27 Schmelzle T & Hall MN (2000) TOR, a central control-
ler of cell growth. Cell 103, 253–262.
28 Ravikumar B, Vacher C, Berger Z, Davies JE, Luo S,
Oroz LG, Scaravilli F, Easton DF, Duden R, O’Kane
CJ et al. (2004) Inhibition of mTOR induces autophagy
and reduces toxicity of polyglutamine expansions in fly
and mouse models of Huntington disease. Nat Genet 36,
585–595.
29 Levine B & Yuan J (2005) Autophagy in cell death: an
innocent convict? J Clin Invest 115, 2679–2688.
30 Eskelinen EL, Prescott AR, Cooper J, Brachmann SM,
Wang L, Tang X, Backer JM & Lucocq JM (2002) Inhi-
bition of autophagy in mitotic animal cells. Traffic 3,
878–893.
31 Arai K, Ohkuma S, Matsukawa T & Kato S (2001) A
simple estimation of peroxisomal degradation with
green fluorescent protein – an application for cell cycle
analysis. FEBS Lett 507, 181–186.
32 Hamacher-Brady A, Brady NR & Gottlieb RA (2006)
Enhancing macroautophagy protects against ischemia ⁄
reperfusion injury in cardiac myocytes. J Biol Chem
281, 29776–29787.
N. R. Brady et al. Bcl-2 and calcium control of autophagy
FEBS Journal 274 (2007) 3184–3197 ª 2007 The Authors Journal compilation ª 2007 FEBS 3195
33 Kochl R, Hu XW, Chan EY & Tooze SA (2006) Micro-
tubules facilitate autophagosome formation and fusion
of autophagosomes with endosomes. Traffic 7, 129–145.
34 Kihara A, Kabeya Y, Ohsumi Y & Yoshimori T (2001)
Beclin–phosphatidylinositol 3-kinase complex functions
at the trans-Golgi network. EMBO Rep 2, 330–335.
35 Liang XH, Kleeman LK, Jiang HH, Gordon G, Gold-
man JE, Berry G, Herman B & Levine B (1998) Pro-
tection against fatal Sindbis virus encephalitis by
beclin, a novel Bcl-2-interacting protein. J Virol 72,
8586–8596.
36 Criollo A, Maiuri MC, Tasdemir E, Vitale I, Fiebig
AA, Andrews D, Molgo J, Diaz J, Lavandero S, Harper
F et al. (2007) Regulation of autophagy by the inositol
trisphosphate receptor. Cell Death Differ 14, 1029–1039
14
.
37 Lithgow T, van Driel R, Bertram JF & Strasser A
(1994) The protein product of the oncogene bcl-2 is a
component of the nuclear envelope, the endoplasmic
reticulum, and the outer mitochondrial membrane. Cell
Growth Differ 5, 411–417.
38 Foyouzi-Youssefi R, Arnaudeau S, Borner C, Kelley
WL, Tschopp J, Lew DP, Demaurex N & Krause KH
(2000) Bcl-2 decreases the free Ca
2+
concentration
within the endoplasmic reticulum. Proc Natl Acad Sci
USA 97, 5723–5728.
39 Dremina ES, Sharov VS, Kumar K, Zaidi A, Michaelis
EK & Schoneich C (2004) Anti-apoptotic protein Bcl-2
interacts with and destabilizes the sarcoplasmic ⁄ endo-
plasmic reticulum Ca
2+
-ATPase (SERCA). Biochem J
383, 361–370.
40 Gordon PB, Holen I, Fosse M, Rotnes JS & Seglen PO
(1993) Dependence of hepatocytic autophagy on intra-
cellularly sequestered calcium. J Biol Chem 268 , 26107–
26112.
41 Hoyer-Hansen M, Bastholm L, Mathiasen IS, Elling F
& Jaattela M (2005) Vitamin D analog EB1089 triggers
dramatic lysosomal changes and Beclin 1-mediated
autophagic cell death. Cell Death Differ 12, 1297–1309.
42 Thastrup O, Cullen PJ, Drobak BK, Hanley MR &
Dawson AP (1990) Thapsigargin, a tumor promoter,
discharges intracellular Ca
2+
stores by specific inhibi-
tion of the endoplasmic reticulum Ca2(+)-ATPase.
Proc Natl Acad Sci USA 87, 2466–2470.
43 Palmer AE, Jin C, Reed JC & Tsien RY (2004) Bcl-2-
mediated alterations in endoplasmic reticulum Ca
2+
analyzed with an improved genetically encoded fluores-
cent sensor. Proc Natl Acad Sci USA 101, 17404–17409.
44 Savina A, Fader CM, Damiani MT & Colombo MI
(2005) Rab11 promotes docking and fusion of multivesi-
cular bodies in a calcium-dependent manner. Traffic 6,
131–143.
45 Nakano T, Inoue H, Fukuyama S, Matsumoto K,
Matsumura M, Tsuda M, Matsumoto T, Aizawa H &
Nakanishi Y (2006) Niflumic acid suppresses
interleukin-13-induced asthma phenotypes. Am J Respir
Crit Care Med 173, 1216–1221.
46 Munafo DB & Colombo MI (2002) Induction of auto-
phagy causes dramatic changes in the subcellular distri-
bution of GFP–Rab24. Traffic 3, 472–482.
47 Bampton ET, Goemans CG, Niranjan D, Mizushima N
& Tolkovsky AM (2005) The dynamics of autophagy
visualized in live cells: from autophagosome formation
to fusion with endo ⁄ lysosomes. Autophagy 1, 23–36.
48 Finn PF & Dice JF (2005) Ketone bodies stimulate cha-
perone-mediated autophagy. J Biol Chem 280, 25864–
25870.
49 Kiffin R, Christian C, Knecht E & Cuervo AM (2004)
Activation of chaperone-mediated autophagy during
oxidative stress. Mol Biol Cell 15, 4829–4840.
50 Massey AC, Kaushik S, Sovak G, Kiffin R & Cuervo
AM (2006) Consequences of the selective blockage of
chaperone-mediated autophagy. Proc Natl Acad Sci
USA 103, 5805–5810.
51 Kovacs AL & Seglen PO (1982) Inhibition of hepatocy-
tic protein degradation by inducers of autophagosome
accumulation. Acta Biol Med Ger 41, 125–130.
52 Jager S, Bucci C, Tanida I, Ueno T, Kominami E,
Saftig P & Eskelinen EL (2004) Role for Rab7 in
maturation of late autophagic vacuoles. J Cell Sci 117,
4837–4848.
53 Shibata M, Lu T, Furuya T, Degterev A, Mizushima N,
Yoshimori T, Macdonald M, Yankner B & Yuan J
(2006) Regulation of intracellular accumulation of
mutant Huntingtin by Beclin 1. J Biol Chem 281,
14474–14485.
54 Zeng X, Overmeyer JH & Maltese WA (2006) Functional
specificity of the mammalian Beclin–Vps34–PI 3-kinase
complex in macroautophagy versus endocytosis and lyso-
somal enzyme trafficking. J Cell Sci 119, 259–270.
55 Chami M, Prandini A, Campanella M, Pinton P, Sza-
badkai G, Reed JC & Rizzuto R (2004) Bcl-2 and Bax
exert opposing effects on Ca
2+
signaling, which do not
depend on their putative pore-forming region. J Biol
Chem 279, 54581–54589.
56 Chen Z, Chua CC, Ho YS, Hamdy RC & Chua BH
(2001) Overexpression of Bcl-2 attenuates apoptosis and
protects against myocardial I ⁄ R injury in transgenic
mice. Am J Physiol Heart Circ Physiol 280, H2313–
H2320.
57 Brocheriou V, Hagege AA, Oubenaissa A, Lambert
M, Mallet VO, Duriez M, Wassef M, Kahn A,
Menasche P & Gilgenkrantz H (2000) Cardiac
functional improvement by a human Bcl-2 transgene
in a mouse model of ischemia ⁄ reperfusion injury.
J Gene Med 2, 326–333.
58 Rizo J & Sudhof TC (1998) C2-domains, structure and
function of a universal Ca
2+
-binding domain. J Biol
Chem 273, 15879–15882.
Bcl-2 and calcium control of autophagy N. R. Brady et al.
3196 FEBS Journal 274 (2007) 3184–3197 ª 2007 The Authors Journal compilation ª 2007 FEBS
59 Demarchi F, Bertoli C, Copetti T, Tanida I, Brancolini
C, Eskelinen EL & Schneider C (2006) Calpain is
required for macroautophagy in mammalian cells. J Cell
Biol 175, 595–605.
60 Demarchi F, Bertoli C, Copetti T, Eskelinen EL &
Schneider C (2007) Calpain as a novel regulator of
autophagosome formation. Autophagy 3, 235–237
15
.
61 Yousefi S, Perozzo R, Schmid I, Ziemiecki A, Schaffner
T, Scapozza L, Brunner T & Simon HU (2006) Cal-
pain-mediated cleavage of Atg5 switches autophagy to
apoptosis. Nat Cell Biol 8, 1124–1132.
62 Duchen MR (2000) Mitochondria and calcium: from
cell signalling to cell death. J Physiol 529, 57–68.
63 Rizzuto R, Bernardi P & Pozzan T (2000) Mitochondria
as all-round players of the calcium game. J Physiol 529,
37–47.
64 Birkeland JA, Sejersted OM, Taraldsen T & Sjaastad I
(2005) EC-coupling in normal and failing hearts. Scand
Cardiovasc J 39, 13–23.
65 Belke DD & Dillmann WH (2004) Altered cardiac calcium
handling in diabetes. Curr Hypertens Rep 6, 424–429.
66 Brady NR, Hamacher-Brady A & Gottlieb RA (2006)
Proapoptotic BCL-2 family members and mitochondrial
dysfunction during ischemia ⁄ reperfusion injury, a study
employing cardiac HL-1 cells and GFP biosensors.
Biochim Biophys Acta 1757, 667–678.
N. R. Brady et al. Bcl-2 and calcium control of autophagy
FEBS Journal 274 (2007) 3184–3197 ª 2007 The Authors Journal compilation ª 2007 FEBS 3197