Báo cáo khóa học: Direct electrochemistry of the Desulfovibrio gigas aldehyde oxidoreductase docx
Bạn đang xem bản rút gọn của tài liệu. Xem và tải ngay bản đầy đủ của tài liệu tại đây (467.32 KB, 10 trang )
Direct electrochemistry of the
Desulfovibrio gigas
aldehyde
oxidoreductase
Margarida M. Correia dos Santos
1
, Patrı
´
cia M. P. Sousa
1
, M. Lurdes S. Gonc¸alves
1
, M. Joa
˜
o Roma
˜
o
2
,
Isabel Moura
2
and Jose
´
J. G. Moura
2
1
Centro de Quı
´
mica Estrutural, Instituto Superior Te
´
cnico, Lisboa, Portugal;
2
REQUIMTE, Departamento de Quı
´
mica,
Centro de Quı
´
mica Fina e Biotecnolo
´
gica, Faculade de Cie
ˆncias
e Tecnologia, Universidade Nova de Lisboa, Portugal
This work reports on the direct electrochemistry of the
Desulfovibrio gigas aldehyde oxidoreductase (DgAOR), a
molybdenum enzyme of the xanthine oxidase family that
contains three redox-active cofactors: two [2Fe-2S] centers
and a molybdopterin cytosine dinucleotide cofactor. The
voltammetric behavior of the enzyme was analyzed at gold
and carbon (pyrolytic graphite and glassy carbon) elec-
trodes. Two different strategies were used: one with the
molecules confined to the electrode surface and a second
with DgAOR in solution. In all of the cases studied, electron
transfer took place, although different redox reactions were
responsible for the voltammetric signal. From a thorough
analysis of the voltammetric responses and the structural
properties of the molecular surface of DgAOR, the redox
reaction at the carbon electrodes could be assigned to the
reduction of the more exposed iron cluster, [2Fe-2S] II,
whereas reduction of the molybdopterin cofactor occurs at
the gold electrode. Voltammetric results in the presence of
aldehydes are also reported and discussed.
Keywords: aldehyde oxidoreductase; Desulfovibrio gigas;
electrochemistry.
Voltammetric techniques are useful for unraveling import-
ant aspects of the chemistry of metalloproteins and metal-
loenzymes [1–4]. Unlike the more conventional and widely
used potentiometric titrations, voltammetric methods
allow in situ measurement of reduction potentials together
with acquisition of information about the kinetics of the
electrode reactions and relevant variables of coupled
reactions, including catalysis.
Until recently, voltammetric methods have not been very
widely applied to high molecular mass enzymes. Although
they are generally large and flexible, some of the centers are
quite deeply buried, and therefore successful interaction
with an electrode is difficult to achieve. However, it is now
well recognized that the electron-transfer process between
a redox protein and a solid electrode is a protein–electrode
surface recognition process. Therefore, techniques devel-
oped for the study of protein electrochemistry in the late
1970s should be suitable for studying enzymatic systems. A
wide range of working electrodes and strategies have been
used to study direct electrode processes of metalloproteins
contained in solution. Two main different approaches have
been followed: (a) the use of bare electrodes, mostly carbon,
which possess organic-like functionalities that can provide a
convenient surface for specific and favorable binding [5–10];
(b) the addition of a compound that binds to the electrode
surface or otherwise modifies the electrode interface and
encourages electron transfer to proceed [11,12].
Basically the same sort of electrodes have been used
in protein film voltammetry [13], where, to overcome the
problem of diffusion of the protein, the molecules under
investigation are deposited on a suitable electrode surface.
Adsorption should occur in such a way that molecules
retain their native fold and characteristic properties while
electron transfer occurs. In this case, a coadsorbate may be
required to achieve and optimize adsorption of the protein
and observation of voltammetric signals. It is interesting to
note that the latter approach ruled out the idea that protein
adsorption always posed an undesirable problem. The
important point is that, independently of the nature and
strength of the interactions between the biological molecules
and the electrode surfaces, their native properties should
be preserved. In undesirable situations, the interaction of
the protein with the electrode surface may lead to blocking
of the electrochemical activity, at least at the reversible
potential, as determined from potentiometric measure-
ments. In this case, significant changes in the rates of
electron transfer and hence reduction potentials are expec-
ted to be found.
Desulfovibrio gigas aldehyde oxidoreductase (DgAOR) is
a molybdopterin-containing enzyme belonging to the xan-
thine oxidase family. It is a homodimer of two 100-kDa
subunits with a low isoelectric point (pI ¼ 4.7), roughly
globular, with a diameter of % 75 A
˚
[14–17]. A single
polypeptide of 907 amino-acid residues contains three redox
centers: the active site, formed by a fivefold-co-ordi-
nated Mo atom bound to two oxygen ligands, one sulfur
and one molybdopterin cytosine dinucleotide, and two
Correspondence to M. M. Correia dos Santos, Centro de Quı
´
mica
Estrutural, Instituto Superior Te
´
cnico, Avenida Rovisco Pais,
1049-001 Lisboa, Portugal.
Fax: + 351 218464455, Tel.: + 351 218419272,
E-mail:
Abbreviations: SHE, standard hydrogen electrode; CV, cyclic
voltammetry; SW, square wave voltammetry; DP, differential pulse
voltammetry; GCE, glassy carbon electrode; PGE, pyrolytic
graphite electrode.
(Received 3 December 2003, revised 1 February 2004,
accepted 16 February 2004)
Eur. J. Biochem. 271, 1329–1338 (2004) Ó FEBS 2004 doi:10.1111/j.1432-1033.2004.04041.x
spectroscopically distinguishable [2Fe-2S] centers, classified
as type I and type II [18]. These three redox centers are
aligned within the protein matrix to produce a suitable
intramolecular electron-transfer pathway. The molybdop-
terin cofactor contacts the nearest [2Fe-2S] cluster Fe-S I
through the exocyclic NH
2
of the pyranopterin ring system
and the S
.c
atom of one of the [Fe-S] cysteine ligands
(Cys139). The connection between the two [2Fe-2S] centers
involves seven main chain covalent bonds and one hydrogen
bond. [Fe-S] center I is buried, % 15 A
˚
below the molecular
surface, whereas cluster [2Fe-2S] II is more exposed to the
solvent via its Cys60.
A typical feature of molybdopterin-containing enzymes
in general is the fact that the molybdenum active site is
rather deeply buried (% 10–15 A
˚
away from the surface)
but reachable through a channel which allows substrate
molecules to reach the active site and products to be
released. In the DgAOR, there is a funnel shaped cavity that
is wider on the surface (% 17 A
˚
diameter, measured from
Ala631 to Leu254) and becomes narrower when closer to
the Mo (% 6A
˚
diameter, measured from Phe494 to
Leu626). Non-polar residues, at its half-length (Phe425,
Phe494, Leu497 and Leu626), dominate the tunnel. Under
conditions of enzymatic turnover (oxidation of aldehydes
to the corresponding carboxylic acids), electrons are trans-
ferred from the Mo site, via the two [2Fe-2S] centers to an
external electron acceptor [19].
The redox transitions involved have been studied by
EPR–potentiometric methods. The redox potentials of
the [Fe-S] centers and Mo site were found to be:
E°
¢
[Fe-S I] ¼ )280; E°
¢
[Fe-S II] ¼ )285; E°
¢
[Mo(VI)/
Mo(V)] ¼ )450; E°
¢
[Mo(V)/Mo(IV)] ¼ )530 [all values
in mV and referred to the standard hydrogen electrode
(SHE)] [14,15,20]. An independent study indicated more
negative redox potentials for the [Fe-S] centers: )365 mV
(center I) and )330 mV (center II) [21].
Direct voltammetric investigations of the mononuclear
molybdenum enzymes are scarce. Some reports have
involved the enzymes nitrate reductase [22,23] and dimethyl
sulfoxide reductase from Escherichia coli [24], and, although
catalytic voltammetry was demonstrated, no voltammetric
response from the Mo active site of these enzymes was
observed in the absence of substrate.
A first nonturnover voltammetric response was reported
recently for dimethyl sulfoxide reductase from Rhodobacter
capsulatus, where distinct Mo
VI/V
and Mo
V/IV
couples were
seen [25]. The same group succeeded in achieving direct
electrochemistry of a bacterial sulfite dehydrogenase in the
absence of substrate and both Mo and heme-centered redox
responses were identified [26].
More recently, the direct electron transfer of chicken liver
sulfite oxidase was also reported [27,28] corresponding to
the redox transformation of the heme domain of sulfite
oxidase.
The electrochemistry of xanthine oxidase analysed on
glassy carbon and mercury electrodes showed that dena-
turation of the enzyme occurs, leading to the observation of
the voltammetric response of free FAD. No molybdenum
or [2Fe-2S] electrochemistry was detected [29].
In this work, we report the first direct voltammetric
response under nonturnover conditions of DgAOR. Its
voltammetric behavior was analyzed using different tech-
niques (cyclic, square wave, and differential pulse voltam-
metry) on carbon (glassy carbon and pyrolytic graphite) and
gold electrodes. Two strategies were used: (a) with the
molecules confined to the surface of the electrode, and so
absent from the electrolyte; (b) solutions containing the
enzyme. In some experiments, neomycin was also used.
In all cases the supporting electrolyte was 0.10
M
KCl at
pH 7.6 (Tris/HCl buffer). Depending on the nature of the
electrode/solution interface, two separate redox reactions
were identified which could be assigned to the cluster
[2Fe-2S] II and the Mo active site after careful analysis of
the voltammetric data and the structural properties of the
electrostatic molecular surface of DgAOR.
Materials and methods
DgAOR was isolated and purified as described previously
[14,15]. Neomycin was purchased from Sigma. All other
chemicals used were pro-analysis grade and all solutions
were made up with deionized water from a Milli-Q water
purification system.
Protein solutions with concentrations 75–120 l
M
were
prepared in 0.1
M
KCl and 50 m
M
Tris/HCl buffer, pH 7.6.
The concentration of the oxidized form of the enzyme was
determined spectrophotometrically at 462 nm using the
molar asbsorptivity e ¼ 20 000 cm
)1
Æ
M
)1
[19].
Voltammetric measurements were performed using a
potentiostat/galvanostat (Autolab/PSTAT 10) from ECO
Chemie (Utrecht, the Netherlands), as the source of applied
potential and as a measuring device. The whole system was
controlled by a personal computer that was also used in the
data analysis, processed by the
GPES
software package from
ECO Chemie. In cyclic voltammetry (CV) the scan rate,
v, varied between 10 and 1000 mVÆs
)1
. In square wave
voltammetry (SW), the square wave amplitude, E
sw
,was
50 mV, the step height, DE
sw
, was 10 mV, and the
frequency varied between 8 and 300 Hz. In differential
pulse voltammetry (DP), the pulse amplitude was 50 or
25 mV and the pulse duration, t
p
, varied between 25 and
75 ms. In all experiments the potential was varied between
an initial value E
i
¼ 205 mV and a final value
E
f
¼ )795 mV vs. SHE.
An electrochemical cell designed for small volumes from
BAS (ref. MF-1065; Bioanalytical Systems, West Lafyette,
IN, USA) was used. The cell featured a conventional three-
electrode configuration. The reference electrode was a silver/
silver chloride (BAS ref. MF-2052) with a potential of
205 mV vs. SHE, and the auxiliary electrode was a platinum
wire. The working electrodes were a gold disk with nominal
radius ¼ 0.8 mm purchased from BAS (ref. MF-2014),
a glassy carbon electrode (GCE) also from BAS (ref. MF-
2012) with nominal radius ¼ 1.5 mm, and a pyrolytic
graphite electrode (PGE) with nominal radius ¼ 2 mm.
Before each experiment, or set of experiments, the
electrodes were washed with water, polished by hand using
a water/alumina (0.3 lm) slurry (ref. 40-6352-006; Buelher
GmbH, Dusseldorf, Germany) on a polishing cloth, soni-
cated briefly to remove the adhering alumina, and finally
rinsed well with water.
The areas of the electrodes used were determined from
their response in a known concentration of the ferro/
ferricyanide couple [30]. They were found to be 0.0195 cm
2
1330 M. M. Correia dos Santos et al.(Eur. J. Biochem. 271) Ó FEBS 2004
for the gold electrode, 0.0651 cm
2
for the GCE, and
0.1195 cm
2
for the PGE.
Procedures
In the experiments with the molecules confined to the
electrode surface, a drop of 2 lL DgAOR solution (in Tris/
HCl buffer) was placed on the electrode surface, which had
been polished previously. The electrode was allowed to dry
in air through moderate warming with a heat gun and then
immersed in the electrolyte solution. In some experiments,
2m
M
neomycin was added to the DgAOR drop and/or the
electrolyte solution.
The solutions were deaerated for 15 min with U-type
nitrogen that had been previously passed through the
supporting electrolyte and then saturated with water.
All measurements were performed at least in duplicate in
a temperature-controlled room at T ¼ 20 ± 1 °C.
Electrostatic surface potential calculations
Electrostatic surface potential was calculated with
GRASP
[31]. These molecular surfaces show the electrostatic poten-
tial coloured from )10 k
B
T (red) to 10 k
B
T (blue), where k
B
is the Boltzman constant, and T the absolute temperature.
Results and discussion
Electrochemical response of
Dg
AOR at the PGE and GCE
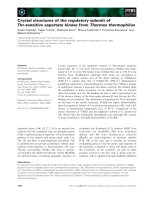
In Fig. 1 are shown typical cyclic voltammograms obtained
from a drop of a solution of DgAOR (98 l
M
in Tris buffer)
placed on the surface of the PGE, then immersed in the
electrolyte solution. Similar voltammograms were obtained
using the same strategy on the GCE although the response
was less stable during repeated potential cycling. In any
case, no further redox signals were detected in the cyclic
voltammograms even when potentials as negative as
)795 mV vs. SHE (lower limit imposed by the breakdown
of the solvent) were used.
Analysis of the cyclic voltammograms obtained either at
the PGE or at the GCE, show that both the cathodic and
anodic peak currents vary linearly (r > 0.999) with a null
intercept with the scan rate at least up to 500 mVÆs
)1
.Asto
the width at half height, DE
p,1/2
, remains constant for both
the cathodic and anodic peaks over the scan rate range and
equal to 100 ± 6 mV and 91 ± 6 mV, respectively. Peak-
to-peak separations, E
pa
) E
pc
, also remain constant with
v and equal to 35 ± 2 mV. This behavior indicates that
the voltammetric response arises from a diffusionless redox
process in which both oxidized and reduced forms are
adsorbed [32,33]. In spite of the fact that E
pa
) E
pc
is not
zero, as it should be for rapid electron exchange with a
homogeneous population of noninteracting adsorbed spe-
cies, the redox process can be considered reversible because
E
pa
) E
pc
is less then 50 mV and constant with scan rate.
This agrees with other work where finite peak separations
were reported for reversible electron transfer in which
the redox couple was immobilized on the electrode [34]. The
peak separation could not be explained on the basis of
the electron-transfer kinetics, and various explanations such
as molecule–molecule interactions have been suggested [35].
As to the number of electrons involved (n), comparing
the values obtained for DE
p,1/2
with the theoretical value
for a reversible electron reaction, DE
p,1/2
¼ 90/n mV
(T ¼ 20 °C) [32,33], we conclude that n must be one.
The formal reduction potential, E°
¢
a
, can thus be
estimated from the average of the reduction and oxidation
peak potentials (E
pc
+ E
pa
)/2. As (E
pc
+ E
pa
)/2 ¼
)259 ± 5 mV vs. SHE at the GCE and (E
pc
+ E
pa
)/2 ¼
)269 ± 5 mV vs. SHE at the PGE, E°
¢
a
¼ )264 ± 5 mV
vs. SHE.
The amount of active enzyme on the electrode surface can
be evaluated through the dependence of either the cathodic
or anodic CV peak currents, I
p
(A), on the scan rate v (VÆs
)1
)
using the relationship valid for reversible reduction of an
adsorbed species [32,33]:
I
p
¼ 9:39 Â 10
5
An
2
Cv ð1Þ
where G (molÆcm
)2
) is the surface concentration of adsorbed
DgAOR, A (cm
2
) is the electrode area, and the other
symbols have the meaning previously defined. Taking the
average values calculated at both the PGE and GCE, we
calculated the coverage G ¼ (2.6 ± 0.6) · 10
)11
molÆcm
)2
,
using the electrode surface area determined as described
in Materials and methods. From this value, one can
compute the area ÔoccupiedÕ by each DgAOR molecule as
(6 ± 1) · 10
)14
cm
2
, equivalent to a circle of radius 14 A
˚
or
a square with sides of 25 A
˚
. The significance of this value
will be discussed below.
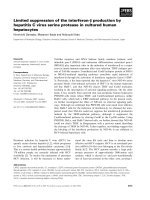
SWwasalsousedtofollowDgAOR redox behavior from
a drop of solution of the enzyme deposited on the surface of
either the PGE or the GCE, which were then immersed in
the cell containing the electrolyte solution. As an example,
in Fig. 2 are shown the SW voltammograms obtained at the
GCE in the frequency range, f,8<f < 100 Hz. Similar
SW voltammograms were observed at the PGE. In both
situations, the normalized SW peak currents, I
p
/(f)
1/2
,
depart from a constant value for low f, then increasing
with the frequency, as can be seen in the inset of
Fig. 2. The peak and half-width potentials of the SW
Fig. 1. Cyclic voltammograms of 98 l
M
DgAOR immobilized on the
PGE with scan rates, v (mV
Æ
s
)1
), of 50 < v < 1000. Supporting
electrolyte: 0.10
M
KCl and 50 m
M
Tris/HCl buffer (pH 7.6).
Ó FEBS 2004 Direct electrochemistry of DgAOR (Eur. J. Biochem. 271) 1331
voltammograms both remain constant with f and equal to
E
p
¼ )272 ± 5 mV vs. SHE and W
1/2
¼ 116 ± 5 mV,
respectively (values shown are averages obtained at the PGE
and GCE). These features also show that we are looking at a
reversible one-electron process in which both the reactant
and the product are adsorbed [36,37]. Peak potential values
of the SW voltammograms are then a direct measure of
the formal potential of reduction, i.e. E°
¢
a
¼ )272 ± 5 mV,
which is in perfect agreement with the value determined by
cyclic voltammetry.
More experiments were performed using DP following the
procedure described. Just one reduction peak was observed
with a peak current that depended on the pulse width, while
its peak and half-width potentials remained constant
and equal to E
p
¼ )249 ± 5 mV vs. SHE and W
1/2
¼
92 ± 2 mV, respectively. This corresponds to a one-
electron reversible redox reaction with a formal potential
of E°
¢
a
¼ E
p
+ DE/2 ¼ )274±5mVvs.SHE[33,38].
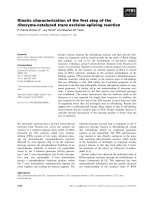
A new set of experiments was carried out using CV, but
this time placing the electrodes in the solution containing the
electrolyte as well as the enzyme (98 l
M
). A poor response
was obtained at the GCE, but well-defined and stable cyclic
voltammograms were obtained at the PGE, as shown in
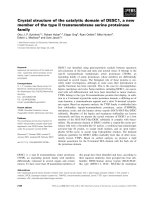
Fig. 3. In Fig. 4A, one can see the variation in the logarithm
of the cathodic and anodic CV peak currents with the log
of the scan rate, whereas in Fig. 4B the variation in the
cathodic and anodic CV peak potentials with the logarithm
of v can be seen.
In Fig. 4A, two linear portions are apparent with
different slopes: a slope close to 0.5 for scan rates
5<v <100mVÆs
)1
, and a slope that tends to 1 for the
higher scan rates. These observations suggest that two
mechanisms are operating: mainly a diffusion-controlled
one for the lowest scan rates, and reduction from an
adsorbed state for the highest scan rates [33]. The enzyme
must approach close to the electrode and interact with the
electrode surface so that electron transfer can occur.
Desorption and diffusion away from the electrode then
takes place, the relative importance of the diffusion and
diffusionless processes depending on the scan rate.
As to the dependence of peak potentials on the scan rate,
at rates of 5 < v <100mVÆs
)1
they remain fairly constant.
The same happens with the peak potential separations,
which remain close to E
pa
) E
pc
¼ 88 ± 5 mV. From the
cyclic voltammograms, the difference |E
p
) E
p/2
| ¼ 60 mV
was also determined. For v in the range 100 <
v < 1000 mVÆs
)1
the peak potentials clearly become
dependent on the scan rate.
Reduction of DgAOR from solution does not differ
significantly from reversibility, as can be concluded from the
nondependence of E
p
values on v, being the formal potential
of reduction (E
pc
+ E
pa
)/2 ¼ E°
¢
¼ )257 mV vs. SHE.
One electron is exchanged, as can be concluded from the
peak-to-peak separation and the difference |E
p
) E
p/2
|
(theoretical values of 58/n and of 56/n mV at 20 °C,
respectively, for a nersntian process [33]). An estimation of
the diffusion coefficient, D (cm
2
Æs
)1
), of DgAOR can be
computed from the slope of the straight line of I
p
(A) vs.
v
1/2
(VÆs
)1
)
1/2
for 5 < v < 100 mVÆs
)1
according to Eqn (2),
which is valid for a reversible process [33]:
I
p
¼ 2:69 Â 10
5
An
3=2
CD
1=2
v
1=2
ð2Þ
where C (molÆcm
)3
) is the concentration of the enzyme
in solution and the other symbols have the meaning
Fig. 2. Square wave voltammograms of 98 l
M
DgAOR immobilized on
the GCE with frequencies, f (Hz), of 8 < f <300.Supporting elec-
trolyte: 0.10
M
KCl and 50 m
M
Tris/HCl buffer (pH 7.6). Inset: vari-
ation in the SW normalized peak current with the square root of the
frequency.
Fig. 3. Cyclic voltammograms of 98 l
M
DgAORinsolutionatthePGE
with scan rates, v (mVÆs
)1
): (A) 5 < v < 100; (B) 100 < v < 1000.
Supporting electrolyte: 0.10
M
KCl and 50 m
M
Tris/HCl buffer
(pH 7.6).
1332 M. M. Correia dos Santos et al.(Eur. J. Biochem. 271) Ó FEBS 2004
previously defined. A value of D ¼ (8 ± 1) · 10
)7
cm
2
Æs
)1
was computed, which compares quite well with
D ¼ 7 · 10
)7
cm
2
Æs
)1
, estimated from the expression
valid for spherical molecules with high molecular mass
D ¼ 3.3 · 10
)5
/(PM)
1/3
(where PM is the molecular mass
of the DgAOR) [39]. This further corroborates the previous
discussion.
For the higher scan rates, reduction from the adsorbed
state seems to predominate over the diffusion process, and
as the anodic to cathodic peak potential separation steadily
increases with the scan rate, the redox reaction departs
from reversibility. Although Eqn (1) is strictly valid for a
reversible process, it is interesting to note that the electro-
active DgAOR coverage estimated from the slope of the
straight line of I
p
vs. v obtained for the highest scan rates
was G ¼ 4 · 10
)11
molÆcm
)2
. This corresponds to an area
per molecule of 4 · 10
)14
cm
2
, equivalent to a circle with
radius close to 12 A
˚
or a square of 20 · 20 A
˚
.Thesevalues
agree, within experimental error, with those obtained with
the enzyme absent from the electrolyte solution and
confined to the electrode surface.
As (E
pc
+ E
pa
)/2 remains constant within experimental
error, E°
¢
a
can be computed as the mean value over the
scan rate range. The value obtained is shown in Table 1,
together with those previously presented.
Our first observation is that, within experimental error,
all values agree fairly well. This is not surprising for the
values obtained at both the PGE and GCE for the
diffusionless process. The difference in the response
stability reported at the carbon electrodes is related to
the degree of functionality on the surface, which may be
different at the PGE from the GCE. However, the formal
potential of reduction is not affected. It is more surpris-
ing for the diffusion-controlled reduction of the
DgAOR-containing solution at the PGE observed for
v< 100 mVÆs
)1
because, in this case, E°
¢
refers to the
species in solution and not to the electrochemical reaction
of the adsorbed species. The two formal potentials are
related through Eqn (3) [40]:
E
0
a
¼ E
0
ÀðRT=nFÞ lnðb
O
=b
R
Þð3Þ
where b
O
and b
R
are equilibrium parameters related to the
adsorption of the oxidized (O) and reduced (R) species,
respectively. So, the location of E
p
with respect to E
¢
depends on the relative strength of adsorption of the oxidized
and reduced species. From the values shown in Table 1 we
can conclude that b
O
ffi b
R
as E
¢
a
¼ E
¢
, which means that
the reactivity of adsorbed DgAOR is comparable to that
of the enzyme free in solution. This supports the suggestion
that the native structure of the enzyme seems to be preserved
in the adsorbed state. As to the type of adsorption, if
both species are either strongly or weakly adsorbed the
qualitative behavior will be about the same [41].
Identification of the redox center responsible for the
voltammetric signal is a crucial step at this stage of the
analysis. As only one electron is exchanged, as concluded
from a careful analysis of the voltammetric data and
taking into account the redox potentials determined by
mediated potentiometry followed by EPR, i.e. E°
¢
[Fe-S I] ¼
)280; E°
¢
[Fe-S II] ¼ )285; E°
¢
[Mo(VI)/Mo(V)] ¼ )450;
E°
¢
[Mo(V)/Mo(IV)] ¼ )530 (all values in mV and referred
to the SHE) [14,15,20], the redox reaction can be assigned to
center II which is exposed to the solvent through its Cys60
residue. An independent study indicated more negative
Fig. 4. (A) Variation in the logarithm of CV
cathodic and anodic peak currents with the
logarithm of the scan rate; (B) variation in the
CV cathodic and anodic peak potentials with
the logarithm of the scan rate of the cyclic vol-
tammograms of 98 l
M
DgAOR in solution at
the PGE. Supporting electrolyte: 0.10
M
KCl
and 50 m
M
Tris/HCl buffer (pH 7.6).
Table 1. Comparison of formal potential values vs. SHE for the
reduction of DgAOR estimated from voltammetric techniques at carbon
electrodes. Medium: 50 m
M
Tris/HCl (pH 7.6).
Conditions CV SW DP
Solution
(pyrolytic graphite)
) 257
a
––
) 280
b
Adsorption
(glassy carbon)
) 259 ) 273 ) 270
Adsorption
(pyrolytic graphite)
) 269 ) 271 ) 277
a
v 6 50 mVÆs
)1
;
b
v P 100 mVÆs
)1
.
Ó FEBS 2004 Direct electrochemistry of DgAOR (Eur. J. Biochem. 271) 1333
redox potentials for the [Fe-S] centers: )365 mV (center I)
and )330 mV (center II) [21]. The reason for the discrep-
ancy between the two sets of values is not obvious. The
voltammetric data reported here are more consistent with
the values determined in [15]. Analysis of the electrostatic
surface potential in the region of the molecule close to the
exposed [Fe-S II] center shows that, within a radius of
% 9A
˚
(defined from Gln131 to Cys30, as shown in
Fig. 5A), there is a predominance of positively charged
residues. This positively charged region might correspond to
the (unknown) physiological acceptor-docking site. Thus, a
strong electrostatic attraction must exist between this
positively charged domain on the surface of DgAOR and
the negatively charged surface of the electrodes through
deprotonation (pK ¼ 5.6 [5]) of acidic C-O functionalities
of carbon. Note also that there is good general agreement
between the surface area coverage, and hence the area
effectively occupied by each DgAOR molecule previously
estimated by the CV data, and the area assigned to this
positively charged domain (3 · 10
)14
cm
2
per molecule).
This further corroborates that, on a carbon electrode and in
spite of the overall negative charge of the enzyme and the
negative charge of the electrode surface, DgAOR positions
itself in such an orientation that the cluster [2Fe-2S] II
interacts with the electrode and electron transfer takes place.
Taking the mean of the values shown in Table 1, the formal
potential of reduction is (E°
¢
) ¼ )270 ± 8 mV vs. SHE.
Electrochemistry of
Dg
AOR at the gold electrode
Using gold electrodes, no relevant response was obtained
with the enzyme either placed on its surface or dissolved
in the electrolyte solution unless neomycin was present,
indicating that, in both situations, interaction of the enzyme
with the electrode surface is promoted by this aminoglyco-
side. However, weak and unstable waves were obtained with
the enzyme confined to the surface of the gold electrode.
Repeated cycling showed that the signals diminished rapidly
after the first scan even with neomycin present, both in the
coating and the electrolyte solutions.
Reproducible and stable voltammograms were only
obtained for the reduction of DgAOR in the electrolyte
solution, containing neomycin. Typical cyclic voltammo-
grams at the gold electrode are shown in Fig. 6 for a
solution containing 92 l
M
DgAOR, 0.1
M
KCl, Tris/HCl
buffer, pH 7.6, and 2 m
M
neomycin for scan rates in the
range 5–1000 mVÆs
)1
. Just one reduction wave appears at
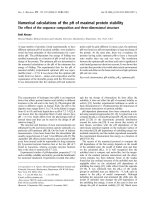
Fig. 5. Electrostatic surface potential for DgAOR calculated using
GRASP
[31] in two orientations. These molecular surfaces show the
electrostatic potential colored from )10 k
B
T (red) to 10 k
B
T (blue).
(A) This representation is oriented in the direction of the exposed
[2Fe-2S] cluster II which is the site of transfer of electrons to an
external electron acceptor. (B) This representation faces the entrance
through the funnel-shaped cavity into the molybdenum active site.
Fig. 6. Cyclic voltammograms of 92 l
M
DgAOR in solution containing
2m
M
neomycin sulfate at the gold electrode with scan rates, v (mVÆs
)1
)
of 20 < v < 1000. Supporting electrolyte: 0.10
M
KCl and 50 m
M
Tris/HCl buffer (pH 7.6). Insets: variation (A) in the CV cathodic peak
current with the scan rate and (B) in the CV cathodic peak potential
with the logarithm of the scan rate.
1334 M. M. Correia dos Santos et al.(Eur. J. Biochem. 271) Ó FEBS 2004
potentials considerably more negative than those observed
with the PGE and GCE. For the highest scan rates, an
anodic counterpart develops, the peak current of which
increases with the increase in v and the peak potential of
which depends on the scan rate. Further analysis of the
voltammograms revealed that a very good linear relation-
ship with a null intercept of I
p
vs. v was always obtained
(r > 0.999) (inset in Fig. 6 shows the plot of the CV
cathodic peak current against scan rate). The variation in
the potential, shown in the inset in Fig. 6, clearly indicates
that two behaviors are observed: for the lowest scan rates
(10–100 mVÆs
)1
), E
p
changes linearly with log v, the slope
being close to 60 mV; for higher values of v (100–
1000 mVÆs
)1
), there is still a linear variation of E
p
vs. log v
but with a steeper slope (close to 120 mV). Simultane-
ously, an anodic counterpart begins to appear with the
increase in scan rate. Over this range of scan rates
(100 < v <1000mVÆs
)1
), (E
pc
+ E
pa
)/2 values were rea-
sonably constant and equal to )530 ± 10 mV vs. SHE.
The same happened with the difference |E
p
) E
p/2
|, which
was equal to 88 ± 6 mV.
The dependence of the peak currents on the scan rate,
and not on the square root of the scan rate, clearly
indicates that the reduction is affected by adsorption. The
E
p
dependence on v suggests that two mechanisms can
operate. Indeed, in the case of a nonreversible reduction,
for both surface-confined species and diffusion-controlled
processes, peak potentials depend on the scan rate but in
different ways. For a totally irreversible diffusion-con-
trolled reduction, E
p
shifts in the negative direction by the
amount 30/an
a
mV (25 °C) for every 10-fold increase in v.
However, for a nonreversible reduction of an adsorbed
species, this variation is 60/an
a
mV (25 °C), where a is the
charge transfer coefficient and n
a
the number of electrons
involved in the rate-determining step [32,33]. Therefore, it
looks as if a mixture of diffusion-controlled and surface-
confined behaviors occurs. For the lowest scan rates, the
reduction of the enzyme from solution seems to predom-
inate, being responsible for the peak potential behavior,
whereas the reduction of DgAOR adsorbed on the
electrode determines both the I
p
and E
p
behaviors found
for the highest scan rates.
The appearance of an anodic counterpart while v
increases suggests that another process is coupled to the
redox reaction (following it), which is triggered by the
highest scan rates. Additional evidence for this can be
found in the variation in I
pa
/I
pc
with the scan rate which
tends to increase with v. In the case of a coupled process
following up the electron transfer (the equivalent of an EC
mechanism i.e., chemical reaction following charge trans-
fer), the wave also shifts towards negative potentials with
theincreaseinv by an amount depending on the degree of
reversibility of the redox reaction and the occurrence of
adsorption [33,42].
Undoubtedly, the redox reaction occurs by different
mechanisms, and assignment to the redox centers respon-
sible for the voltammetric signal is more complicated. Even
information on the number of electrons exchanged is
far from conclusive. The experimental |E
p
) E
p/2
| ¼
88 ± 6 mV values can be explained in terms of (a) the
nonreversibility of the redox reaction [33], (b) possible
interaction between the enzyme molecules near the electrode
surface [40,43], and (c) in terms of two redox processes that
are not well separated, which would cause the individual
waves to be merged into a broader wave [44].
Taking into account (a) the reasonable constancy
of (E
pc
+ E
pa
)/2 values over a 10-fold increase in v
()530 ± 10 mV), (b) the redox potentials determined
by potentiometry for the Mo redox center, and (c) the
results obtained for the reduction of DgAOR on the carbon
electrodes, the redox wave must be due to the reduction
of molybdenum. Although this is a stepwise reduction,
Mo(VI) fi Mo(V) and Mo(V) fi Mo(IV), just one
broad wave would be detected in CV as E°
¢
Mo(V)/Mo(IV)
)
E°
¢
Mo(VI)/Mo(V)
> )180 mV [44].
Again, the nature of the electrode surface and the
structural and electrostatic properties of the molecular
surface should explain the reduction behavior of DgAOR
from solutions at a gold electrode in the presence of
neomycin. Neomycin is an aminoglycoside with a spatial
arrangement of NH
3
+
groups on a quasi-rigid framework,
with a charge higher than 4 at pH 7 [9]. Like other positively
charged compounds, such as poly(
L
-lysine), neomycin has
been used to promote stable interaction between graphite
electrodes and small negatively charged electron-transfer
proteins and enzymes [45]. It has also been successfully used
to achieve a direct electrochemical response of a negatively
charged protein at a gold electrode [46]. Interaction with the
electrode surface takes place through the nitrogen atoms,
while the NH
3
+
groups oriented towards the solution are
able to build up a suitable domain for the interaction with
the negatively charged domain on the protein.
In DgAOR, the molybdenum site is buried but accessible
to the protein surface through a 15-A
˚
-deep tunnel as
described above. As shown in Fig. 5B, a negatively charged
region surrounding the channel entrance dominates the
electrostatic potential at the surface of the protein in
this region. Therefore, a favorable electrostatic interaction
should exist between this negatively charged region on the
surface of DgAOR and the electrode surface through the
NH
3
+
groups of neomycin. The enzyme can position itself
on the electrode surface in such an orientation that it
allows the electron-transfer flow to the active site. The area
ÔoccupiedÕ by each DgAOR molecule can be estimated from
the dependence of the peak current on the scan rate using
Eqn (1). The calculations were performed with n ¼ 1and
n ¼ 2, and 2 · 10
)15
cm
2
per molecule and 7 · 10
)15
cm
2
per molecule were the values obtained, respectively. Taking
the average value, one can say that each molecule interacts
with the electrode through a region defined by a circle of
radius 4 A
˚
. This is additional evidence that, on a gold
electrode and in the presence of neomycin, the redox
reaction observed is due to the reduction of the Mo atom of
the molybdopterin cofactor. Indeed, although the molyb-
denum site is buried, it is accessible to the protein surface
through a funnel shaped depression of diameter % 17 A
˚
on
the surface, which becomes narrower when closer to the
Mo active site (Fig. 5B).
The nature of the process coupled to the redox reaction
and responsible for the appearance of an anodic counterpart
on the cyclic voltammograms can now be assigned to an
intramolecular reaction through which electrons flow from
the reduced Mo to the iron-sulfur centers. Indeed the
redox active cofactors of DgAOR are inserted into the
Ó FEBS 2004 Direct electrochemistry of DgAOR (Eur. J. Biochem. 271) 1335
protein matrix in close proximity, suggesting a plausible
electron-transfer pathway. Once Mo(VI) is reduced to
Mo(IV), electrons can be transferred through the pterin and
hydrogen bond, pterin-NH
2
–Sc-C139 to the [Fe-S] center I.
Electron transfer proceeds further via seven covalent bonds
and one hydrogen bond (NH Ala136–O¼C C45) towards
the exposed cluster [2Fe-2S] II [16,20].
Electrochemistry of
Dg
AOR in the presence of aldehydes
Cyclic voltammetry was used to analyze the behavior of
DgAOR in the presence of increasing concentrations of
benzaldehyde and acetaldehyde. The voltammetric data
obtained for DgAOR at the carbon electrodes, assigned
to the redox process involving the exposed [Fe-S] center,
showed that the response remains invariant in the presence
of aldehydes. More interesting is the behavior found for the
molybdenum redox reaction at the gold electrode, where
an increase in the cathodic peak current was observed on
aldehyde additions (benzaldehyde and acetaldehyde, as can
be seen in Fig. 7 for benzaldehyde). All other characteristics
of the CV voltammograms remained unchanged, such as
the peak potentials and the dependence of I
p
on the scan
rate (Fig. 7 and insets).
These results can only be interpreted in terms of a
catalytic process. Figure 8 shows the variation in the
catalytic peak current intensity (corrected for the current
detected in the absence of substrate) vs. the acetaldehyde
concentration, as measured at the gold electrode. The curve
was adjusted to the Michaelis–Menten enzyme kinetics
description (Eqn 4), using the CERN library Fortran
program
MINUIT
algorithm:
I
cat
¼
C
ald
 I
max
C
ald
þ K
m
ð4Þ
where C
ald
is the aldehyde concentration, I
max
the catalytic
current observed at the maximum turnover rate, and K
m
the
Michaelis constant. The fitting shows the experimental data
to be in good agreement with Eqn (4), yielding a K
m
of
118 ± 10 l
M
for acetaldehyde. The corresponding value
for benzaldehyde was 15 ± 3 l
M
. The presence of increas-
ing amounts of benzoic acid, benzyl alcohol, acetic acid
or ethanol in the electrolyte solution had no effect on
the voltammetric signal.
These observations are intriguing and deserve further
study. In general, the AOR activity is measured using
aldehydes as electron donors and a dye (DCPIP) as electron
acceptor [19]. The present data indicate a new catalytic
activity of the enzyme, reducing aldehyde probably to
alcohol. We have detected the formation of ethanol from
acetaldehyde using NMR and GC (our unpublished data
[47]). A detailed study of the reaction of the enzyme with
substrates is underway.
Conclusions
In this work we report the direct electrochemistry of
DgAOR. As the electron-transfer reaction between a
protein and an electrode is mainly a recognition process,
the assignment of the cofactors involved was possible from
a thorough analysis of the voltammetric responses and the
structural properties of the molecular surface of DgAOR.
Many factors can modulate the electrochemical behavior of
redox proteins, but electrostatic interactions are particularly
important in determining electron-transfer reactions of
these molecules [48].
It is important to stress the relevance of the different
orientations of the enzyme towards the electrode surfaces.
This is also apparent from the results shown here where
the behavior found for the reduction of DgAOR at two
different interfaces is related to the type of interaction
established. The results obtained at the gold electrode,
which were due to reduction of the molybdenum cofactor,
are relevant because they can be used to probe other
mechanisms such as those related to the enzymatic activity
of DgAOR. Indeed this is a clear demonstration that
Fig. 7. Cyclic voltammograms of 92 l
M
DgAOR at the gold electrode
in the presence of benzaldehyde: (a) 0, (b) 10, and (c) 91 l
M
. Scan rate
300 mVÆs
)1
. Supporting electrolyte: 0.10
M
KCl, 50 m
M
Tris/HCl
buffer (pH 7.6) and 2 m
M
neomycin sulfate. Insets: variation (A) in the
CV cathodic peak current with the scan rate and (B) in the CV cathodic
peak potential with the logarithm of scan rate. Benzaldehyde con-
centration: (e)0;(n)10;(h)91l
M
.
Fig. 8. Variation in the cathodic catalytic current of DgAOR with
acetaldehyde concentration detected at the gold electrode. The solid line
represents the fitting of the experimental data using Michaelis–Menten
kinetics, with K
m
¼ 118 l
M
and I
max
¼ 6 lA.
1336 M. M. Correia dos Santos et al.(Eur. J. Biochem. 271) Ó FEBS 2004
electrodes act as Ôredox partnersÕ, and the enzyme surface
(shape and charge) will determine the interaction with the
electrode.
The state of an enzyme on interaction with an electrode
surface is always a major concern. The observation of
catalytic currents suggests a competent enzyme. Also, the
electrochemical arguments put forward confirm that
the native structure of the enzyme is probably preserved in
the adsorbed state.
Acknowledgements
This work is part of the research project POCTI/QUI/42277/2002.
P. M. P. S. thanks the FCT for financial support.
References
1. Armstrong, F.A. & Wilson, G.S. (2000) Recent developments in
faradaic bioelectrochemistry. Electrochim. Acta 45, 2623–2645.
2. Davis, J.J., Hill, H.A.O. & Bond, A.M. (2000) The application of
electrochemical scanning probe microscopy to the interpretation
of metalloprotein voltammetry. Coord. Chem. Rev. 200–202,
411–442.
3. Hill, H.A.O. & Hunt, N.I. (1993) Direct and indirect electro-
chemical investigations of metalloenzymes. Methods Enzymol.
227, 501–522.
4. Hill, H.A.O. (1996) The development of bioelectrochemistry.
Coord. Chem. Rev. 151, 115–123.
5. Armstrong, F.A., Cox, P.A., Hill, H.A.O., Lowe, V.J. & Oliver,
B.N. (1987) Metal ions and complexes as modulators of protein-
interfacial electron transport at graphite electrodes. J. Electroanal.
Chem. 217, 331–366.
6. Harmer, M.A. & Hill, H.A.O. (1985) The direct electrochemistry
of redox proteins at metal oxide electrodes. J. Electroanal. Chem.
189, 229–246.
7. Armstrong, F.A., Hill, H.A.O. & Oliver, B.N. (1984) Surface
selectivity in the direct electrochemistry of redox proteins: con-
trasting behavior at edge and basal planes of graphite. J. Chem.
Soc. Chem. Commun. 15, 976–977.
8. Armstrong, F.A., Hill, H.A.O., Oliver, B.N. & Walton, N.J.
(1984) Direct electrochemistry of redox proteins at pyrolytic gra-
phite electrodes. J. Am. Chem. Soc. 106, 921–923.
9. Armstrong, F.A. & Lannon, A.M. (1987) Fast interfacial electron
transfer between cytochrome c peroxidase and graphite electrodes
promoted by aminoglycosides: novel electroenzymic catalysis of
H
2
O
2
reduction. J. Am. Chem. Soc. 109, 7211–7212.
10. Datta, D., Hill, H.A.O. & Nakayama, H. (1992) Promotion of the
electrochemical response of some negatively charged proteins at
an edge-plane graphite electrode by various redox inert cations: an
electrochemical manifestation of Frumkin adsorption. J. Electro-
anal. Chem. 324, 307–323.
11. Allen, P.M., Hill, H.A.O. & Walton, N.J. (1984) Surface modifiers
for the promotion of direct electrochemistry of cytochrome c.
J. Electroanal. Chem. 178, 69–86.
12. Hill, H.A.O., Page, D.J., Walton, N.J. & Whitford, D. (1985)
Direct electrochemistry, at modified gold electrodes, of redox
proteins having negatively-charged binding domains: spinach
plastocyanin and a multi-substituted carboxydinitrophenyl deri-
vative of horse heart cytochrome c. J. Electroanal. Chem. 187,
315–324.
13. Armstrong, F.A., Heering, H.A. & Hirst, J. (1997) Reactions of
complex metalloproteins studied by protein-film voltammetry.
Chem.Soc.Rev.26, 169–179.
14. Moura, J.J.G., Xavier, A.V., Bruschi, M., LeGall, J., Hall, D.O. &
Cammack, R. (1976) Molybdenum-containing iron-sulfur protein
from Desulfovibrio gigas. Biochem. Biophys. Res. Commun. 72,
782–789.
15. Moura, J.J.G., Xavier, A.V., Cammack, R., Hall, D.O., Bruschi,
M. & LeGall, J. (1978) Oxidation-reduction studies of the
Mo-(2Fe-2S) protein from Desulfovibrio gigas. Biochem. J. 173,
419–425.
16. Roma
˜
o,M.J.,Archer,M.,Moura,I.,Moura,J.J.G.,LeGall,J.,
Engh, R., Schneider, M., Hof, P. & Huber, R. (1995) Crystal
structure of the xanthine oxidase-related aldehyde oxido-reductase
from D. gigas. Science 270, 1170–1176.
17. Rebelo, J.M., Dias, J.M., Huber, R., Moura, J.J.G. & Roma
˜
o,
M.J. (2001) Structure refinement of the aldehyde oxidureductase
from Desulfovibrio gigas (Mop) at 1.28 A
˚
. J. Biol. Inorg. Chem. 6,
791–800.
18. Caldeira, J., Belle, V., Asso, M., Guigliarelli, B., Moura, I.,
Moura, J.J.G. & Bertrand, P. (2000) Analysis of the electron
paramagnetic resonance properties of the [2Fe-2S]
1+
centers in
molybdenum enzymes of the xanthine oxidase family: assignment
of signals I and II. Biochemistry 39, 2700–2707.
19. Barata, B.A.S., LeGall, J. & Moura, J.J.G. (1993) Aldehyde
oxidoreductase activity in Desulfovibrio gigas: in vitro reconstitu-
tion of an electron-transfer chain from aldehydes to the produc-
tion of molecular hydrogen. Biochemistry 32, 11559–11568.
20. Roma
˜
o, M.J. & Moura, J.J.G. (2001) Aldehyde oxidoreductase
(MOP). In Handbook of Metalloproteins (Messerschmidt, A.,
Huber, R., Poulos, T. & Wieghardt, K., eds), pp. 1037–1047. John
Wiley and Sons, Chichester.
21. More, C., Belle, V., Asso, M., Fournel, A., Roger, G., Guigliarelli,
B. & Bertrand, P. (1999) EPR spectroscopy: a powerful technique
for the structural and functional investigation of metalloproteins.
Biospectroscopy 5, S3–S18 (Suppl. S).
22. Anderson, L.J., Richardson, D.J. & Butt, J.N. (2000) Using direct
electrochemistry to probe rate limiting events during nitrate
reductase turnover. Faraday Discussions 116, 155–169.
23. Anderson, L.J., Richardson, D.J. & Butt, J.N. (2001) Catalytic
protein film voltammetry from a respiratory nitrate reductase
provides evidence for complex electrochemical modulation of
enzyme activity. Biochemistry 40, 11294–11307.
24. Heffron, K., Leger, C., Rothery, R.A., Weiner, J.H. & Armstrong,
F.A. (2001) Determination of an optimal potential window for
catalysis by E. coli dimethyl sulfoxide reductase and hypothesis
on the role of Mo (V) in the reaction pathway. Biochemistry 40,
3117–3126.
25. Aguey-Zinsou, K F., Bernhardt, P.V., McEwan, A.G. & Ridge,
J.P. (2002) The first non-turnover voltammetric response from a
molybdenum enzyme: direct electrochemistry of dimethylsulfoxide
reductase from Rhodobacter capsulatus. J. Biol. Inorg. Chem. 7,
879–883.
26. Aguey-Zinsou, K F., Bernhardt, P.V., Kappler, U. & McEwan,
A.G. (2003) Direct electrochemistry of a bacterial sulfite dehy-
drogenase. J. Am. Chem. Soc. 125, 530–535.
27. Elliot, S.J., McElhaney, A.E., Feng, C., Enemark, J.H. & Arm-
strong, F.A. (2002) A voltammetric study of interdomain electron
transfer within sulfite oxidase. J. Am. Chem. Soc. 124, 11612–
11613.
28. Ferapontova, E.E., Ruzgas, T. & Gorton, L. (2003) Direct elec-
tron transfer of heme- and molybdopterin cofactor-containing
chicken liver sulfite oxidase on alkanethiol-modified gold electro-
des. Anal. Chem. 75, 4841–4850.
29. Rodrigues, C.G., Wedd, A.G. & Bond, A.M. (1991) Electro-
chemistry of xanthine oxidase at glassy carbon and mercury
electrodes. J. Electroanal. Chem. 312, 131–140.
30. Correia dos Santos, M.M., Paes de Sousa, P.M., Simo
˜
es
Gonc¸ alves, M.L., Lopes, H., Moura, I. & Moura, J.J.G. (1999)
Electrochemical studies on c-type cytochromes at microelectrodes.
J. Electroanal. Chem. 464, 76–84.
Ó FEBS 2004 Direct electrochemistry of DgAOR (Eur. J. Biochem. 271) 1337
31. Nicholls, A., Sharp, K. & Honig, B. (1991) Protein folding and
association: insights from the interfacial and thermodynamic
properties of hydrocarbons. Proteins 11, 281–296.
32. Laviron, E. (1974) Adsorption, autoinhibition and autocatalysis in
polarography and in linear potential sweep voltammetry. J. Elec-
troanal. Chem. 52, 355–393.
33. Bard, A.J. & Faulkner, L.R. (2001) Electrochemical Methods,
Fundamentals and Applications, 2nd edn. John Wiley and Sons,
New York.
34. Butt, J.N., Armstrong, F.A., Breton, J., George, S.J., Thomson,
A.J. & Hatchikian, E.C. (1991) Investigation of metal ion uptake
reactivities of [3Fe-4S] clusters in proteins: voltammetry of
co-adsorbed ferredoxin-aminocyclitol films at graphite electrodes
and spectroscopic identification of transformed clusters. J. Am.
Chem. Soc. 113, 6663–6670.
35. Armstrong, F.A., Camba, R., Heering, H.H., Hirst, J., Jenken,
L.J.C., Jones, A.K., Le
´
ger, C. & McEvoy, J.P. (2000) Fast vol-
tammetric studies of the kinetics and energetics of coupled
electron-transfer reactions in proteins. Faraday Discuss. 116,
191–203.
36. Lovric, M. & Branica, M. (1987) Square wave voltammetric peak
current enhancements by adsorption and reversibility of the redox
reaction. J. Electroanal. Chem. 226, 239–251.
37. Lovric, M. & Komorsky-Lovric, S. (1988) Square-wave voltam-
metry of an adsorbed reactant. J. Electroanal. Chem. 248,
239–253.
38. Parry, E.P. & Osteryoung, R.A. (1965) Evaluation of analytical
pulse polarography. Anal. Chem. 37, 1634–1637.
39. Buffle, J. (1988) Complexation Reactions in Aquatic Systems.
p. 361. Ellis Horwood/John Wiley and Sons, Chichester, UK.
40. Laviron, E. (1979) The use of linear potential sweep voltammetry
and of a.c. voltammetry for the study of the surface electro-
chemical reaction of strongly adsorbed systems and of redox
modified electrodes. J. Electroanal. Chem. 100, 263–270.
41. Wopschall, R.H. & Shain, I. (1967) Effects of adsorption of elec-
troactive species in stationary electrode polarography. Anal.
Chem. 39, 1514–1527.
42. Nicholson, R.S. & Shain, I. (1964) Theory of stationary electrode
polarography. Single scan and cyclic methods applied to rever-
sible, irreversible and kinetic systems. Anal. Chem. 36, 706–723.
43. Laviron, E. (1974) Surface linear potential sweep voltammetry.
Equation of the peaks for a reversible reaction when interactions
between the adsorbed molecules are taken into account. J. Elec-
troanal. Chem. 52, 395–402.
44. Polcyn, D.S. & Shain, I. (1966) Multistep charge transfers in sta-
tionary electrode polarography. Anal. Chem. 38, 370–375.
45. Armstrong, F.A., Butt. J.N. & Sucheta, A. (1993) Voltammetric
studies of redox-active centers in metallproteins adsorbed on
electrodes. Methods Enzymol. 227, 479–500.
46. Correia dos Santos, M.M., Paes de Sousa, P.M., Simo
˜
es
Gonc¸ alves. M.L., Ascenso, C., Moura, I. & Moura, J.J.G. (2001)
Electrochemical studies of rubredoxin from Desulfovibrio vulgaris
at modified electrodes,. J. Electroanal. Chem. 501, 173–179.
47. Andrade, S. (2001) Caracterizac¸a
˜o
Bioquı
´
mica e Espectrosco
´
pica
de Enzimas contendo Molibde
´
nio em Organismos redutores de
Sulfato. PhD Thesis, Universidade Nova de Lisboa, Lisbon.
48. Correia dos Santos, M.M., Paes de Sousa, P.M., Simo
˜
es Gonc¸ alves,
M.L., Krippahl, L., Moura, J.J.G., Lojou, E
´
. & Bianco, P. (2003)
Electrochemical studies on small electron transfer proteins using
membrane electrodes. J. Elecroanal. Chem. 541, 153–162.
1338 M. M. Correia dos Santos et al.(Eur. J. Biochem. 271) Ó FEBS 2004