THE IMPACT OF WORKING CAPITAL MANAGEMENT ON CONSTRUCTION FIRMS’ PROFITABILITY IN VIETNAM
Bạn đang xem bản rút gọn của tài liệu. Xem và tải ngay bản đầy đủ của tài liệu tại đây (312.55 KB, 34 trang )
JEAN MOULIN LYON 3 UNIVERSITY
VIETNAM UNIVERSITY OF COMMERCE
MASTERS FINANCE AND CONTROL
THESIS
THE IMPACT OF WORKING CAPITAL MANAGEMENT ON
CONSTRUCTION FIRMS’ PROFITABILITY IN VIETNAM
Prepared by: Nguyen Thi Ngoc Diep
Supervised by: Sophie Bachelard
Hanoi 2013
1
ABSTRACT
To start business, first of all we need finance and the success of that business initially
depends on management of short term finance is called working capital management. The
working capital management plays an important role for the firm’s success or failure
because it’s effect on firm’s performance and liquidity. The effective working capital
management is a fundamental part of the overall corporate strategy to create
shareholders’ value (Nazir and Afza,2008). A lot of financial managers in the world have
researched impact of working capital management on firms’ Profitability across countries
to find out how to use working capital effectively and maximize profit. With the same
topic, this research aims to supply empirical evidences to examine such influence for
Vietnamese Companies.
The study selected a sample of 11 audited construction companies listed in Vietnam
Stock Exchange for the period of three years(2010-2012) with total 132 observations.
Collected data was then analyzed on quantitative. The researcher estimated regressions
basis by using Pearson’s correlation and Linear regression analysis through SPSS 16.0
software. The results of Pearson’s an regression analysis found a significant
negative relationship between Receivables Collection Period, Inventory Conversion
Period, Average payment period, Cash Conversion Cycle and profitability.
This study can suggest the impact of working capital management on firm’s
performance and highlight how managers affect firm’s profitability by managing
working capital efficiently. The theoretical contribution of this study is to enrich the
existing literature by investigate the impact of working capital management on
construction firms’ profitability in Vietnam firms as a developing market.
2
TABLE OF CONTENT
ABSTRACT........................................................................................................................2
TABLE OF CONTENT....................................................................................................3
Chapter 1............................................................................................................................5
INTRODUCTION.............................................................................................................5
1.1 Overview of working capital management...........................................................................5
1.2 Problem Statement...............................................................................................................6
1.3 Research objective................................................................................................................6
1.4 Hypotheses of the study.......................................................................................................6
1.5 Research method adopted....................................................................................................7
1.6 Significance of the study.......................................................................................................7
1.7 Structure of the study...........................................................................................................7
Chapter 2............................................................................................................................8
LITERATURE REVIEW.................................................................................................8
2.1 Theoretical review................................................................................................................8
2.1.1 Working capital..............................................................................................................8
2.1.2 Working capital management .....................................................................................10
2.1.2.1 Cash management......................................................................................11
2.1.2.2 Receivable management............................................................................11
2.1.2.3 Inventory management...............................................................................12
2.1.3 Distinction between profit and profitability.................................................................13
2.2 Review of empirical studies................................................................................................13
Chapter 3..........................................................................................................................16
DATA AND METHODOLOGY....................................................................................16
3.1 Data collection....................................................................................................................16
3.2 Variables.............................................................................................................................16
3.3 Research Model..................................................................................................................17
3.4 Methodology.......................................................................................................................18
3.4.1 Descriptive statistics....................................................................................................18
3.4.2 Correlation analysis......................................................................................................19
3.4.3 Regression analysis......................................................................................................19
3
Chapter 4..........................................................................................................................20
RESULTS AND ANALYSIS..........................................................................................20
4.1 Results for summary of descriptive statistic.......................................................................20
4.2. Test results for CLRM assumption......................................................................................21
4.2.1 Test results for multicollinearity ..................................................................................21
4.2.2 Test result for significance of the model......................................................................22
4.2.3 Results for Pearson’s correlation coefficient................................................................23
4.2.4 Results for multiple regression.....................................................................................25
4.2.4.1 Result of regressing average receivable period as an independent
variable : ................................................................................................................26
4.2.4.2 Result of regressing inventory turnover as an independent variable : .....27
4.2.4.3 Result of regressing average payment period as an independent variable :
................................................................................................................................28
4.2.4.4 Result of regressing Cash conversion cycle as an independent variable : 29
4.2.4.5 Hypotheses testing.....................................................................................31
CHAPTER 5.....................................................................................................................32
CONSCLUSIONS AND RECOMMENDATIONS......................................................32
5.1 Conclusions.........................................................................................................................32
5.2 Recommendations..............................................................................................................32
5.3 Research limitation and future research directions............................................................33
REFERENCES................................................................................................................34
4
Chapter 1
INTRODUCTION
This chapter provides background information on the thesis topic. The purpose of this
chapter to provide readers with an overview on the research. The chapter consists of
seven sections:
Section 1.1 presents an overview of working capital management as a background of the
research.
Section 1.2 indicates statements of the problems
Section 1.3 identifies research objective
Section 1.4 presents hypotheses of the study
Section 1.5 discuss about research method adopted
Section 1.6 shows significance of the study
Section 1.7 draws an outline of the study
1.1 Overview of working capital management
Working capital is a critical component in the functioning of any business .After the
initial investment of setting up the factory and installing plant & machinery, the
company additionally requires funds to keep its machines working and churning out
goods. Essentially the company must have funds to buy raw material, to pay wages to
workers and to bear other operating expenses required for daily production. After
operating funds are spent and goods are produced, there is a time-lag before actual sales
are realized. Even after a sales transaction is concluded, it does not immediately bring in
cash for the company as a credit period is often extended to the buyer. In a nutshell, a
company needs working capital to continuously produce sufficient goods as the actual
cash realization of sale proceeds takes place much later after a sale is made. In simple
word, working capital is that how much in liquid assets that a company has on hand.
Therefore, working capital management means to take decision for bringing working
capital at optimum level. Only doing this, working capital management can control
working capital efficiently.
Working capital management is a very important part of corporate finance because it
directly affects companies’ liquidity and profitability (Deloof, 2003). Therefore,
efficient management of working capital is a fundamental part of the overall corporate
strategy to create shareholder value. In general, companies try to keep an optimal
level of working capital that maximizes their value (Deloof, 2003; Afza & Nazir,
2009). However, preserving liquidity of the firm is an important objective as well. The
problem is that increasing profits at the cost of liquidity can bring serious problems to
the firm. Therefore, there must be a tradeoff between these two objectives( liquidity and
profitability). One objective should not be at the cost of the other because both have their
own importance. If firms do not care about profit, they can not survive for a long time. If
firms do not care abut liquidity they may face the problem of insolvency or bankruptcy.
For these reasons managers should give proper consideration for working capital
management as it does ultimately affect the profitability of firms. Indeed firms may have
5
an optimal.
In general, working capital management is not only improving financial performance in
today’s cash-strapped and uncertain economy, but it is the question of meeting firm’s
day to day operation. Therefore, it may have both negative and positive impact on firms,
profitability which in turn, the shareholders’ wealth has been negative and positive
impact. Therefore, it is a critical issue to know and understand the impacts of working
capital management and its influence on firms’ profitability.
1.2 Problem Statement
Working capital management plays an important role in any companies because without
working capital management, firms’ operation will not run smoothly. Working capital
management have a significant impact upon both the liquidity and profitability (Shin and
Soenen, 1998; Dong and Su, 2010). Therefore, the crucial part of managing working
capital is maintaining the required liquidity in day – to day operation to ensure firms
running and to meet its obligation (Eljelly,2004). As a result, in order to explain the
relationship between working capital management and profitability, many researchers
have been carried out in different countries, however, this issue is not attracted to
researchers in Vietnam. Besides, the researcher find a little studies carried out by
searching on internet, books and journals. Therefore, their researcher believed that the
problem is almost untouched and there is a knowledge gap on the area. In its effect most
Vietnam company managers thought regarding working capital management is to
shorten the cash conversion cycle to increase firms’ profitability. However, if firms have
higher level of account receivable due the generous trade credit policy, it would result to
longer cash conversion cycle. In this case, the longer cash conversion cycle will increase
profitability and thus, the traditional view of managers can not be applied to all
circumstances. Hence, lack of proper research study on the area gives a chance for the
Vietnam companies’ managers to have limited awareness in relation working capital
management with increasing firms’ profitability. Therefore, the study try to find out the
impact of working capital management on firms’ profitability.
1.3 Research objective
This research aims to examine whether working capital management can impact on
construction firms’ profitability in Vietnam and if so, whether it is positive or negative
influence. It provides insights to Vietnam Companies about influence of working capital
management on firms’ profitability.
1.4 Hypotheses of the study
The aim of this study is to understand the impact of working capital management on
companies’ operating profitability, the following hypotheses that this study try to test:
HP1: There is positive relationship between efficient working capital management and
firms’ profitability
HP2: There is a negative relationship between cash conversion cycle and firms’
profitability.
HP3: There is a negative relationship between liquidity and firms’ profitability
HP4: There is a positive relationship between firm size and firms’ profitability
6
HP5: There is a negative relationship between debt and firms’ profitability.
1.5 Research method adopted
In this study, a quantitative method is adopted to achieve the main research objective.
Data were collected that help the researcher examine the influence of working capital
management on firms’ profitability in audited financial statements and analysis
statements. Acceptable data would be entry data of process was analyzed by using the
SPSS 16.0 software program. Analysis data was implemented to show important
relationships of variables in the study.
1.6 Significance of the study
There are a lot of researchers studied this topic in other countries by using panel data
through multiple regressions to show the impacts of working capital components on
firms’ profitability. However, as I know, very little research has been done in Vietnam.
This limited evidence in the context of Vietnam along with the importance of working
capital management calls for research on their impact on firms’ profitability. In light of
the above points, the general objective of the study will be to examine the impact of
working capital management on the profitability of construction firms in Vietnam.
Similarly, it benefits the managers and policy makers of those selected companies
regarding decision on optimum level of working capital, ways of managing it and overall
policies on working capital management. Through this study gives clear understanding
about the relation between working capital components and corporate profitability.
Besides, the study helps as a guideline for those who conducts their study on similar topic
and it gives brief information for the shareholders, prospective customers and creditors of
firms regarding profitability in relation to efficient working capital management and
policy. Finally, the study benefits the researcher to obtain new knowledge about the
problem and give clear picture about the discipline called research.
1.7 Structure of the study
The thesis is organized as follows:
The first chapter is introduction,. This chapter provides background information on the
thesis topic.
The second chapter is literature review. This chapter provides overview on working
capital, working capital management, distinction between profit and profitability of
company and the impact of working capital management on the company profitability.
The third chapter is data and methodology. This chapter discusses the data collection,
chosen variables and method used to describe and analyze data.
The fourth chapter is result and analyzing. This chapter provides empirical results .
The fifth chapter is conclusions and recommendation. This chapter consists of summary
and conclusions for finding, limitations, recommendations for future research.
7
Chapter 2
LITERATURE REVIEW
The purpose of this chapter is to review the evidence on working capital management and
profitability measures of a firm. This chapter is arranged into three sections. The first
section
Presents the theoretical review of working capital management, the second section
reviews the empirical evidence and the third section present conclusions on the literature
review and identifies the knowledge gap that this study attempts to fill in.
2.1 Theoretical review
2.1.1 Working capital
The term working capital is used for the capital required for day-to-day business
activities such as purchasing raw material, expenditure on salaries, wages, rents rates,
administration, advertising. Working capital refers to funds which are used during an
accounting period to generate a current income of a type which is consistent with major
purpose of a firm existence.
Working capital is an excess of current assets over current liabilities. In other words, The
amount of current assets which is more than current liabilities is known as working
capital. If current liabilities are nil then, working capital will equal to current assets.
Working capital shows strength of business in short period of time . If a company have
some amount in the form of working capital , it means company have liquid assets, with
this money company can face every crises position in market.
To understand working capital it is better to have basic knowledge about various aspect
of working capital as table following:
8
To start with, there are two concepts of working capital know as: Gross working capital
and Net working capital.
Gross Working Capital
In this concept of working capital, we study gross working capital. It presents total value
of current assets. In other words, it is the sum of total of net working capital and current
liabilities. It is a quantities concept showing the total amount available for financing the
current assets. It cannot reveal the true position of the company.
Net Working Capital
It presents excess of current assets over current liabilities. Current assets include cash,
debtors, stocks and bills receivable. Current liabilities include bills payable, accounts
payable, expenses payable. It indicates the liquidity position of an enterprise i.e. the
soundness or otherwise of the current financial position. This can be presented as:
Net working capital = Current assets – Current Liabilities
9
In this equation net working capital may be positive or negative. A positive net working
capital when current assets exceed current liabilities and A negative net working capital
arises when current liabilities exceed current assets.
Gross working capital indicates firm’s investment and financing of current assets. Net
working capital, on the other hand, shows the liquidity of a firm. As the result, net
working capital indicates the financing needs of a firm, both through long-term and shortterm financing sources.
Working capital is the part of firm’s capital that is used for routine day-to-day business
operations. In other words, working capital refers to the funds needed by the business to
run its operations for one accounting year. Working capital reflects the amount of money
a firm has at its immediate disposal. For more information about working capital refer to
tutorial liquidity and working capital analysis.
Adequate working capital is important for any business operations. Working capital
financing, however, can be a challenge for a business, especially for a small firm. In
order to understand the best way to finance working capital, it is important to understand
the difference between the two types of working capital: Permanent working capital and
Temporary working capital
Permanent working capital is the minimum level of current assets required by a firm to
carry-on its business operations. Permanent working capital is also called fixed working
capital. Permanent working capital does not depend on the level of production or sales. It
is similar – in some sense – to fixed assets because of its permanent (fixed) nature.
Important to note, however, that permanent working capital is not literally fixed: its level
can change over time. The level of permanent working capital depends on the business
cycle as well as the growth of a firm.
Temporary working capital is the excess of working capital over the permanent working
capital. Temporary working capital differs from permanent working capital because of its
cyclicality. As the result, temporary working capital usually requires a different source of
financing than permanent working capital. While permanent working capital is usually
financed through a long-term financing source such as equity capital and debt, temporary
working capital is often financed by short-term funds.
2.1.2 Working capital management
Working capital represents the operating liquidity available to a business firm. A
company can be endowed with assets and profitability but short of liquidity if its assets
cannot readily be converted into cash. Positive working capital is required to ensure that a
firm is able to continue its operations and that it has sufficient funds to satisfy both
maturing short-term debt and upcoming operational expenses. The management of
working capital involves managing inventories, accounts receivable and payable and
cash. Inadequate working capital can put a company in jeopardy rather quickly due to
liquidity problems. On the other hand, excessive working capital strains the company
finances. When there is deficiency of working capital – remedies are a. Raise Equity b.
Sell out Non-current Assets Having Too Much working capital is Bad – This is due to
rise in inventories and trade debtors – Problems with Excessive inventories : 1.
Obsolescence risk. viz., physical deterioration, technical or market obsolescence. 2.
10
Inventories drain cash. Liquid cash is tied up until the products are sold and the money
collected from customers. 3. Inventories require storage facilities. This takes up valuable
space and may cost a business in terms of rental expense or opportunity cost in terms of
facilities tied up. Trade Debtors - Trade debtors represent financing by the company to its
customers. When trade debtors build up, it may also be an indication of poor credit policy
and poor follow up on outstanding debts. The more efficient a business can manage its
inventories and trade debtors, the better it is for liquidity. More cash would then be
available for growing the business, reducing finance costs and paying shareholders. For
effective working capital management to pay attention on things is very important. They
are: Cash management, inventory management , Account payable management and
Account receivable management.
2.1.2.1 Cash management
Cash is money that is easily accessible either in the bank or in the business. It is not
inventory, it is not accounts receivable, and it is not property. These might be converted
to cash at some point in time, but it takes cash on hand or in the bank to pay suppliers, to
pay the rent, and to meet the payroll. Profit growth does not always mean more cash.
A company usually acquires inventory on credit, which results in accounts payable. A
company can also sell products on credit, which results in accounts receivable. Cash,
therefore, is not involved until the company pays the accounts payable and collects
accounts receivable. So the cash conversion cycle measures the time between outlay of
cash and cash recovery.
The formula used to calculate cash conversion cycle is represented as follows:
CCC = Average collection period + Inventory turnover in day – Average payment
period
This cycle is extremely important for retailers and similar businesses. This measure
illustrates how quickly a company can convert its products into cash through sales. The
shorter the cycle, the less time capital is tied up in the business process, and thus the
better for the company's bottom line.
2.1.2.2 Receivable management
Businesses have products or services to sell to their customer, in order to maximize
their sales, They use different policies to attract customers and one of them is
offering a trade credit. Trade credit refers to a situation where a company sells its
products and now to receive the payment at a specified date in the future. Trade
credit creates accounts receivable and it is also have opportunity cost associated
with them, because firms can not invest this money elsewhere until and unless it
collects its receivables. More receivables can raise profit by increasing sales but
firms may receive risks such as bad debts. Therefore, Receivable management aims
to maximize the value of the firm by achieving a tradeoff between risk and
profitability. For this purpose, the finance have to control the cost of receivables,
cost of collection, administrative expenses, bad debt and so on.
Companies can control how well accounts receivable are managed using aging schedules
and financial ratio. Whereas, financial ratio can be used to get an overall picture of
how fast credit manager collect accounts receivable.
11
It is the length of time it takes to clear all accounts receivable, or how long it takes to
receive the money for goods it sells. This is useful for determining how efficient the
company is at receiving whatever short-term payments it is owed.
The for average collection period is:
Average collection period= (Accounts Receivable)/(Net sales/365)
This ratio measures the quality of debtors. A short collection period implies promotion
payment by debtors. It reduces the chances of bad debts. Vice verse, a longer collection
period implies too liberal and inefficient credit collection performance.
2.1.2.3 Inventory management
Inventory is an important component of current assets. It consists of raw material, workin-process and finished goods available for sales.
The overseeing and controlling of the ordering, storage and use of components that a
company will use in the production of the items it will sell as well as the overseeing and
controlling of quantities of finished products for sale. A business's inventory is one of its
major assets and represents an investment that is tied up until the item is sold or used in
the production of an item that is sold. It also costs money to store, track and insure
inventory. Inventories that are mismanaged can create significant financial problems for a
business, whether the mismanagement results in an inventory glut or an inventory
shortage.
Successful inventory management involves creating a purchasing plan that will ensure
that items are available when they are needed (but that neither too much nor too little is
purchased) and keeping track of existing inventory and its use. Two common inventorymanagement strategies are the just-in-time method, where companies plan to receive
items as they are needed rather than maintaining high inventory levels, and materials
requirement planning, which schedules material deliveries based on sales forecasts.
Company can control its inventory by looking its financial ratios likes that of
management receivables. Inventory turnover ratio in days indicates the number of time
the stock has been turned over sales during the period and evaluates the efficiency with
which a firm is able to manage its inventory. It is calculated:
Inventory turnover in day = Inventory/(cost of sales/365)
2.1.2.4 Payable management
Payable management is the administration of a company's outstanding debts, or
liabilities, to vendors for purchases of goods and services made on credit.
Managing accounts payable is a crucial part of the cash flow cycle. Cash goes out of a
business in 5 broad areas: Operating costs, Capital expenditure, Loan repayments, Tax,
Profits and dividends. Account payable are a part of all business and have some
advantages associated with it. For example: It is available to all companies regardless of
the size of the company and earlier payment can bring cash discount with it. Companies
not only need to manage their account payables in good way but they should have the
ability to generate enough cash to pay the mature account payables. It leads to the
negative signal to the market and it will affected the share price, relationship with
12
creditors and suppliers. Thus, the company is difficult to raise more funds by borrowing
money or get more from their supplies. Therefore, Payable management is very
important. There is one way of controlling accounts payables is the average payment
period. Average payment period means the average period taken by the company in
making payments to its creditors. It is computed by dividing the number of working days
in a year by creditors turnover ratio. Formula for its computation is given below:
Average Payment Period = Account Payables/(Cost of good sold*365)
2.1.3 Distinction between profit and profitability
Profit is an actual amount of business owners that is made from an investment, sale or
manufacturing. Profit is a valuable return which measured for given period such as a
financial quarterly or a financial year. Profit is calculated by revenues obtained form
business activities minus the expenses used to achieve those revenues.
Profit = Revenues – Expenses
There are some important profit measures in common use as below: Gross profit,
Operating profit, Earning before interest and taxes, Net profit. While profitability
measures how well a company is making use of it's capital by investing in resources that
make goods and services that generate profits. Profitability is usually measured as a ratio
explaining the rate of some profit amount against assets, investment or equity of
company such as: Return on Assets (ROA), Return on investment (ROI), Return on
Equity(ROE). Percentage (%) is used as the unit measure of those ratios.
Profitability = Profit/ base measurement
2.2 Review of empirical studies
The previous section was presented the overviews of working capital management, in this
section the researchers reviews the empirical studies on the impact of working capital
management on firms’ profitability. There are a lot of studies on this topic in many
countries such as:
Shin and Soenen(1988) investigated American Companies during the period between
1975 and 1994 with total of 59 985 observations. The research found evidence of a
negative relation between profitability and cash conversion cycle.
Deloof(2003) used a sample of 1,009 large Belgian non-financial companies during the
period 1992-1996, he found a significant negative relationship between gross
operating income and the number of days of accounts receivable, inventories and
accounts payable of Belgian companies. The result suggest that managers can create
value for their shareholders by reducing the number of days accounts receivable and
inventories to reasonable minimum. The negative relation between accounts payable and
profitability is consistent with the view that less profitable firms wait longer to pay their
bills.
Afza and Nazir(2009) carried out survey the relationship between working capital
management and firms’ profitability for a sample of 204 non – financial companies listed
on Karachi Stock Exchange for the period 1998- 2005. The study found significant
different among their working capital requirements and financing policies through
different industries. Moreover, they suggested that managers could increase value if they
13
adopt a conservative approach toward working capital investment and working capital
financing policies.
Mohammadi (2009) in their study investigated the impact of working capital
management on profitability of listed companies in Tehran stock exchange between
the years 1996-2005 in 92 companies as the sample. Research results suggest that
there is a significant inverse relationship between the profitability of the companies
and cash conversion cycle and its components (inventory turnover period,
receivables collection period and creditors' settlement period). It also states that
companies that are profitable, have shorter term creditors' settlement period.
Gill et al. (2010) in their study Surveyed the relationship between working capital
management and profitability for the 88 U.S. companies listed on the New York
Stock Exchange during the years 2005 to 2007. The results suggest that statistically
there is a significant relationship between the cash conversion cycle (evaluation
criterion of working capital management) and gross operating profit (a measure
of profitability in companies), and management can also make profits for companies
by using from the cash conversion cycle and the maintenance of accounts receivable
in appropriate level.
Rezazadeh and Heydarian (2010) in their study examined the impact of working capital
management on profitability of Iranian companies. In this study, they investigated the
1365 year-company of observed number among the companies listed in Tehran Stock
Exchange during the years 1998-2007. The research results show that there is a
significant relationship between the profitability of companies with receivables
collection period and maintenance of inventories; also, the results suggest that
management can make value for the company by reducing inventory levels and days of
receivables collection period. So, by shorting the cash conversion cycle can be
improved profitability of company.
Izadinia and Taki (2010) in their study investigated the impact of working capital
management on profitability potential companies listed in Tehran Stock Exchange
during the period 2001-2008. In this study, the dependent variable, return on total
assets considered as a criterion of measure for profitability potential. The results
showed that there is a significant negative relationship between the cash conversion
cycle with return on assets. Also, they expressed that high investment in inventory and
accounts receivable will lead to lower profitability of companies.
Dong and Su (2010) in a study that performed in direction with the Gill, Biger
and Mathurs’ study (2010) investigated 130 companies in Vietnam during 2006 and
2008. Research results that were performed based on Pearson correlation and multiple
regression analysis indicates that there is a significant inverse relationship between the
cash conversion cycle and its components with profitability of companies.
Chawla et al. (2010) in their study investigated the relationship between working
capital management and liquidity of companies with profitability of companies. In
this study, three companies of the petrochemical industry in India between 2004 and
2009 were investigated. Research results that were performed based on Pearson
correlation and linear regression analysis, indicates that there is a significant inverse
relationship between the cash conversion cycle and its components including
14
inventory turnover period, receivables collection period and creditors' settlement
period with company's profitability that indicated by increasing the cash conversion
cycle, profitability of company are reduced and management can make a positive
value for the shareholders by reducing the cash conversion cycle at the lowest possible
level. Also the research results showed that statistically there is a significant inverse
relationship between liquidity and profitability of companies.
Mobeen Alam et al. (2011) in a study that performed in direction with the Binti
Mohammad and Binti mohd sads' study (2010), examined 65 companies in Pakistan
between 2005 and 2009. in this study they used from cash conversion cycle, current
assets to current liabilities ratio (current ratio), current assets to total assets ratio,
current liabilities to total assets ratio and total debts to total assets ratio as working
capital management criteria, Tobin Q ratio as a criterion of market value, and return on
assets ratio and return on invested capital ratio as a criterion of company's profitability.
The evidence showed that there is significant correlation between the components of
working capital with market value and profitability of the company and concluded that
Pakistani companies correlated heavily on current assets to maximize profits. And
be approved the result of Binti Mohammad and Binti mohd saads' study (2010).
All the literature review shows that they are mixed research and indicates working
capital management has impact on profitability of firms.
15
Chapter 3
DATA AND METHODOLOGY
This chapter describes techniques used for collecting data and choosing variables. The
chapter is organized as follows:
Section 3.1 present data collection.
Section 3. 2 shows the variables chosen
Section 3.3 presents models used in this study
3.1 Data collection
The data set in this research was obtained from the Stock Exchange of Vietnam. The
selected companies belong to construction sector. Some companies with missing data
were also removed from the sample. The sample consisted of 11 firms that had all the
needed data for the three-year period from 2010 through 2012. Therefore, data obtained
from this study were panel data on 132 firms’ observations.
3.2 Variables
In order to analyze the influence of working capital management on firms’ profitability, I
used independent variables, dependent variables and control variables.
Independent Variable:
- First independent variable, Average collection period (ARD) is used as a proxy for the
collection policy of firms.
- Second independent variable, inventory turnover in days
measure for the inventory policy of firms.
(ITD) is used as a
- Third independent variable, average payment period(APP) is used as proxy for the
payment policy of firms
- T he last independent variable is cash conversion cycle (CCC) which is used as
a comprehensive measure of working capital management.
Control Variable:
- Current ratio (CR) is used as a traditional measure of firm’s liquidity.
- Size were calculated as Natural logarithm of Total assets.
- Debt ratio (DR) is also used as a proxy for leverage and is computed by dividing total
debt by total assets.
- ε is used as error term.
Dependent Variable: Return on asset (ROA)
To examine the relationship between working capital management and corporation’s
profitability, the ratio of Return on Assets (ROA), which calculate as the net income
divided by total assets, was used as the dependent variable. Several recent studies have
used ROA as a proxy for firms profitability such as Nazir & Afza, 2009.
16
This ratio explains that how efficient a company is to utilize its available assets to
generate profit. It calculates the percentage of profit a company is earning against per
dollar of assets. The higher value of ROA shows the better performance and it can be
computed as follows:
ROA = (Earning Available/ Total assets)*100
The table below summarizes all the variables that were used in this, along with
their abbreviations and formulas:
Table 3.2 Measurements of variables
Variables
How to Measure
Average Collection
Period
Account Receivable/Net Sales *365
Inventory Turnover (in
Days)
Abbreviation
Types of
Variables
Inventory/ Cost of Goods Sold * 365
Cash Conversion
Cycle
ARD + ITD – APP
Currents Assets/ Current Liabilities
Current Ratio
CR
Debt Ratio
Total debt/Total assets
Firm size
The natural logarithm of total assets
Return on Assets
Net Income / Total Assets
DR
SIZE
ROA
Control
Control
Dependent
3.3 Research Model
The impact of working capital management upon corporate profitability was tested by
panel data methodology. The panel data methodology used has certain benefits like
using the assumption that companies are heterogeneous, more variability, less
collinearity between variables, more informative data, greater degree of freedom and
more efficiency (Baltagi, 2001). In panel data regression, several cross-sectional units
are observed over a period of time. This method is more useful in studying the
dynamics of adjustment, and is better able to identify and measure effects that are
simply not detectable in pure cross-sections or pure time-series data (Raheman & Nasr,
2007).
17
Consistent with previous studies, the impact of working capital management upon
corporate profitability was modeled using the following regression equations:
Model 1: used for regressing average receivable in days as
independent variable
ROA =β0 + β1 (ARD) + β2 (CR) + β3 (DR) + β4(Size) + ε
Model 2 used for regressing inventory turnover as
an independent variable
ROA =β0 + β1 (ITD ) + β2 (CR) + β3 (DR) + β4(Size) + ε
Model 3 used for regressing average payment period
as an independent variable
ROA =β0 + β1 (APP ) + β2 (CR) + β3 (DR) + β4(Size) + ε
Model 4 used for regressing cash conversion cycle as an
independent variable
ROA =β0 + β1 (CCC) + β2 (CR) + β3 (DR) + β4(Size) + ε
3.4 Methodology
As the same most previous researches, the researcher used quantitative research method
approaches. The SPSS 16.0 software was used to carry out the analysis. The main
techniques and analyses were applied:
Firstly, the researcher used descriptive statistics to describe the sample collected. This
statistics technique provides an overview of samples’ characteristics before conducting
main analyses.
Secondly, Pearson Correlation analysis are used to study the relationship between
variables.
Thirdly, The researcher analyzed detail the impact of working capital management on
companies’ profitability by using Linear regression for panel data 11 companies with 132
observations.
Finally, the results of before techniques shall be base to answer the hypotheses.
3.4.1 Descriptive statistics
Descriptive statistics are used to describe the basic features of the data in a study. They
provide simple summaries about the sample and the measures. Together with simple
graphics analysis, they form the basis of virtually every quantitative analysis of data.
Descriptive statistics help us to simply large amounts of data in a sensible way. Each
descriptive statistic reduces lots of data into a simpler summary.
These statistics are necessary and useful for all normative and cause-effect statistics
techniques including hypothesis testing, correlation and regression analysis.
In this study, the researcher choose mean and median to measure the central tendency
whereas choosing standard deviation to measure dispersion of the study sample.
18
Measures of central tendency indicate the middle and commonly occurring points in a
data set, in which mean the average value of a data set whereas median is middle value
standing in this data set. Dispersion measures indicate how spread out the data is around
the mean in which standard deviation is the average difference between observed values
and the mean.(Texas State Auditors’ Office)
3.4.2 Correlation analysis
Correlation between variables is a measure of how well the variables are related. The
most common measure of correlation in statistics is the Pearson Correlation (technically
called the Pearson Product Moment Correlation or PPMC), which shows the linear
relationship between two variables. There are a lot of previous researches chosen Pearson
Correlation analysis( Deloof, 2003; Huynh & Su. 2010). However, Correlation analysis
can not identify a cause – and – effect relationship. Moreover, testing simple bivariate
correlation in conventional matrix does not take into account each variable’s correlation
with all other explanatory variables (Padachi, 2006).
3.4.3 Regression analysis
To examine the influence of working capital management on company profitability,
researchers have used different regression analysis with different models. In this study,
the researcher analyzed linear regression with three models by using SPSS 16.0
software.
Linear regression is the next step up after correlation. It is used when we want to predict
the value of a variable based on the value of another variable. The variable the researcher
want to predict is called the dependent variable (or sometimes, the outcome variable).
The variable we are using to predict the other variable's value is called the independent
variable (or sometimes, the predictor variable).
19
Chapter 4
RESULTS AND ANALYSIS
This chapter present the results and analysis finding on the impact of working capital
management on firms’ profitability. The results obtained under different methods and
techniques are analyzed in the subsequent chapter to address each research hypotheses.
4.1 Results for summary of descriptive statistic
The primary data sources of this study are collected of financial analysis of financial
statements in 11 constructions companies in Vietnam.
The descriptive statistics are presented for total 132 observations of constructions share
companies in Vietnam for period of three years from 2010 to 2012. For both dependent
and independent variables value of minimum, maximum, mean and standard deviation
are presented on table 4.1
Table 4.1 Descriptive Statistics of Sample companies
Descriptive Statistics
N
ROA
CR
DR
ARD
ITD
APP
CCC
SIZE
Valid N (listwise)
Minimum
132 -2.05000E1
Maximum
16.08000
132
.79000
4.45000
132
.36000
.98000
132
29.20000
7.03380E2
132
1.00000
9.29680E2
132
21.10000
6.61840E2
132
19.10000
1.77007E3
132
25.19232
29.52280
Mean
Std. Deviation
2.2782576
E0
1.4850758
E0
.7047727
1.8220970
E2
2.1410583
E2
1.1323371
E2
3.4708379
E2
2.6949836
E1
4.28862502
.67388301
.12868961
1.31809748E2
1.58887806E2
98.32096097
3.08846614E2
.88287439
132
Source: SPSS output from financial statements of sample companies, 2010-2012
The mean value of net Return on Assets is 2.28 percent of total assets. And standard
deviation is 4.28 percent. The maximum value for return on assets is 16.08 percent while
the minimum is -20.5 percent.
20
The cash conversion cycle used as proxy to check the efficiency in managing working
capital in on average 3.5 days and standard deviation is 3 days. The minimum time taken
by a company convert its firms activity is 19 days and the maximum time taken by the
firm is 1770 days.
Firms receive payments against sales an average of 182 days and standard deviation is
132 days. Minimum time taken to collect cash from receivables is 29 days while the
maximum time taken is 703 days.
It takes an average 214 days to sell inventory with standard deviation of 159 days. Here,
maximum time taken by a company is 930 days which is a very lager time period to
convert inventory sales and the minimum time taken is 1 day.
Firm wait an average 113 days to pay their purchases with standard deviation of 98 days.
Here minimum time taken by a company is 14 days and maximum time taken for this
purpose is 662 days
A traditional measure of liquidity is current ratio. The average current ratio for
Vietnamese firms is 1.48 with a standard deviation of 0.67. The highest current ratio for a
company is 4.45 and the minimum ratio is 0.79.
To check the debt financing and its relationship with the profitability the debt ratio. The
results of descriptive statistics show that the average debt ratio is 0.74 with standard
deviation of 0.12. The maximum debt financing used by a company is 0.98 is rather high
ratio while the minimum level of debt ratio is 0.36
Finally, to check the size of firm and its relationship with profitability, natural logarithm
of sales is used as a control variable. The mean value of log sales is 27 with standard
deviation of 0.88. The maximum and minimum value of log of sales for company in a
year is 30 and 15.
4.2. Test results for CLRM assumption
4.2.1 Test results for multicollinearity
By using Partial pair wise correlation to examine multicollinearity table 4.2, the result
show that:
The pair wise correlations between variables are lays between +/-1. Hence, in terms of
partial pair wise correlation between variables majority of correlation are on between
-0.235 and 0.998. Likewise, the minimum correlation of -0.235 is between debt ratio and
current ratio while the maximum correlation of 0.78 is between average payment period
and cash conversion cycle. It is not a serious problem when compared to standard more
than 80 percent coefficient(Gujarati, 2004)
21
Table 4.2 Partial pair wise correlation between variables
Correlations
Control Variables
ROA CR
Correlation
CR
DR
ITD
CCC
SIZE
APP
1.000
Significance (2-tailed)
.
df
DR
ARD
0
Correlation
-.235
1.000
Significance (2-tailed)
.007
.
df
129
0
-.152
-.118
1.000
Significance (2-tailed)
.084
.180
.
df
129
129
0
Correlation
.117
.121
.064
1.000
Significance (2-tailed)
.183
.167
.468
.
df
129
129
129
0
.074
.000
.756
.253
1.000
Significance (2-tailed)
.398
.998
.000
.004
.
df
129
129
129
129
0
-.099
.096
.587
.128
.659
1.000
Significance (2-tailed)
.258
.276
.000
.146
.000
.
df
129
129
129
129
129
0
-.206
.159
.741
.050
.781
.580
1.000
Significance (2-tailed)
.018
.069
.000
.572
.000
.000
.
df
129
129
129
129
129
129
0
ARD Correlation
ITD
CCC Correlation
SIZE Correlation
APP
Correlation
Source: SPSS output from financial statements of sample companies, 2010-2012
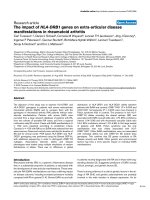
4.2.2 Test result for significance of the model
In this table 4.3 we can see, at a significance level of 0.01 the regression model predicts
the outcome variables. Regarding the significance of the relationship between dependent
variables and all the other independent variables are explained by 6.7 given on Fstatistics.
22
The model is tested by ANOVA and model summary tale. ANOVA of linear regression
indicated that the regression model predicts the outcome variable significantly good
enough in predicting the outcome variable.
Table 4.3 ANOVA linear regression for significant of the model
ANOVAb
Model
1
Sum of Squares
Regression
df
Mean Square
663.198
7
94.743
Residual
1746.194
124
2409.392
Sig.
6.728
.000a
14.082
Total
F
131
a. Predictors: (Constant), siz, cr, itd, dr, app, ard, ccc
b. Dependent Variable: roa
Source: SPSS output from financial statements of sample companies, 2010-2012
Table 4.4 shows R is 52.5 percent while R2 and adjusted R2 are 27.5 percent and 23.4
percent. Similarly, statistics result for Durbin- Watson is 0.882.
R2 is 27.5 percent present that 27.5 Percent explained by its independent variables which
is large. Therefore, the regression model used for the study is highly explained to overall
model signifying the study was note lost very important variables that effect the study
output.
Table 4.4 Model summary of linear regression
Model Summaryb
Adjusted R
Model
1
R
R Square
.525a
.275
Std. Error of the
Square
Estimate
.234
3.75262729
Durbin-Watson
.882
a. Predictors: (Constant), siz, cr, itd dr, app, ard, ccc
b. Dependent Variable: roa
Source: SPSS output from financial statements of sample companies, 2010-2012
4.2.3 Results for Pearson’s correlation coefficient
From the result in table 4.5 the researcher started to analysis of correlation results
between the size and Return on Assets. The result of correlation show a positive
coefficient 0.407 and with p-value of 0.000. It presented that the result is highly
significant at α = 1 percent significant level and that if size of company increases it will
have a positive impact on the profitability and increase it.
23
The correlation result between current ratio and Return on Assets has a significant
positive relationship with profitability measure is 0.244 and p-value is 0.005 and the
result is significant at α = 0.01 percent. It has significant.
Another ratio measures liquidity of the firm is debt ratio. The Pearson Correlation shows
the negative relationship with Return on Assets and coefficient is -0.029 and p-value is
0.74. However, the P- value is not significant at all.
One more correlation result has negative relationship with Return on Asset is inventory
days is -0.049 and p-value is 0.577. It is also not significant.
Correlation results between cash conversion cycle, average receivables days, average
payables days and Return on Assets have a positive coefficient with profitability of firms
are 0.121; 0.079; 0.065 and p-value is 0.168, 0.37, 0.458. The p-value are not
significant.
Table 4.5 Result for Pearson’s correlation coefficient
24
Correlations
ROA
ROA
Pearson Correlation
CR
DR
ARD
ITD
CCC
SIZE
APP
1
Sig. (2-tailed)
N
CR
Pearson Correlation
132
.244**
1
Sig. (2-tailed)
N
.007
132
132
132
Pearson Correlation
.079
-.127
-.120
.370
.146
.172
132
132
132
132
-.049
.101
.123
.060
.577
.247
.161
.496
N
132
132
132
132
132
Pearson Correlation
.121
.101
-.003
.757**
.245**
Sig. (2-tailed)
.168
.249
.970
.000
.005
N
132
132
132
132
132
132
.407**
.011
.076
.567**
.097
.647**
Sig. (2-tailed)
.000
.898
.388
.000
.271
.000
N
132
132
132
132
132
132
132
Pearson Correlation
.065
-.183*
.157
.742**
.046
.782**
.556**
Sig. (2-tailed)
.458
.036
.072
.000
.597
.000
.000
N
APP
.740
Sig. (2-tailed)
SIZE
-.235**
N
CCC
-.029
Sig. (2-tailed)
ITD
132
N
ARD
132
Sig. (2-tailed)
DR
.005
132
132
132
132
132
132
132
Pearson Correlation
Pearson Correlation
Pearson Correlation
1
1
1
1
**. Correlation is significant at the 0.01 level (2-tailed).
*. Correlation is significant at the 0.05 level (2-tailed).
Source: SPSS output from financial statements of sample companies, 2010-2012
4.2.4 Results for multiple regression
25
1
1
132