Báo cáo khoa học: Insulin resistance in human adipocytes occurs downstream of IRS1 after surgical cell isolation but at the 1 level of phosphorylation of IRS1 in type 2 diabetes pot
Bạn đang xem bản rút gọn của tài liệu. Xem và tải ngay bản đầy đủ của tài liệu tại đây (273.11 KB, 11 trang )
Insulin resistance in human adipocytes occurs
downstream of IRS1 after surgical cell isolation but at the
level of phosphorylation of IRS1 in type 2 diabetes
1
Anna Danielsson
1
, Anita O
¨
st
1
, Erika Lystedt
1
, Preben Kjolhede
2
, Johanna Gustavsson
1
,
Fredrik H. Nystrom
1,3
, and Peter Stra
˚
lfors
1
1 Department of Cell Biology and Diabetes Research Centre, University of Linko
¨
ping, Sweden
2 Department of Molecular and Clinical Medicine, Division of Obstetrics and Gynecology, University of Linko
¨
ping, Sweden
3 Department of Medicine and Care and the Diabetes Research Centre, University of Linko
¨
ping, Sweden
Insulin controls cell metabolism via metabolic signal
transduction pathways and cell proliferation via mito-
genic signal pathways. Metabolic signalling occurs
through receptor-activated phosphorylation of insulin
receptor substrate (IRS) proteins that subsequently
activate phosphatidylinositide 3-kinase (PI3-kinase) to
generate second messengers that produce increased
phosphorylation and activation of protein kinase
B ⁄ Akt (PKB). PKB appears to be central to down-
stream control of both glucose uptake and glycogen
synthesis by insulin [1,2]. Although adipocytes are ter-
minally differentiated cells that do not divide further,
insulin has the potential for genomic control via a
mitogenic signalling pathway. This may also be medi-
ated by IRS; insulin activation of the G-protein Ras
leads to phosphorylation and activation of mitogen-
activated protein (MAP) kinases – extracellular
signal-related kinase (ERK) 1 and 2 [3], and p38 [4,5] –
protein kinases that phosphorylate and control the
activity of other downstream protein kinases and
Keywords
glucose transport; insulin receptor substrate;
MAP-kinase; p38; protein kinase B
Correspondence
P. Stralfors, Department of Cell Biology,
Faculty of Health Sciences, SE58185
Linko
¨
ping, Sweden
Fax: +46 13 224314
Tel: +46 13 224315
E-mail:
(Received 5 August 2004, accepted 17
September 2004)
doi:10.1111/j.1432-1033.2004.04396.x
Insulin resistance is a cardinal feature of type 2 diabetes and also a conse-
quence of trauma such as surgery. Directly after surgery and cell isolation,
adipocytes were insulin resistant, but this was reversed after overnight incu-
bation in 10% CO
2
at 37 °C
2
. Tyrosine phosphorylation of the insulin
receptor and insulin receptor substrate (IRS)1 was insulin sensitive, but
protein kinase B (PKB) and downstream metabolic effects exhibited insulin
resistance that was reversed by overnight incubation. MAP-kinases
ERK1 ⁄ 2 and p38 were strongly phosphorylated after surgery, but was de-
phosphorylated during reversal of insulin resistance. Phosphorylation of
MAP-kinase was not caused by collagenase treatment during cell isolation
and was present also in tissue pieces that were not subjected to cell isola-
tion procedures. The insulin resistance directly after surgery and cell isola-
tion was different from insulin resistance of type 2 diabetes; adipocytes
from patients with type 2 diabetes remained insulin resistant after overnight
incubation. IRS1, PKB, and downstream metabolic effects, but not insulin-
stimulated tyrosine phosphorylation of insulin receptor, exhibited insulin
resistance. These findings suggest a new approach in the study of surgery-
induced insulin resistance and indicate that human adipocytes should
recover after surgical procedures for analysis of insulin signalling. More-
over, we pinpoint the signalling dysregulation in type 2 diabetes to be the
insulin-stimulated phosphorylation of IRS1 in human adipocytes.
Abbreviations
ERK, extracellular signal-related kinase; GLUT4, insulin-sensitive glucose transporter-4; IRS, insulin receptor substrate; MAP, mitogen-
activated protein; PKB, protein kinase B; PI3-kinase, phosphatidylinositide 3-kinase.
FEBS Journal 272 (2005) 141–151 ª 2004 FEBS 141
transcription factors. However, the MAP-kinase p38
together with the c-Jun NH
2
-terminal kinases (JNK)
are primarily activated in response to stress and cyto-
kines [6].
Failure to properly respond to insulin – insulin
resistance – is a prime characteristic of type 2 diabetes,
but also of other related conditions such as obesity.
Trauma, including surgical trauma, is also known to
cause insulin resistance in man [7–10], which in turn
may cause or aggravate tissue wasting following sur-
gery. Even relatively uncomplicated abdominal surgery
causes postoperative peripheral insulin resistance in
both man and animals [8]. Attempts to examine this at
cellular and molecular levels have yielded conflicting
results. In isolated human fat cells obtained after, as
compared to before, abdominal surgery (cholecystec-
tomy) a reduction of insulin-stimulated glucose uptake
and lipogenesis, by 35 and 50%, respectively, has been
found [11]. The sensitivity to insulin – but not the
maximal response – for glucose uptake in rat skeletal
muscle was reduced when the tissue was obtained and
analyzed after, as compared to before, abdominal
(intestinal resection) surgery
3
[12]. However, IRS1, PI3-
kinase, and PKB were reported to be even more
responsive to insulin after surgery [12]. Using the same
animal model, these authors did not find any effect on
insulin stimulation of glucose uptake in adipocytes by
surgical trauma [13].
The insulin resistance in type 2 diabetes has been the
subject of intensive research for many years. Yet, we
don’t know the details of the molecular dysregulation
in the target cells of the hormone. Studies of cells from
patients with the disease and nondiabetic subjects have
demonstrated that mutations in the insulin receptor
cannot explain the vast majority of cases of type 2 dia-
betes. Downstream defects in insulin receptor signal-
ling to tyrosine phosphorylation of IRS1 has been
reported for skeletal muscle [14–17]. Corresponding
effects in human adipose tissue has not been reported,
but lowered serine phosphorylation and impaired
translocation of PKB to the plasma membrane has
been described in adipocytes from type 2 diabetic
patients [18]. A lowered expression of adipocyte IRS1
has, however, been described in some obese individuals
and relatives of patients with diabetes [19]. Animal
studies have also indicated a role for IRS1 in insulin
resistance in adipose tissue (reviewed in [20,21]).
We aimed to compare the insulin resistance of surgi-
cal trauma with that in type 2 diabetes and to define,
in some detail, the dysfunction in insulin signal trans-
duction in these conditions. We demonstrate that adi-
pocytes were insulin resistant when isolated from
normal subjects, but that this insulin resistance could
be reversed. The insulin resistance in cells from
patients with type 2 diabetes, on the other hand, was
not reversible.
Results
Non-diabetic control subjects
In adipocytes analyzed directly (within 4 h) after their
excision during open abdominal surgery, MAP-kinases
ERK1 ⁄ 2 and p38 proteins were highly phosphorylated
and addition of insulin had no, or very little, effect on
their extent of phosphorylation (Fig. 1A,B).
A
B
C
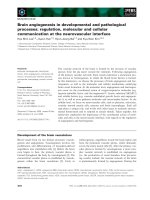
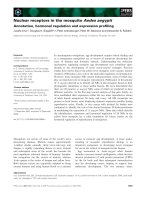
Fig. 1. Phosphorylation of MAP-kinases before and after overnight
recovery; effects of insulin. (A, B) Human adipocytes, from control
subjects, were incubated with 100 n
M insulin for 10 min, directly or
after overnight (o ⁄ n) recovery. Whole-cell lysates were subjected to
SDS ⁄ PAGE and immunoblotting against phospho-ERK1 ⁄ 2 (A) or
phospho-p38 (B). (C) Dose–response relationship for insulin stimula-
tion of phosphorylation of ERK1 (s) and 2 (n). After overnight
recovery cells were incubated with indicated concentration of insu-
lin for 10 min. Mean ± SE, n ¼ 5 subjects. In this and the following
figures, the insulin-stimulated effect was obtained by setting the
value with no insulin to 0% and that of 100 n
M insulin to 100%
effect. Dose–response curves were fitted to experimental data
using the sigmoidal dose–response algorithm in
GRAPHPAD Prism 4
software.
Insulin resistance in human adipocytes A. Danielsson et al.
142 FEBS Journal 272 (2005) 141–151 ª 2004 FEBS
When we analyzed the cells after overnight incu-
bation (20 to 24 h), all three MAP-kinases exhibited
lowered levels of phosphorylation (Fig. 1A,B). Insulin
treatment now caused a significant increase in the
phosphorylation of ERK 1 and 2 (Fig. 1A), but had
no effect on the phosphorylation of p38 MAP-kinase
(Fig. 1B). Half-maximal effects (EC
50
) on the phos-
phorylation of both ERK 1 and 2 were at 0.3 nm insu-
lin (Fig. 1C).
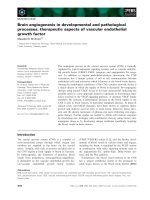
Directly after their isolation, adipocytes responded
to insulin by increasing the uptake of 2-deoxyglucose.
Neither the maximal effect of insulin on glucose
uptake and hence the amount of GLUT4 (M. Karls-
son, H. Wallberg-Henriksson, P. Stra
˚
lfors, unpublished
observations), nor basal glucose uptake was substan-
tially affected by overnight incubation of the cells prior
to analysis (not shown). Insulin stimulated, however,
glucose transport at markedly lower concentrations
after overnight incubation; EC
50
was 0.1 to 0.2 nm
insulin when analyzed directly and 0.02 to 0.03 nm
after overnight recovery (Fig. 2 and Table 1). This
increased sensitivity to insulin was similar in the sub-
jects, irrespective of the maximal effect of insulin on
the rate of glucose uptake, which in contrast was
highly variable among the subjects and ranged from 19
to 214 nmol
4
2-deoxyglucoseÆmin
)1
ÆL
)1
packed cell vol-
ume (126 ± 32, mean ± SE, n ¼ 8) and was not
affected by overnight incubation of the cells. Incuba-
tion for 48 h did not further increase (or decrease) the
insulin sensitivity.
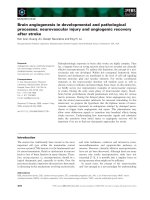
The insulin receptor, the immediate downstream
signal mediator IRS1, and the further downstream
PKB were not significantly phosphorylated under
basal conditions in cells analyzed directly (Fig. 3), in
contrast to the MAP-kinases (Fig. 1). A maximal
insulin concentration (100 nm) caused an increased
phosphorylation of all three proteins (Fig. 3). This
pattern was not significantly changed by overnight
incubation of the cells (Fig. 3). Maximal insulin-
stimulated increase in tyrosine phosphorylation of the
insulin receptor was 10.6 ± 2.3 and 9.6 ± 4.2-fold
(n ¼ 5) directly and after overnight incubation,
respectively; of IRS1 10.3 ± 3.2 and 14.7 ± 7.3 -fold,
respectively, and glucose uptake 3.9 ± 0.9 and
3.8 ± 0.8-fold, respectively. There was no significant
difference when analyzed directly compared with after
overnight incubation.
When the insulin-responsiveness of the cells was
examined at different concentrations of insulin, we
found that insulin enhanced the phosphorylation of
PKB at lower concentrations after overnight recovery
when compared to analysis the same day as the sur-
gery (Fig. 4C and Table 1). The EC
50
was reduced
from about 1 nm to 0.4 nm. Moreover, after over-
night recovery, the increased phosphorylation of PKB
occurred over a more narrow range of insulin concen-
trations (Fig. 4C). In contrast, the sensitivity to insulin
for insulin receptor or IRS1 phosphorylation was not
affected by overnight incubation; EC
50
was 1.4 nm and
0.6 nm insulin, respectively (Fig. 4A,B and Table 1).
Fig. 2. Dose–response effect of insulin on glucose uptake by adi-
pocytes before (s) and after (d) overnight recovery. Incubation of
adipocytes, from control subjects, with insulin at indicated concen-
trations for 10 min. Glucose transport was determined as uptake of
2-deoxy-
D-[1-
3
H]glucose by the cells. Mean ± SE, n ¼ 8 subjects.
The dose–response curves were significantly different, P < 0.05.
Table 1. EC
50
for insulin effects in human adipocytes. Adipocytes from nondiabetic subjects or patients with type 2 diabetes were analyzed
directly or after an overnight (o ⁄ n) recovery period. The EC
50
values, given in nM, were obtained from the dose–response curves in Figs 2,4,
and 7.
Analysis
Subjects
Normal Female diabetic Male diabetic
Directly o ⁄ n Directly o ⁄ n Directly o ⁄ n
Insulin receptor 1.1–1.8 1.1–1.8 1.1–1.8 1.1–1.8 1.1–1.8 1.1–1.8
IRS1 0.6–0.7 0.6–0.7 1.8–2.0 1.8–2.0 1.8–2.0 1.8–2.0
PKB 0.9–1.1 0.3–0.4 0.6–0.7 0.6–0.7 0.6–0.7 0.6–0.7
Glucose transport 0.1–0.2 0.02–0.03 0.1–0.2 0.1–0.2 0.1–0.2 0.1–0.2
A. Danielsson et al. Insulin resistance in human adipocytes
FEBS Journal 272 (2005) 141–151 ª 2004 FEBS 143
The overnight incubation could have selected for
small and sturdy cells that might be more insulin-
responsive. We found, however, that the mean fat cell
diameter was similar before and after overnight incu-
bation: 94 ± 2.0 lm and 93 ± 1.4 lm (mean ± SE,
n ¼ 3 subjects), respectively.
The effect of insulin on the insulin receptor and
downstream effectors IRS1 and PKB, eventually lead-
ing to enhanced glucose transport, appeared at succes-
sively lower concentrations of insulin, when the cells
were analyzed after overnight recovery (Fig. 5). It was
striking that the phosphorylation of PKB occurred
over a very narrow range of insulin concentrations
compared with the effect of insulin on the insulin
receptor, IRS1, or glucose transport, which were all
affected over a similar range of insulin concentrations
(Fig. 5).
The fat tissues in these experiments were obtained
during surgery and general anaesthesia. We therefore
compared these with subcutaneous adipocytes from
tissue obtained by a small incision in the abdominal skin
under local anaesthesia. Also, in these cases ERK1 ⁄ 2
were phosphorylated and insulin had no further effect
when analyzed directly (Fig. 6A), but when analyzed
after overnight incubation ERK1 ⁄ 2 were dephosphory-
lated and now responded to insulin stimulation
(2.3 ⁄ 2.3-fold increased phosphorylation
5
of ERK1 ⁄ 2,
respectively) (Fig. 6A). This was similar to the effect of
insulin on ERK1 ⁄ 2 in cells obtained during surgery and
general anaesthesia from normal controls and from
patients with diabetes (Table 2). As these analyses don’t
distinguish between effects of the surgery per se and the
postsurgical isolation of adipocytes, we subjected isola-
ted adipocytes, which had been incubated overnight, to
a second round of collagenase treatment. As shown in
A
B
C
Fig. 3. Phosphorylation of insulin receptor, IRS1, and PKB before
and after overnight recovery; maximal effects of insulin. Adipocytes
from control subjects were incubated with 100 n
M insulin for
10 min, either directly or after overnight (o ⁄ n) recovery. Whole-cell
lysates were subjected to SDS ⁄ PAGE and immunoblotting against
phospho-tyrosine (A,B), or phospho-PKB (C).
Fig. 4. Dose–response effect of insulin on phosphorylation of insu-
lin receptor, IRS1, and PKB before (s) and after (d) overnight
recovery. Whole cell lysates, of adipocytes form control subjects,
were subjected to SDS ⁄ PAGE and immunoblotting against phos-
pho-tyrosine [insulin receptor (A), IRS1 (B)]. (C) phospho-PKB.
Mean ± SE, n ¼ 4 subjects. The dose–response curves in C, but
not in A,B were significantly different, P < 0.05.
Insulin resistance in human adipocytes A. Danielsson et al.
144 FEBS Journal 272 (2005) 141–151 ª 2004 FEBS
Fig. 6B, the collagenase treatment did not affect
ERK1 ⁄ 2 phosphorylation and insulin retained the
ability to increase the phosphorylation of ERK1 ⁄ 2, by
4.2 ⁄ 3.5-fold, respectively. When we analyzed small
pieces of adipose tissue, which had not been subjected to
collagenase treatment at all, without overnight incuba-
tion, insulin did not affect the phosphorylation of
ERK1 ⁄ 2 (Fig. 6C) as they were most probably already
fully phosphorylated.
6
Using a different approach we
analyzed rat adipocytes that were obtained without any
surgical procedures (post mortem) following rapid cervi-
cal dislocation, and with the same cell isolation proce-
dure as used for human adipocytes. Directly after
isolation, ERK1 ⁄ 2 phosphorylation was low in the rat
adipocytes and they responded to insulin with increased
phosphorylation of ERK1 ⁄ 2 (not shown). When the rat
adipocytes were analyzed directly, insulin stimulated
glucose uptake 9.0-fold (mean of two separate cell prep-
arations), but after overnight incubation of the cells,
insulin stimulated glucose uptake only 2.3-fold.
Patients with type 2 diabetes
We next isolated adipocytes from a group of female
and a group of male patients with type 2 diabetes and
examined the insulin responsiveness of the cells after
overnight incubation (to avoid interference from the
insulin resistance that we found when cells were ana-
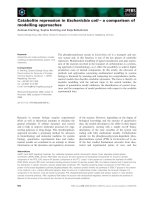
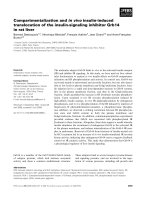
lyzed directly). In these cells, the insulin receptor
autophosphorylation in response to insulin was similar
to cells from nondiabetic subjects (Fig. 7A and
Table 1). IRS1 phosphorylation, however, occurred at
substantially higher concentrations of insulin, EC
50
¼
2.0 nm insulin, compared to 0.6 nm in nondiabetic sub-
jects (Fig. 7B and Table 1). PKB phosphorylation
similarly occurred at higher concentrations of insulin,
EC
50
¼ 0.7 nm insulin, compared to 0.4 nm in nondia-
betic subjects (Fig. 7C and Table 1). Moreover, the
dose–response curve for insulin activation of PKB did
not exhibit the steep increase over a very small range
Fig. 5. Dose–response relationship for insulin control of the meta-
bolic signalling pathway (data from Figs 3 and 4, after overnight
recovery). Following overnight recovery, EC
50
for insulin was found
at decreasing concentrations, from the signal generator (the insulin
receptor) to the target effect (glucose uptake). Note that MAP-
kinases ERK1 and 2 of insulin’s mitogenic signalling pathway exhi-
bited a similar sensitivity (EC
50
) to insulin as PKB (Fig. 1C).
A
B
C
Fig. 6. Effects on ERK1 ⁄ 2 phosphorylation by alternative tissue and
cell treatments. Tissue was obtained from female nondiabetic sub-
jects. (A) Abdominal subcutaneous adipose tissue was obtained by
a small incision under local anaesthesia and cells isolated. The cells
were incubated with or without 100 n
M insulin for 10 min, directly
or after overnight incubation (o ⁄ n). Insulin stimulated the phos-
phorylation of Erk1 ⁄ 21.0⁄ 1.1-fold, respectively (directly) and
2.3 ⁄ 2.3-fold (o ⁄ n) (average of cells from two different subjects).
(B) Cells obtained after surgery were incubated overnight, treated
with or without collagenase for 15 min and then with or without
100 n
M insulin for 10 min. Insulin stimulated the phosphorylation of
Erk1 ⁄ 22.4⁄ 2.4-fold
11
(nontreated control) and 4.2 ⁄ 3.5-fold (collage-
nase treated) (average of cells from two different subjects). (C) Adi-
pose tissue obtained during surgery was cut into small pieces and
directly incubated (without collagenase treatment) with or without
100 n
M insulin for 20 min. Insulin did not affect the phosphorylation
of Erk1 ⁄ 2 1.1 ⁄ 1.0-fold (average of tissue from two different sub-
jects).
A. Danielsson et al. Insulin resistance in human adipocytes
FEBS Journal 272 (2005) 141–151 ª 2004 FEBS 145
of insulin concentration that characterized the response
to insulin in cells from control subjects.
As a result of the resistance to insulin, activation of
IRS1 and the downstream PKB, the EC
50
for glucose
uptake was at 0.1 to 0.2 nm insulin in adipocytes from
the diabetic patients, compared to an EC
50
¼ 0.02 to
0.03 nm in cells from nondiabetic subjects (Fig. 7D
and Table 1). The maximal rate of glucose uptake in
the fat cells from the female patients with type 2 diabe-
tes, 199 ± 26 nmol 2-deoxyglucoseÆmin
)1
ÆL
)1
packed
Fig. 7. Dose–response effect of insulin in adipocytes from controls subjects and type 2 diabetic patients after overnight incubation. Cells
were incubated overnight and then with the indicated concentration of insulin for 10 min before whole-cell lysates were subjected to
SDS ⁄ PAGE and immunoblotting against phospho-tyrosine [insulin receptor (A), IRS1 (B)]; (C), phospho-PKB; (D) glucose transport, deter-
mined as uptake of 2-deoxy-
D-[1-
3
H]glucose by the cells. d, control subjects, mean ± SE, n ¼ 4 (glucose transport, n ¼ 8); s, male diabetic
patients, mean ± SE, n ¼ 4; h, female diabetic patients, mean ± SE, n ¼ 5. The dose–response curves for control vs. the diabetic group
were significantly different in B,C,D, P < 0.05, but they were not significantly different in A.
Table 2. Maximal insulin effects in human adipocytes. Adipocytes from nondiabetic subjects or patients with type 2 diabetes were analyzed
after an overnight recovery period. The maximal insulin-stimulation is expressed as -fold over basal ± SE. Student’s t-test for comparison of
the indicated diabetic group with the normal nondiabetic group; ND, not determined as basal level of phosphorylation was close to zero; (n),
number of subjects.
Analysis
Subjects
Normal Female diabetic Male diabetic
Insulin receptor 9.6 ± 4.2 (5) 5.4 ± 1.7 (5), P ¼ 0.4 16.5 ± 4.5 (4), P ¼ 0.3
IRS1 14.7 ± 7.3 (4) 4.6 ± 1.1 (5), P ¼ 0.2 10.2 ± 1.7 (4), P ¼ 0.6
PKB ND ND ND
Glucose transport 3.8 ± 0.8 (6) 3.2 ± 1.3 (5), P ¼ 0.5 6.1 ± 4.4 (3), P ¼ 0.5
ERK1 2.0 ± 0.4 (4) 2.2 ± 0.8 (5), P ¼ 0.8 1.8 ± 0.5 (4), P ¼ 0.8
ERK2 2.3 ± 0.3 (4) 2.2 ± 0.6 (5), P ¼ 0.9 1.5 ± 0.3 (4), P ¼ 0.1
Insulin resistance in human adipocytes A. Danielsson et al.
146 FEBS Journal 272 (2005) 141–151 ª 2004 FEBS
cell volume (mean ± SE, n ¼ 5), varied (118 to
255 nmolÆmin
)1
ÆL
)1
) from individual to individual. The
maximal rate of glucose uptake in the fat cells from
the group of male patients with type 2 diabetes,
74 ± 32 nmol 2-deoxyglucoseÆmin
)1
ÆL
)1
packed cell
volume (mean ± SE, n ¼ 4), varied considerably (12
to 152 nmolÆmin
)1
ÆL
)1
) from individual to individual.
Maximal insulin-stimulated rate of glucose uptake in
cells from the diabetic patients was not different from
cells from the nondiabetic control subjects. Similarly,
the maximal effects of insulin on the state of tyrosine-
phosphorylation of the insulin receptor or of IRS1, or
of phosphorylation of ERK1 ⁄ 2, was not significantly
different in either group of diabetics compared with
the nondiabetic controls (Table 2).
The dose–response curves for insulin effects on the
insulin receptor, IRS1, PKB, and glucose transport
analyzed directly after surgery were identical and with
the same EC
50
values (Table 1) as when analyzed after
overnight recovery. The insulin resistance in the cells
from patients with diabetes was thus not reversible.
The average size of the adipocytes from diabetic
patients (92 ± 2.4 lm diameter) did not differ from
those of nondiabetic control subjects (94 lm, see
above).
Discussion
Insulin resistance resulting from surgical
procedures
The findings herein demonstrate that MAP-kinases
ERK 1 and 2, and p38, are phosphorylated and
hence activated in situ in normal human adipose tis-
sue obtained during surgery. This phosphorylation
was reversed after overnight recovery and stimulation
with insulin then increased the phosphorylation of
ERK1 ⁄ 2 while it had no effect on the phosphoryla-
tion of p38 MAP-kinase in human adipocytes. This
was similar to what has been shown in rat skeletal
muscle [25] but is in contrast to reports that insulin
activates p38 in 3T3-L1 adipocytes and L6 myotubes
[4,5].
7
The insulin receptor and its metabolic down-
stream signal mediators (IRS1 and PKB) were largely
unphosphorylated in fresh adipocytes and unaffected
by overnight recovery. We therefore exclude insulin as
causing the basal activation of MAP-kinases; especi-
ally as we found that a substantial degree of phos-
phorylation of the insulin receptor and IRS1 was
required to increase the phosphorylation of ERK1 ⁄ 2
(Figs 1C and 5).
Our findings indicate that the collagenase treatment
to isolate adipocytes from the tissue was not the cause
of the basal ERK1 ⁄ 2 phosphorylation that we detected
directly after surgery. It is probable that the insulin
resistance we found directly after surgery was the
result of the surgical procedures and not of post surgi-
cal isolation of the cells. Similar to the whole-body
insulin resistance that results from minor and major
surgical procedures, a small incision during local
anaesthesia had a similar effect to abdominal surgery
under general anaesthesia on ERK1 ⁄ 2 in the adipo-
cytes. In contrast to the human adipocytes, rat adipo-
cytes did not fare well during overnight incubation as
demonstrated by impaired glucose uptake in response
to insulin. Evidently human adipocytes are not affected
by cell isolation procedures and prolonged incubations
in the same way as rat and mouse [26] cells.
The insulin-sensitivity for phosphorylation of the
insulin receptor and the immediate downstream medi-
ator IRS1 was not measurably affected by the surgical
cell isolation procedures and overnight recovery. How-
ever, the downstream mediator PKB as well as the cru-
cial metabolic effect – glucose transport – exhibited
insulin resistance directly after surgery, which was
reversed after overnight recovery of the cells. It is
notable that the maximal effect of insulin on PKB and
glucose transport was not significantly affected by the
overnight recovery period, while the sensitivity to insu-
lin was invariably improved. The fact that even minor
surgery produces insulin resistance [8] indicates that it
is difficult to obtain control tissue to study trauma-
induced insulin resistance, which may explain the con-
flicting results reported earlier [11–13]. Obtaining the
insulin resistant cells directly and the control cells after
overnight recovery, as described herein, is a new
approach to further investigate trauma-induced insulin
resistance on a cellular and molecular level.
It should be noted that the analyses of insulin effects
on glucose transport and the different signal mediators
of the hormone were performed on the same cell sam-
ple from the same individual. Responses for the differ-
ent signal mediators are therefore directly comparable.
The results demonstrate increasing insulin sensitivity
downstream of the insulin receptor, probably resulting
from the inherent signal amplification in the succeed-
ing enzymatic signalling steps. This is clearly compat-
ible with and explains the fact that only a small
percentage of insulin receptors need to be activated to
produce a substantial downstream response [27]. It is
interesting that the effects of insulin on PKB phos-
phorylation occurred over a much narrower concentra-
tion range than on the insulin receptor, IRS1, or
glucose transport (Fig. 5). The steep dose–response
curve indicates a cooperative effect of insulin on PKB
phosphorylation. This could be explained by the
A. Danielsson et al. Insulin resistance in human adipocytes
FEBS Journal 272 (2005) 141–151 ª 2004 FEBS 147
complicated translocation and activation processes
involved in control of PKB, in response to insulin,
which involves dual phosphorylation of PKB by insu-
lin-activation of the phosphoinositide-dependent pro-
tein kinase-1 (PDK1) [28] and the yet unidentified
PDK2 [29,30]. Our findings, furthermore, suggest that
insulin resistance due to the surgical cell isolation pro-
cedures or to type 2 diabetes may involve loss of the
cooperative effect on PKB, which is compatible with
earlier findings that serine and threonine phosphoryla-
tion of PKB is differently affected in type 2 diabetes
[18].
MAP-kinases, particularly p38, but also ERK 1 and
2, have been shown to be phosphorylated ⁄ activated
when cells are exposed to various types of stress
[6,31,32]. Stress hormones such as adrenaline [33] and
glucocorticoids [34] have been shown to inhibit insulin-
stimulated glucose disposal in man. It is therefore
possible that a stress response due to the surgical pro-
cedure has caused the extensive phosphorylation ⁄ acti-
vation of the MAP-kinases reported here. Similar
results with human adipocytes were reported recently,
but overnight recovery was not used and the highly
phosphorylated ERK1 ⁄ 2 and p38 was attributed to
type 2 diabetes [35] rather than to the surgical proce-
dures as indicated herein.
We can conclude that a node of cross-talk between
the stress-generated signal and insulin signalling is
located at the level of IRS1 or between IRS1 and
PKB. The effect and ultimate function of stress signal-
ling in adipose tissue is not known. Discovering how a
stress signal is translated into a reduced sensitivity to
insulin for phosphorylation of PKB and for glucose
transport control may ultimately allow improved surgi-
cal procedures to avoid or reduce postoperative insulin
resistance.
Insulin resistance in type 2 diabetes
Tyrosine phosphorylation of the insulin receptor
increased over the same concentration range of insulin
in cells from patients with type 2 diabetes as from nondi-
abetic subjects, when assayed directly as well as after
overnight incubation. Phosphorylation of IRS1
required, however, significantly higher concentrations of
insulin in the cells from patients with diabetes than from
nondiabetic subjects, both when assayed directly and
after overnight incubation. It thus appears that IRS1 is
the first step in insulin signalling that contributes to dia-
betic insulin resistance in human adipocytes, similar to
that found earlier in human skeletal muscle in diabetes
[14–16] and obesity [17]. This may be the result of,
e.g. enhanced serine ⁄ threonine phosphorylation of
IRS1, making it a worse substrate for the insulin recep-
tor as described in various in vitro systems and models
of insulin resistance [36–40]. Lowered expression of
IRS1 in adipocytes has been described in some obese
individuals or relatives of diabetes patients [19]. Natur-
ally occurring mutations in IRS1 have been identified in
subjects with type 2 diabetes and also reported to impair
insulin action [41–45]. Our findings indicate that insulin
resistance is not different in adipocytes from female and
male patients with type 2 diabetes.
In conclusion, our findings demonstrate a physiolog-
ically relevant cell model for analyses, at the cell and
molecular levels, of how surgical cell isolation proce-
dures may interfere with insulin’s control of meta-
bolism.
8
We demonstrated that reversible insulin
resistance directly after isolation of the cell exhibits
fundamental differences from the chronic insulin resist-
ance in type 2 diabetes. In particular, signalling dys-
regulation in adipocytes from patients with type 2
diabetes was demonstrated at the level of insulin-
stimulated phosphorylation of IRS1.
Experimental procedures
Subjects
Samples of subcutaneous abdominal fat were obtained from
patients at the University Hospital of Linko
¨
ping. Pieces of
adipose tissue were excised during elective abdominal sur-
gery and general anaesthesia at the beginning of the opera-
tion [eight nondiabetic control subjects (females: age
32–89 years; BMI 17–27) and five diabetic patients (females;
age 44–72 years; BMI 28–48; HbA1c 5.7 to 9.7%]. Subcuta-
neous adipose tissue was excised by incision under local
anaesthesia from four volunteers with type 2 diabetes
(males: age 41–70 years; BMI 31–39; HbA1c 3.9–6.8%).
Patients with diabetes were treated with sulfonylurea, sulfo-
nylurea in combination with metformin, or with insulin.
The study was approved by the Local Ethics Committee
and participants gave their informed approval.
Materials
Rabbit anti-insulin receptor b-chain polyclonal and mouse
anti-phosphotyrosine (PY20) monoclonal Igs were from
Transduction Laboratories (Lexington, KY, USA). Rabbit
anti-phospho(Thr308)-PKB ⁄ Akt polyclonal Igs were from
Upstate Biotech. (Charlottesville, VA, USA). Rabbit poly-
clonal antibodies against phospho-ERK1 ⁄ 2 and phospho-
p38 MAP-kinase were from Cell Signaling Techn. (Beverly,
MA, USA). Rabbit anti-IRS1 polyclonal Igs were from
Santa Cruz Biotech. (Santa Cruz, CA, USA). 2-Deoxy-d-
[1-
3
H]glucose was from Amersham Biotech (Uppsala, Swe-
den). Insulin and other chemicals were from Sigma–Aldrich
Insulin resistance in human adipocytes A. Danielsson et al.
148 FEBS Journal 272 (2005) 141–151 ª 2004 FEBS
(St. Louis, MO, USA) or as indicated in the text. Harlan
Sprague–Dawley rats (160–200 g) were from B & K Univer-
sal (Sollentuna, Sweden). The animals were treated accord-
ing to Swedish Animal Care regulations.
9
Isolation and incubation of adipocytes
Adipocytes were isolated by collagenase (type 1, Worthing-
ton, NJ, USA) digestion as described [22]. At a final con-
centration of 100 lL packed cell volume per ml, cells were
incubated in Krebs ⁄ Ringer solution (0.12 m NaCl, 4.7 mm
KCl, 2.5 mm CaCl
2
, 1.2 mm MgSO
4
, 1.2 mm KH
2
PO
4
)
containing 20 mm Hepes, pH 7.40, 1% (w ⁄ v) fatty acid-free
bovine serum albumin, 100 nm phenylisopropyladenosine,
0.5 UÆmL
)1
adenosine deaminase with 2 mm glucose, at
37 °C on a shaking water bath for immediate analysis. For
analysis after 20 to 24 h incubation, cells were incubated at
37 °C, 10% (v ⁄ v) CO
2
in the same solution mixed with an
equal volume of DMEM containing 7% (w ⁄ v) albumin,
200 nm adenosine, 20 m m Hepes, 50 UIÆmL
)1
penicillin,
50 lgÆmL
)1
streptomycin, pH 7.40. Before analysis, cells
were washed and transferred to the Krebs ⁄ Ringer solution.
Average cell diameter was determined from microscopy
photo enlargements using a ruler ( 200 cells from each
subject were analyzed).
SDS ⁄ PAGE and immunoblotting
Cell incubations were terminated by separating cells from
medium by centrifugation
10
through dinonylphtalate (5000 g
for 3 s at room temperature). The cells were dissolved
immediately in SDS and 2-mercaptoethanol with protease
and protein phosphatase inhibitors, frozen within 10 s, and
thawed in boiling water to minimize postincubation signal-
ling modifications in the cells and protein modifications
during immunoprecipitation [22]. Equal amounts of cells
(i.e. total cell volume), as determined by lipocrit, was
subjected to SDS ⁄ PAGE and immunoblotting. After
SDS ⁄ PAGE and electrotransfer, membranes were incubated
with the appropriate antibodies detected using enhanced
chemiluminescence (ECL+ Amersham Biosciences) with
horseradish peroxidase-conjugated anti-IgG as secondary
antibody, and evaluated by chemiluminescence imaging
(Las1000, Image-Gauge, Fuji, Tokyo, Japan).
Using two-dimensional electrofocusing (pH 3–10),
SDS ⁄ PAGE analysis [23] and immunoblotting against
phosphotyrosine and IRS1, > 95% of the tyrosine phos-
phorylated 180-kDa band was determined to represent
IRS1.
Determination of glucose transport
Glucose transport was determined as uptake of 2-deoxy-
d-[1-
3
H]glucose [24] after transfer of cells to medium with-
out glucose. 2-Deoxy-d-[1-
3
H]glucose was added to a final
concentration of 50 lm (10 lCiÆmL
)1
) and the cells were
incubated for 30 min. It was verified that uptake was linear
for at least 30 min.
Statistics
Dose–response curves were compared using F-test with the
sigmoidal curve-fitting algorithm in graphpad Prism 4
(GraphPad Software, Inc., San Diego, CA, USA). The null
hypothesis was rejected if P < 0.05.
Acknowledgements
Financial support was from Lions Foundation, Swe-
dish Society for Medical Research, A
˚
ke Wiberg Foun-
dation, Swedish National Board for Laboratory
Animals, O
¨
stergo
¨
tland County Council, Linko
¨
ping
University Hospital Research Funds, Swedish Society
of Medicine, Swedish Diabetes Association, and the
Swedish Research Council.
References
1 Whitehead JP, Clark SF, Urso B & James DE (2000)
Signalling through the insulin receptor. Curr Opin Cell
Biol 12, 222–228.
2 Saltiel AR & Kahn CR (2001) Insulin signalling and the
regulation of glucose and lipid metabolism. Nature 414,
799–806.
3 Avruch J, Khokhlatchev A, Kyriakis JM, Luo Z,
Tzivion G, Vavvas D & Zhang X-F (2001) Ras activa-
tion of the Raf kinase: tyrosine kinase recruitment of
the MAP kinase cascade. Rec Progr Hormone Res 56,
807–869.
4 Sweeney G, Somwar R., Ramlal T, Volchuk A, Ueyama
A & Klip A (1999) An inhibitor of p38 mitogen-
activated protein kinase prevents insulin-stimulated glu-
cose transport but not glucose transporter translocation
in 3T3-L1 adipocytes and L6 myotubes. J Biol Chem
274, 10071–10078.
5 Somwar R., Kim DY, Sweeney G, Huang C, Niu W,
Lador C, Ramlal T & Klip A (2001) GLUT4 trans-
location precedes the stimulation of glucose uptake by
insulin in muscle cells: potential activation of GLUT4
via p38 mitogen-activated protein kinase. Biochem J
359, 639–649.
6 Kyriakis JM & Avruch J (2001) Mammalian mitogen-
activated protein kinase signal transduction pathways
activated by stress and inflammation. Physiol Rev 81,
807–869.
7 Cuthberson DP (1942) Post-shock metabolic response.
Lancet i, 433–437.
A. Danielsson et al. Insulin resistance in human adipocytes
FEBS Journal 272 (2005) 141–151 ª 2004 FEBS 149
8 Thorell A, Efendic S, Gutniak M, Haggmark T &
Ljungqvist O (1994) Insulin resistance after abdominal
surgery. Br J Surg 81, 59–63.
9 Brandi LS, Frediani M, Oleggini M, Mosca F, Cerri M,
Boni C, Pecori N, Buzzigoli G & Ferrannini E (1990)
Insulin resistance after surgery: normalization by insulin
treatment. Clin Sci 79, 443–450.
10 Brandi L, Santoro D, Natali A, Altomonte F, Baldi S,
Frascerra S & Ferrannini E (1993) Insulin resistance of
stress: sites and mechanisms. Clin Sci 85, 525–535.
11 Nordenstrom J, Sonnenfeld T & Arner P (1989) Charac-
terization of insulin resistance after surgery. Surgery
105, 28–35.
12 Stro
¨
mmer L, Permert J, Arnelo U, Koehler C, Isaks-
son B, Larsson J, Lundkvist I, Bjo
¨
rnholm M, Kaw-
ano Y, Wallberg-Henriksson H & Zierath JR (1998)
Skeletal muscle insulin resistance after trauma: insulin
signaling and glucose transport. Am J Physiol 275,
E351–E358.
13 Strommer L, El-Ella GA, Kamel A, Marcus C, Hager
P, Adrian TE & Permert J (2001) Upregulation of
uncoupling protein homologues in skeletal muscle but
not adipose tissue in posttraumatic insulin resistance.
Biochem Biophys Res Commun 281, 334–340.
14 Cusi K, Maezono K, Osman A, Pendergrass M, Patti
ME, Pratipanawatr T, DeFronzo RA, Kahn CR &
Mandarino LJ (2000) Insulin resistance differentially
affects the PI 3-kinase and MAP kinase-mediated sig-
naling in human muscle. J Clin Inv 105, 311–320.
15 Bjo
¨
rnholm M, Kawano Y, Lehtihet M & Zierath J
(1997) Insulin receptor substrate-1 phosphorylation and
phosphatidylinositol 3-kinase acitivity in skeletal muscle
from NIDDM subjects after in vivo insulin stimulation.
Diabetes 46, 524–527.
16 Krook A, M.Bjo
¨
rnholm Galuska D, Jiang XJ,
Fahlman R, Myers MG, Wallberg-Henriksson H &
Zierath JR (2000) Characterization of signal transduc-
tion and glucose transport in skeletal muscle from type
2 diabetic patients. Diabetes 49, 284–292.
17 Goodyear L, Giorgino F, Sherman L, Carey J, Smith R
& Dohm G (1995) Insulin receptor phosphorylation,
insulin receptor substrate-1 phosphorylation and phos-
phatidylinositol 3-kinase acativity are decreased in intact
skeletal muscle strips from obese subjects. J Clin Inv 95,
2195–2204.
18 Carvalho E, Eliasson B, Wesslau C & Smith U (2000)
Impaired phosphorylation and insulin-stimulated trans-
location to the plasma membrane of protein kinase
B ⁄ Akt in adipocytes from type II diabetic subjects. Dia-
betologia 43, 1107–1115.
19 Carvalho E, Jansson P, Axelsen M, Eriksson J, Huang
X, Groop L, Rondinone C, Sjo
¨
stro
¨
m L & Smith U
(1999) Low cellular IRS1 gene and protein expression
predict insulin resistance and NIDDM. FASEB J 13,
2173–2178.
20 Saltiel AR (1994) The paradoxical regulation of protein
phosphorylation in insulin action. FASEB J 8, 1034–
1040.
21 White MF (2002) IRS proteins and the common path
to diabetes. Am J Physiol 283, E413–E422.
22 Stra
˚
lfors P & Honnor RC (1989) Insulin-induced
dephosphorylation of hormone-sensitive lipase. Correla-
tion with lipolysis and cAMP-dependent protein kinase
activity. Eur J Biochem 182, 379–385.
23 Rabilloud T, Blisnick T, Heller M, Luche S, Aebersold
R., Lunardi J & Braun-Breton C (1999) Analysis of
membrane proteins by two-dimensional electrophoresis:
Comparison of the proteins extracted from normal or
Plasmodium falciparum-infected erythrocyte ghosts.
Electrophoresis 20, 3603–3610.
24 Frost SC, Kohanski RA & Lane MD (1987) Effect of
phenylarsine oxide on insulin-dependent protein phos-
phorylation and glucose transport in 3T3-L1 adipocytes.
J Biol Chem 262, 9872–9876.
25 Goodyear LJ, Chang PY, Sherwood DJ, Dufresne SD
& Moller DE (1996) Effects of exercise and insulin on
mitogen-activated protein kinase signaling pathways in
rat skeletal muscle. Am J Physiol 271, E403–E408.
26 Ruan H, Zarnowski MJ, Cushman SW & Lodish HF
(2003) Standard isolation of primary adipose cells from
mouse epididymal fat pads induces inflammatory media-
tors and down-regulates adipocyte genes. J Biol Chem
278, 47585–47593.
27 Kono T & Barham F (1971) The relationship between
the insulin-binding capacity of fat cells and the cellular
response to insulin. Studies with intact and trypsin-trea-
ted fat cells. J Biol Chem 246, 6210–6216.
28 Chen H, Nystrom FH, Dong LQ, Li Y, Song S, Liu F
& Quon MJ (2001) Insulin stimulates increased catalytic
activity of phosphoinositide-dependent kinase-1 by a
phosphorylation-dependent mechanism. Biochemistry
40, 11851–11859.
29 Lizcano JM & Alessi DR (2002) The insulin signalling
pathway. Curr Biol 12, 236–238.
30 Hill MM, Feng J & Hemmings BA (2002) Identification
of a plasma membrane Raft-associated PKB Ser473
kinase activity that is distinct from ILK and PDK1.
Curr Biol 12, 1251–1255.
31 Moule SK & Denton RM (1998) The activation of p38
MAPK by the b-adrenergic agonist isoproterenol in rat
epididymal fat cells. FEBS Lett 439, 287–290.
32 Greenberg AS, Shen W-J, Muliro K, Patel S, Souza SC,
Roth RA & Kraemer FB (2001) Stimulation of lipolysis
and hormone-sensitive lipase via the extracellular signal-
regulated kinase pathway. J Biol Chem 276, 45456–
45461.
33 Deibert DC & DeFronzo RA (1980) Epinephrine-induced
insulin resistance in man. J Clin Inv 65, 717–721.
34 Rizza RA, Mandarino LJ & Gerich JE (1982) Cortisol-
induced insulin resistance in man: impaired suppresion
Insulin resistance in human adipocytes A. Danielsson et al.
150 FEBS Journal 272 (2005) 141–151 ª 2004 FEBS
of glucose production and stimulation of glucose utiliza-
tion due to a postreceptor defect of insulin action.
J Clin Endocrinol Metab 54, 131–138.
35 Carlson CJ, Koterski S, Sciotti RJ, Poccard GB &
Rondinone CM (2003) Enhanced basal activation of
mitogen-activated protein kinases in adipocytes from
type 2 diabets. Potential role of p38 in the downregula-
tion of GLUT4 expression. Diabetes 52, 634–641.
36 Hotamisligil GS, Peraldi P, Budavari A, Ellis R. &
White MF (1996) IRS-1-mediated inhibition of insulin
receptor tyrosine kinase activity in TNF-alpha- and
obesity-induced insulin resistance. Science 271, 665–
670.
37 Paz K, Hemi R., LeRoith D, Karasik A, Elhanany E,
Kanety H & Zick Y (1997) A molecular basis for insulin
resistance. Elevated serine ⁄ threonine phosphorylation of
IRS-1 and IRS-2 inhibits their binding to the juxtamem-
brane region of the insulin receptor and impairs their
ability to undergo insulin-induced tyrosine phosphoryla-
tion. J Biol Chem 272, 29911–29918.
38 Eldar-Finkelman H & Krebs EG (1997) Phosphoryla-
tion of insulin receptor substrate-1 by glycogen synthase
kinase-3 impairs insulin action. Proc Natl Acad Sci
USA 94, 9660–9664.
39 Greene M & Garofalo R. (2002) Positive and negative
regulatory role of insulin receptor substrate 1 and 2
(IRS-1 and IRS-2) serine ⁄ threonine phosphorylation.
Biochemistry 41, 7082–7091.
40 Yu C, Chen Y, Cline GW, Zhang D, Zong H, Wang Y,
Bergeron R., Kim JK, Cushman SW, Cooney GJ et al.
(2002) Mechanism by which fatty acids inhibit insulin
activation of insulin receptor substrate-1 (IRS-1)-associ-
ated phosphatidylinositol 3-kinase activity in muscle.
J Biol Chem 277, 50230–50236.
41 Esposito DL, Li Y, Vanni C, Mammarella S, Veschi S,
Loggia FD, Mariani-Constantini R., Battista P, Quon
MJ & Cama A (2003) A novel T608R missense muta-
tion in insulin receptor substrate-1 identified in a subject
with type 2 diabetes impairs metabolic insulin signaling.
J Clin Endocrinol Metab 88, 1468–1475.
42 Yoshimura R., Araki E, Ura S, Todaka M, Tsuruzoe
K, Furukawa N, Motoshima H, Yoshizato K, Kaneko
K, Matsuda K, et al. (1997) Impact of natural IRS-1
mutations on insulin signals: mutations of IRS-1 in the
PTB domain and SH2 protein binding sites result in
impaired function at different steps of IRS-1 signaling.
Diabetes 46, 929–936.
43 Imai Y, Philippe N, Sesti G, Accili D & Taylor SI
(1997) Expression of variant forms of insulin receptor
substrate-1 identified in patients with noninsulin-depen-
dent diabetes mellitus. J Clin Endocrinol Metab 84,
4201–4207.
44 Almind K, Inoue G, Pedersen O & Kahn CR (1996)
A common amino acid polymorphism in insulin recep-
tor substrate-1 causes impaired insulin signaling.
Evidence from transfection studies. J Clin Inv 97,
2569–2575.
45 Hribal ML, Federici M, Porzio O, Lauro D, Borboni P,
Accili D, Lauro R & Sesti G (2000) The Gly-Arg (972)
amino acid polymorphism in insulin receptor substrate-
1 affects glucose metabolism in skeletal muscle cells.
J Clin Endocrinol Metab 85, 2004–2013.
A. Danielsson et al. Insulin resistance in human adipocytes
FEBS Journal 272 (2005) 141–151 ª 2004 FEBS 151