Báo cáo khoa học: Increased NADPH concentration obtained by metabolic engineering of the pentose phosphate pathway in Aspergillus niger docx
Bạn đang xem bản rút gọn của tài liệu. Xem và tải ngay bản đầy đủ của tài liệu tại đây (272.01 KB, 13 trang )
Increased NADPH concentration obtained by metabolic
engineering of the pentose phosphate pathway
in Aspergillus niger
Bjarne R. Poulsen
1
, Jane Nøhr
2
, Stephen Douthwaite
2
, Line V. Hansen
2
, Jens J. L. Iversen
2
,
Jaap Visser
1,
* and George J. G. Ruijter
1,
†
1 Molecular Genetics of Industrial Microorganisms, Wageningen University, the Netherlands
2 Department of Biochemistry and Molecular Biology, University of Southern Denmark, Odense, Denmark
The pentose phosphate pathway (PPP) and glycolysis
comprise the most central pathways in primary metabo-
lism (Fig. 1). The PPP is believed to be the major source
of NADPH required for many biosynthetic and detoxifi-
cation reactions. The flux through this pathway has been
reported to increase at high NADPH requirements, for
Keywords
Aspergillus niger, gndA, NADPH,
overexpression, pentose phosphate
pathway
Correspondence
J.J.L. Iversen, Department of Biochemistry
and Molecular Biology, University of
Southern Denmark, Campusvej 55, DK-5230
Odense M, Denmark
Fax: +45 6550 2467
Tel: +45 6550 1000 ext 2376
E-mail:
Present addresses
*Fungal Genetics and Technology
Consultancy, 6700 AJ Wageningen,
the Netherlands
†Metabolic Diseases Laboratory, Leiden
University Medical Center, 2300 RC Leiden,
the Netherlands
Database
The nucleotide sequences reported are in
the GenBank database under the accession
numbers AJ551178, AJ551177 and AJ550995
(Received 24 July 2004, revised 19 December
2004, accepted 4 January 2005)
doi:10.1111/j.1742-4658.2005.04554.x
Many biosynthetic reactions and bioconversions are limited by low availab-
ility of NADPH. With the purpose of increasing the NADPH concentra-
tion and ⁄ or the flux through the pentose phosphate pathway in Aspergillus
niger, the genes encoding glucose 6-phosphate dehydrogenase (gsdA),
6-phosphogluconate dehydrogenase (gndA) and transketolase (tktA) were
cloned and overexpressed in separate strains. Intracellular NADPH concen-
tration was increased two- to ninefold as a result of 13-fold overproduction
of 6-phosphogluconate dehydrogenase. Although overproduction of glucose
6-phosphate dehydrogenase and transketolase changed the concentration of
several metabolites it did not result in increased NADPH concentration.
To establish the effects of overexpression of the three genes, wild-type and
overexpressing strains were characterized in detail in exponential and sta-
tionary phase of bioreactor cultures containing minimal media, with glu-
cose as the carbon source and ammonium or nitrate as the nitrogen source
and final cell density limiting substrate. Enzymes, intermediary metabolites,
polyol pools (intra- and extracellular), organic acids, growth rates and rate
constant of induction of acid production in postexponential phase were
measured. None of the modified strains had a changed growth rate. Partial
least square regressions showed the correlations between NADPH and up
to 40 other variables (concentration of enzymes and metabolites) and it
was possible to predict the intracellular NADPH concentration from relat-
ively easily obtainable data (the concentration of enzymes, polyols and oxa-
late). This prediction might be used in screening for high NADPH levels in
engineered strains or mutants of other organisms.
Abbreviations
6PG, 6-phosphogluconate dehydrogenase; a, ammonium; ALD, aldolase; ARC, anabolic reduction charge; CRC, catabolic reduction charge;
DB, dry biomass; DHAP, dihydroxyacetone phosphate; e, exponential growth phase; E, extracellular; F6P, fructose 6-phosphate; G6P, glucose
6-phosphate dehydrogenase; GAP, glyceraldehyde 3-phosphate; GLYDH, glycerol dehydrogenase; I, intracellular; IAP, induction of acid
production; M1PDH, mannitol 1-phosphate dehydrogenase, n, nitrate; PGI, phosphoglucose isomerase; PYR, pyruvate; R5P, ribose 5-
phosphate; RMSEP, root mean square error of prediction; Ru5P, ribulose 5-phosphate; s, stationary phase; S7P, sedoheptulose 7-phosphate,
TAL, transaldolase; TKT, transketolase; wt, wild-type; Xu5P, xylulose 5-phosphate; l
max
, maximum specific growth rate.
FEBS Journal 272 (2005) 1313–1325 ª 2005 FEBS 1313
example penicillin formation [1,2], methylenomycin syn-
thesis [3] and reduction of (growth on) nitrate [4,5], and
to decrease when the need for NADPH production is
decreased [6,7]. In cell-free enzyme systems the NADPH
is regenerated enzymatically or electrochemically [8], but
whole-cell systems are often the only available, more
stable and inexpensive enzyme source [9].
The availability of NADPH in whole-cell systems
might be increased by metabolic pathway engineering,
e.g. overproduction of enzymes in the PPP or deletion
of genes in glycolysis when a hexose is the carbon
source. NADPH is produced in two of the steps in the
PPP, namely the conversion of glucose 6-phosphate
(G6P) to 6-phosphoglucono-d-lactone (6PGdL), cata-
lysed by glucose 6-phosphate dehydrogenase (G6PDH;
EC 1.1.1.49), and conversion of 6-phosphogluconate
(6PG) to ribulose 5-phosphate (Ru5P) catalysed by
6-phosphogluconate dehydrogenase (6PGDH; EC
1.1.1.44) (Fig. 1). In the nonoxidative part of the PPP
two out of three reactions are catalysed by transketo-
lase (TKT; EC 2.2.1.1). Overproduction of these
enzymes might lead to increased flux through the PPP.
The level of NADPH has previously been increased in
Escherichia coli by overproduction of G6PDH or
6PGDH [10] and in Ralstonia eutropha by overproduc-
tion of G6PDH [11] or by overproduction of 6PGDH
or TKT [12].
Glucose 6-phosphate is a branching point to several
pathways. It leads to the pentose phosphate pathway,
glycolysis and the pathways for biosynthesis of cell
wall components. The Aspergillus niger gene encoding
G6PDH (gsdA) has been cloned, but transformation of
the fungus with this gene resulted in only low levels of
overproduction of G6PDH [13]. The authors suggested
that a high level of G6PDH overproduction might
result in a low lethal NADP ⁄ NADPH ratio in the cell
[13]. Therefore, in this study isolation of transformants
with a higher overproduction of G6PDH was attemp-
ted by a rescue on media giving a high oxidation rate
of NADPH to NADP.
In glycolysis the conversion of G6P to fructose
6-phosphate (F6P) is accomplished by phosphoglucose
isomerase (PGI). A disruption of the gene encoding
for PGI (pgiA) is likely to increase the flux through
the PPP, as this would force all conversion of G6P to
intermediates in glycolysis through the PPP (Fig. 1).
Canonaco and coworkers [14] had strong indications
that using this strategy in Escherichia coli increases
the NADPH concentration. We have tried a similar
approach and cloned the pgi gene (accession number
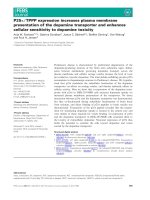
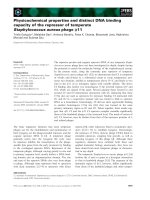
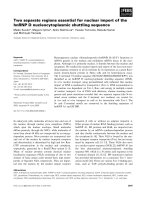
Fig. 1. Glycolysis, pentose phosphate pathway and polyol formation and degradation in Aspergilli. Partly after [50] and [51]. Enzymes in
boxes were subjected to metabolic engineering in this study. Metabolites and enzymes in italics were measured in wild-type and engineered
strains. Enzymes involved in polyol formation and degradation are probably regulated to prevent potential futile cycles. Two arrows in series
mean two or more reactions. E and I indicate extra- and intracellular polyols, respectively. Additional metabolite abbreviations: 6PGdL,
6-phosphoglucono-d-lactone; DHA, dihydroxyacetone; E4P, erythrose 4-phosphate; F1,6BP, fructose 1,6-bisphosphate; G3P, glycerol 3-phos-
phate; M1P, mannitol 1-phosphate; T6P, trehalose 6-phosphate. Additional enzyme abbreviations: DPP, dihydroxyacetone phosphate phos-
phatase; FPP, fructose 6-phosphate phosphatase; GPD, glycerol 3-phosphate dehydrogenase; GPP, glycerol 3-phosphate phosphatase; GLK,
glycerol kinase; HXK, hexokinase; MPP, mannitol 1-phosphate phosphatase; MTD, mannitol dehydrogenase; PFK, phosphofructokinase; RPI,
ribosephosphate isomerase; RPE, ribulosephosphate 3-epimerase; TPP, trehalose 6-phosphate phosphatase; TPS, trehalose 6-phosphate
synthase; TPI, triosephosphate isomerase.
Increased levels of NADPH in Aspergillus niger B. R. Poulsen et al.
1314 FEBS Journal 272 (2005) 1313–1325 ª 2005 FEBS
AJ551177) but we failed to obtain a disruptant,
although we analysed more than 120 transformants.
The aim of this study is to increase the availability
of NADPH for synthesis or bioconversions by over-
production of three enzymes in the PPP, G6PDH,
6PGDH and TKT. Wild-type and engineered strains
were characterized in detail in bioreactor cultures using
multivariate data analysis showing that overproduction
of 6PGDH resulted in increased NADPH levels.
Results
Cloning of the genes gndA, gsdA and tktA
To be able to manipulate the genes gndA, gsdA and
tktA encoding 6PGDH, G6PDH and TKT, respect-
ively, these genes were cloned by screening an A. niger
N400 genomic library in EMBL4 [15] by hybridization
with PCR products obtained by using the PCR oligos
in Table 1. Fragments obtained for these three genes
were a 5.3 kb EcoRI–SalI fragment (AJ551178, gndA
including 1.1 kb upstream and 2.1 kb downstream of
the gene), a 5.0 kb SalI–NsiI fragment (part of S78375
[13], gsdA including 1.1 kb upstream and 1.5 kb down-
stream of the gene) and a 3.8 kb EcoRI–ClaI fragment
(AJ550995, tktA including 0.7 kb upstream and 0.5 kb
downstream of the gene), which were cloned into
pBluescript resulting in the pIM445, pIM440 and
pIM448 plasmids, respectively.
The amino acid sequences of 6PGDH and TKT are
highly similar to previously published sequences from
other organisms. The highest similarities were with
6PGDH from Aspergillus oryzae (BAC06328, 94%
identity) and the TKT from Neurospora crassa
(CAC18218, 74% identity), respectively.
Both gndA and tktA contain an exceptionally long
first intron (estimated from alignments with sequences
of gnd and tkt genes of other organisms) of 407 and
267 bp, respectively, which is much longer than
generally observed in filamentous fungal genes [16].
Strikingly, this is also the case for the other PPP
enzyme-encoding gene gsdA [13] cloned so far, but
whether this is a general feature of all the PPP genes
of A. niger still remains to be shown.
Transformations of A. niger to obtain
overexpression of gndA, gsdA and tktA
With the purpose of overproducing the enzymes
6PGDH, G6PDH and TKT in separate strains, the
plasmids pIM445 (gndA), pIM440 (gsdA) and pIM448
(tktA) were used in cotransformations, which resulted
among others in the multicopy strains given in
Table 2.
After transformation with pIM445 (gndA) we iso-
lated 20 transformants of which approximately half
overproduced 6PGDH in the range from two- to
13-fold. This is a higher level of overproduction than
previously obtained in both Escherichia coli [10] and
R. eutropha [12] which was 1.7 and 3.8 times wild-type
activity, respectively. As shown in Fig. 2, the activity
did correlate both to the number of copies of the gndA
gene introduced (up to 20) and to the transcription
level. We chose the gndA multicopy strain Gnd20
(NW340, Table 2) with 20 introduced copies and a
6PGDH activity of 13 times wt activity for detailed
characterization.
Protoplasts transformed with pIM440 (gsdA) were
plated on minimal media with different carbon and
Table 2. A. niger strains used in this study.
Strain
Trivial
name Genotype
a
Reference for
characterized
mutation or strain
NW131 wt cspA1 goxC17 [33] [34]
NW129 cspA1 goxC17 pyrA6 [39]
NW342 Gnd5 cspA1 goxC17 [gndA]
5
This study
NW341 Gnd8 cspA1 goxC17 [gndA]
8
This study
NW340 Gnd20 cspA1 goxC17 [gndA]
20
This study
NW323 Gsd11 cspA1 goxC17 [gsdA]
11
This study
NW339 Tkt15 cspA1 goxC17 [tktA]
15
This study
a
Subscript is copy number estimated by Southern analysis.
Table 1. PCR oligos for probes and site-directed mutagenesis.
Oligo Position
a
Sequence Comments
gnd1 1617–1633 (Z46631) AARATGGTNCAYAAYGG Degenerate PCR on A. niger cDNA
gnd2 1867–1851 (Z46631) GTCCAYTTNCCNGTNCC
gsd-1 733–752 (S78375
b
) GCAGCTGGACAGCTTCTGCC Specific PCR on A. niger DNA
gsd-2 1603–1584 (S78375
b
) CGTTCTTGGGCTCAATGGCG
nctkt1 600–584 (NC4B12-T7
c
) GCCATTGATGCCGTCAA Specific PCR on N. crassa DNA
nctkt4 256–272 (NC4B12-T7
c
) CTGGAAAGCCCTGTTGA
a
Position in the accession number given.
b
From [13].
c
Putative Neurospora crassa transketolase EST sequence from http://biology.
unm.edu/
B. R. Poulsen et al. Increased levels of NADPH in Aspergillus niger
FEBS Journal 272 (2005) 1313–1325 ª 2005 FEBS 1315
nitrogen sources to obtain different rates of intracellu-
lar NADPH oxidation. Approximately half of 30
transformants isolated from each medium (120 in
total) overproduced G6PDH. However, the overpro-
duction did not differ significantly between the media
and was only up to three times wt activity. This result
is in agreement with previous attempts to overproduce
G6PDH in A. niger [13], E. coli [10] and R. eutropha
[11]. The rescue of transformants on media which led
to increased oxidation of NADPH therefore had no
influence on the G6PDH overproduction levels
obtained. However, whereas van den Broek and
coworkers [13] found only up to four introduced
copies of the gsdA gene, we found up to 40 introduced
copies, but the number of introduced copies did not
correlate with the degree of overproduction of the
enzyme. This was confirmed by transcript analysis
(Fig. 3), which showed very high transcription levels
compared to wild-type even for strains with few intro-
duced copies. We therefore concluded that the gsdA
gene product(s) must be subject to post-transcriptional
regulation, either at the mRNA or at the enzyme level.
We chose gsdA multicopy strain Gsd11 (NW323,
Table 2) with 11 introduced copies and a G6PDH
activity of three times wt activity for detailed charac-
terization.
After transformation of A. niger with pIM448 (tktA)
we isolated 20 transformants of which approximately
one third overproduced TKT, but we found only up to
two times wt activity. This level of overproduction is
comparable to that previously obtained in R. eutropha
[12], but in Saccharomyces cerevisiae [17] and
Corynebacterium glutamicum [18] overproduction of
up to 15 and 30 times wt activity, respectively, was
obtained. Southern analysis showed up to 15 intro-
duced copies and no apparent correlation with enzyme
activity, but the differences and the accuracies in
enzyme activity were too low to exclude this. In con-
trast to the high transcription level of the gndA and
gsdA multicopy strains, the transcription level of the
tktA multicopy strains was only slightly higher than
wild-type level (Fig. 3), which confirmed the low level
of overproduction of only twofold. One reason for
this could be that the 0.7 kb promotor of pIM448
is too short to obtain high level transcription. The
tktA multicopy strain Tkt15 (NW339, Table 2) with
15 extra (introduced) copies and a TKT activity of
two times wt activity was chosen for detailed charac-
terization.
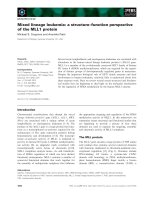
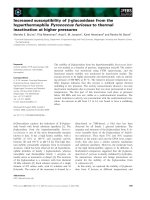
tktA
rpS28
10 110
10 40
1
G6PDH-
activity
ratio
TKT-
activity
ratio
3
wt
Gsd11
wt
Tkt15
12
gsdA
rpS28
Fig. 3. Transcript analysis of gsdA and tktA expression in multicopy
transformants. Probes were a 1.4 kb XhoI-NcoI fragment of gdsA
(S78375) and 2.1 kb SmaI-SphIoftktA (AJ550995), respectively.
The probe for the loading control was a 0.7 kb EcoRI-XhoI fragment
of ribosomal protein gene rpS28 [52]. The numbers in boxes indi-
cate the relative levels of gsdA and tktA transcripts corrected for
loading differences on basis of the rpS28 signals. Signals for wt
were set at 10. Bottom, G6PDH- and TKT-activities relative to wild-
type (wt G6PDH activity ¼ 1.0 UÆmg protein
)1
, wt TKT activity ¼
0.3 UÆmg protein
)1
).
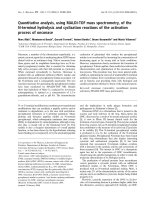
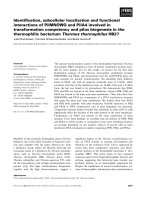
Fig. 2. Transcript analysis of gndA expression in multicopy trans-
formants. The probe was a 0.25 kb PCR product of oligos gnd1
and )2 (Table 1). Both 1 and 4 h exposures to film are shown
because of large differences in transcription level. The probe for
the loading control was a 0.7 kb EcoRI-XhoI fragment of ribosomal
protein gene rpS28 [52]. The high intensity on left side of wild-type
(wt) band is an artefact due to exposure from a strong neighbouring
band. Numbers in boxes indicate the relative levels of gndA tran-
scripts corrected for loading differences on basis of the rpS28 sig-
nal. Signals for wt were set at 10. Bottom, 6PGDH-activity relative
to wild-type (wt 6PGDH activity ¼ 0.4 UÆmg protein
)1
).
Increased levels of NADPH in Aspergillus niger B. R. Poulsen et al.
1316 FEBS Journal 272 (2005) 1313–1325 ª 2005 FEBS
Detailed characterization of wild-type and
overproducing strains
To determine physiological changes caused by overpro-
duction of G6PDH, TKT or 6PGDH, repeated batch
cultures were performed in computer controlle d bio-
reactors with the wild-type, Gsd11, Tkt15 and Gnd20
strains. Macro-morphology profiling (BR Poulsen,
AB Sørensen, T Schuleit, GJG Ruijter & J Visser,
unpublished results) showed that the cultures were with-
out large pellets containing a substrate diffusion-limited
centre and contained about 30% (dry biomass, DB)
pellets smaller than 0.3 mm diameter and 70% (dry
biomass) free hyphae. This mainly filamentous morpho-
logy was obtained only at low pH (here at pH 3). If the
pH was increased above 4.5, pellet fraction and size
increased resulting in diffusion-limited biomass in the
centre of large pellets (> 0.3 mm diameter).
The added titrants in the exponential growth phase
were NaOH and HCl in ammonium and nitrate cul-
tures, respectively, and they were added in quantities
equivalent to the amount of these nitrogen sources.
This can be explained by (a) only small quantities of
organic acid were produced during the exponential
phase, and (b) release of a proton upon the uptake of
an ammonium ion [19] and uptake of a proton upon
the uptake of a nitrate ion. The added titrant in the
stationary phase of both ammonium and nitrate cul-
tures was NaOH, which was caused by equivalent
quantities of organic acid produced [20].
Performing partial least square (PLS) regressions
For future metabolic engineering of strains with the
purpose of obtaining increased NADPH levels and for
the understanding of the regulation of the NADPH
level it is important to know which variables are corre-
lated with NADPH concentration. Because of the rel-
atively high number of variables obtained in this study
from analysis of samples from exponential (e) and sta-
tionary (s) phases not all correlations are obvious. One
statistical tool, which is suitable to find correlations
between multiple variables and at the same time to
make a regression in order to predict one or more vari-
ables, is a Partial least square (PLS) regression. In a
PLS regression the most important part of the vari-
ation in the X-variables for description of the Y-vari-
ables is found as one or more principal components
(PCs). Details of algorithms used in PLS regressions
are given in Martens and Næs [21], Ho
¨
skuldsson [22]
and Esbensen [23].
We performed PLS regressions to predict the
NADPH concentration (Y) from, and find correlations
with, the other measured variables (X). The vari-
ables G6PDH, 6PGDH, TKT, mannitol 1-phosphate
dehydrogenase (M1PDH; EC 1.1.1.17), sedoheptulose
7-phosphate (S7P), dihydroxyacetone phosphate
(DHAP), xylulose 5-phosphate (Xu5P), F6P, pyruvate
(PYR), ribose 5-phosphate (R5P), glyceraldehyde
3-phosphate (GAP), 6PG, NADP, NADPH, NADH,
erythritolI, arabitolI, mannitolI, arabitolE, trehaloseE,
oxalate and NADH (E, extracellular; I, intracellular)
were skewed and therefore preprocessed by log-trans-
formation. The rest of the variables [Aldolase (ALD;
EC 4.1.2.13), transaldolase (TAL; EC 2.2.1.2), PGI,
glycerol dehydrogenase (GLYDH; EC 1.1.1.156), G6P,
ADP, AMP, NAD, catabolic reduction charge (CRC),
glycerolI, trehaloseI, glycerolE, erythritolE and manni-
tolE] had a skewness between –l and 1 and were not
preprocessed. Citrate, DB and maximum specific
growth rate (l
max
,h
)1
) ⁄ induction of acid production
(IAP, h
)1
), were excluded from the regression, because
they are very different in the exponential and stationary
phases. ATP and energy charge were excluded because
for some of the samples from the cultures of overpro-
ducing strains the determination of ATP was not repro-
ducible. We found no explanation for this other than
that the turnover of ATP is very high. Ru5P was exclu-
ded, because of an incomplete dataset for this variable.
Anabolic reduction charge (ARC) was excluded because
it is calculated partly from the Y-variable (NADPH).
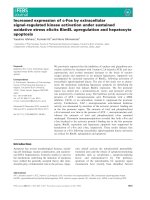
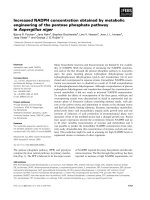
Figure 4 shows a PLS regression with both exponen-
tial phase (e) and stationary phase (s) samples from
ammonium (a) and nitrate (n) grown cultures after
excluding variables with only minor correlation with
NADPH [TAL, M1PDH, S7P, R5P, GAP, 6PG,
ADP, AMP, CRC, glycerolE, arabitolE, mannitolE
and citrate] from the prediction. Two PCs were chosen
since this gave a minimum in the Y-variance.
Figure 4A shows the scores on the two PCs of the
samples (from different strains and different condi-
tions). Figure 4B shows the X-loading weights of the
X-variables (measured variables other than NADPH)
and the Y-loading of NADPH on the two PCs. As
NADPH is in the first quadrant of Fig. 4B (the four
quadrants in a system of coordinates are ordered from
top right and numbered counterclockwise) all the vari-
ables in this quadrant are positively correlated to
NADPH in the two PCs. The variables in the third
quadrant are all negatively correlated to NADPH in
the two PCs. The variables in the fourth quadrant are
mainly positively correlated to NADPH, because they
are positively correlated in PC1 and negatively correla-
ted in PC2, and much more of the NADPH is
explained on PC1 (73%) than on PC2 (12%). For the
same reason the variables in the second quadrant are
B. R. Poulsen et al. Increased levels of NADPH in Aspergillus niger
FEBS Journal 272 (2005) 1313–1325 ª 2005 FEBS 1317
mainly negatively correlated to NADPH. Similarly, the
samples (Gnd) in the first quadrant of Fig. 4A have a
tendency to have a high NADPH level. However, the
position of the samples in Fig. 4A is influenced by
the level of all variables in these samples. For example,
the samples of the strains in the third quadrant of
Fig. 4A have a tendency to a high erythritolI level,
because this variable is in the third quadrant of
Fig. 4B. A total of 85% of NADPH is explained on
the basis of two principal components. The coefficient
of determination (r
2
) is 0.72, which confirms the corre-
lation, although it is not very precise. The root mean
square error of prediction, or average relative error in
prediction (RMSEP) is 0.046 lmolÆgDB
)1
(Fig. 4C),
which corresponds to about 20% of the NADPH con-
centration in Gnd20 in the exponential phase and is
satisfactory considering that the coefficient of variation
(CV ¼ standard deviation ⁄ average · 100%) of the
NADPH determination is about 30%.
Samples from exponential (e) and stationary (s)
phase form two separate groups in Fig. 4A. This is
expected, as identical conditions such as growth in
exponential phase have a tendency to result in the same
concentrations of variables. Similarly, the conditions
ammonium (a) and nitrate (n) have a tendency to form
separate groups. There is a tendency that the variation
in nitrogen source is on PC1; nitrate scores low on PC1
and ammonium scores high on PC1. Similarly, there is
a tendency that the variation in growth phase is on
PC2: exponential phase scores low on PC2 and station-
ary phase scores high on PC2. In addition, the strain
Gnd20 forms a group, although it is relatively scat-
tered, which indicates that this strain differs from the
other strains; the main differences being high 6PGDH
activity and NADPH concentration.
Without the intermediary metabolites a good corre-
lation was obtained when the samples from the sta-
tionary phase are also excluded (Fig. 5). A total of
96% of NADPH is explained by two PCs, the coeffi-
cient of determination (r
2
) is 0.76 and RMSEP is
0.067 lmolÆgDB
)1
, corresponding to about 30% of
the NADPH concentration in Gnd20 in exponential
phase and in the range of the CV of the NADPH
determination.
Discussion
Obvious tendencies found by characterization
of the wild-type
In the exponential phase of the ammonium cultures
all of the PPP enzyme activities were lower and the
NADPH concentration was higher than during other
Fig. 4. Prediction of NADPH using a partial least square (PLS)
regression with samples from exponential and stationary phase.
Variables with less correlation to NADPH were excluded (TAL,
M1PDH, S7P, R5P, GAP, 6PG, ADP, AMP, CRC, glycerolE, arabito-
lE and mannitolE). Gsd11, Tkt15 and Gnd20 are strains overproduc-
ing G6PDH, TKT and 6PGDH, respectively. a and n are cultures
with ammonium and nitrate, respectively, as final cell density limit-
ing substrate. e and s are exponential and stationary phase,
respectively. RMSEP is root mean square of error of prediction.
Two PCs were used. X explained, 40% on PC1 and 17% on PC2.
Y (NADPH) explained, 73% on PC1 and 12% on PC2. (A) Scores,
(B) X-loading weights and Y-loadings, (C) predicted vs. measured
NADPH.
Increased levels of NADPH in Aspergillus niger B. R. Poulsen et al.
1318 FEBS Journal 272 (2005) 1313–1325 ª 2005 FEBS
conditions. It is difficult to explain the higher PPP
enzyme activities in stationary phase, because in this
phase most of the carbon taken up is converted to
carbohydrate as storage compounds [20] (about 35%)
and to oxalate (about 20%) and only about 6% to
polyols. Of the products formed only polyol forma-
tion requires NADPH, and similar quantities of polyols
were formed in both the exponential and stationary
phases.
In the exponential phase of the nitrate cultures
high PPP enzyme activities and a low NADPH level
were probably caused by a high demand for
NADPH for the reduction of nitrate. It is possible
that the control mechanism for the high and low
PPP enzyme activities in the exponential phase of
the nitrate and ammonium cultures, respectively, is
the NADPH level as suggested by the results of
Witteveen et al. [24] and Hankinson [25]. During
growth on ammonium NADPH consumption is low
compared to growth on nitrate and therefore the
concentration of NADPH is high. This leads to the
down-regulation of PPP genes. Conversely, during
growth on nitrate NADPH consumption is high and
therefore the concentration of NADPH is low which
makes the up-regulation of PPP genes necessary.
Concentration of intermediary metabolites had a
general tendency to be higher in exponential phases
than in stationary phases. Whether this is a result of
growth or part of the regulation of growth is unknown
to us.
Obvious tendencies found by characterization
of overproducing strains
The 6PG level was generally increased in the Gsd11
strain and generally decreased in the Gnd20 strain.
This is expected, as 6PG is the product and the
substrate for the enzyme overproduced in Gsd11 and
Gnd20, respectively. Although NADPH is a product
of both enzymes it was only increased in the latter
strain (under all conditions). Also the concentration
of NADP and NAD had a tendency to be increased
in Gnd20, which might counterbalance the regulatory
effect of the high NADPH concentration. The lack of
a significant increase in NADH parallel to the
increase in NADPH indicates that there is no signifi-
cant transhydrogenase activity in A. niger under the
conditions used here, whereas this has been suggested
for citric acid-producing mycelia [26]. Overproduction
of 6PGDH resulted in an increase of synthesis of pyr-
idine nucleotide cofactors, as the total pool of these
increased. Whether the synthesis is regulated by the
NADPH concentration remains speculation. The
G6PDH overproducing strain has wild-type levels of
NADPH under the conditions applied for detailed
characterization, which contradicts the arguments
used previously [13] that high and lethal concentra-
tions of NADPH are the reason for only low over-
production of G6PDH found in A. niger. However,
the reason might be too low an NADP concentration,
because the concentration of this metabolite had a
tendency to decrease in the G6PDH overproducing
strain. Another reason for the lack of high G6PDH
overproduction might be that this results in high 6PG
inhibiting PGI [27] to a level incompatible with
growth. This would imply that the absence of PGI
activity is lethal, which would be consistent with
our results where we were not able to produce a pgi
disruptant.
Furthermore, it was found that the Tkt15 strain had
a tendency to show a higher level of acid production.
The reason for this is unknown, but one suggestion
could be that in this strain with increased transketolase
activity carbon is more efficiently converted from the
oxidative PPP via Ru5P to glycolysis in the form of
GAP and F6P, and thereby made available for acid
production.
Correlations with NADPH deduced from PLS
From Fig. 4B it is possible to deduce a number of cor-
relations with NADPH concentration. The correlations
with enzyme concentrations are interesting, because it
is possible to change these by genetic engineering.
Fig. 5. Prediction of NADPH using a partial least square (PLS)
regression with samples from exponential phase only and without
values of intermediary metabolites. Variables with less correlation
to NADPH were excluded (TAL, M1PDH, arabitolI, glycerolE and
arabitolE). Legends as in Fig. 4. Two PCs were used. X explained,
62% on PC1 and 19% on PC2. Y (NADPH) explained, 89% on PC1
and 7% on PC2.
B. R. Poulsen et al. Increased levels of NADPH in Aspergillus niger
FEBS Journal 272 (2005) 1313–1325 ª 2005 FEBS 1319
Firstly, the 6PGDH correlates with NADPH. Simi-
larly, the little success we had with increasing NADPH
by overproduction of G6PDH and TKT is confirmed
by a negative correlation between these enzymes and
NADPH. Also ALD, PGI and GLYDH are nega-
tively correlated to NADPH. However, this does not
necessarily imply that high expression of these enzymes
is irrelevant for high NADPH production. For
example, it is known that the flux through the PPP is
increased during growth on nitrate compared to growth
on ammonium [4,5] and we observed a two- to four-
fold increase in PPP enzyme levels, but a fivefold
decrease in NADPH concentration, probably because
NADPH is used for the reduction of nitrate. These
data apparently have a stronger influence on the
calibration of the PLS regression than the data from
the Gnd20 strain, in which the G6PDH activity and
NADPH concentration were generally increased.
Therefore the correlations shown in Fig. 4B should be
interpreted with caution taking into account the know-
ledge of, for example, the pathways shown in Fig. 1. A
PLS regression gives correlations but not the cause of
the correlations.
Surprisingly 6PG has no strong (negative) correla-
tion with NADPH although the concentration is
decreased three- to sevenfold under most conditions in
the Gnd20 strain. This may be caused by a three- to
sevenfold increase in 6PG and a slight tendency to an
increase in NADPH in the Gsd11 strain.
It is possible that PPP flux is increased in the Gnd20
strain and that a higher G6PDH activity is required
for this. Concentrations of polyols and intermediary
metabolites had a tendency to be increased in this
strain which could be caused by a higher NADPH
concentration and precursor production originating
from an increased flux through the PPP. It seems likely
that the increased NADPH and intermediary metabo-
lite levels caused an increased polyol formation. This is
probably the reason for the correlation between
NADPH, most intracellular polyols and intermediary
metabolites. Despite this, the total pool of polyols was
only increased significantly (doubled) in the stationary
phase of the nitrate cultures of the TKT and the
6PGDH overproducing strains.
Of the polyols only erythritol is negatively correlated
with NADPH and has a tendency to be low in the
6PGDH overproducing strain and under conditions
with high NADPH concentrations. Low erythrose
4-phosphate concentration might be the cause, but this
cannot be confirmed, as even in the wild-type it is too
low to be measured in A. niger [27]. Alternatively, the
formation of erythritol might use NADH as a cofactor
instead of NADPH. However, the cofactor is likely to
be NADPH in A. oryzae [28], but this has not been
investigated in A. niger.
The consumption of NADPH upon formation of
glycerol by GLYDH (Fig. 1) confirms the negative
correlation with this enzyme. This is a very interesting
observation as it indicates that a disruption or a
down-regulation of the gene encoding for GLYDH
might result in higher NADPH concentrations.
Applicability of PLS regression to other metabolic
engineered strains or mutants
The PLS regression in Fig. 4 shows quite well how
variables are correlated to NADPH. However, this
prediction of NADPH concentration requires measure-
ment of concentrations of intermediary metabolites
G6P, F6P, DHAP, NAD, NADP, PYR and Xu5P.
Because sampling for and extraction of intermediary
metabolites is quite tedious it would be a great advant-
age if these could be left out of the prediction. Also, as
NADPH is an intermediary metabolite itself one could
argue that if an extraction is necessary for the predic-
tion it has little value, as measurement of NADPH
concentration in the extract is relatively little work
compared to performing the extraction.
The prediction of NADPH in Fig. 5 is sufficiently
precise to be used for screening for a strain with eleva-
ted NADPH content. Extractions of enzymes and
intracellular polyols are relatively simple and they are
stable compounds compared to intermediary metabo-
lites. These extractions could therefore be automatized
to screen a large number of strains. In addition, all the
polyols can be measured by one injection on HPLC.
The PLS regression in Fig. 5 was calibrated with
samples from four strains having different PPP enzyme
concentrations and cultivated under two different con-
ditions (exponential phase in ammonium or nitrate
containing media), which should make it relatively
robust. In addition, the variables in these eight samples
were in most cases determined as averages of several
independent measurements. However, eight samples is
an insufficient number to avoid cross validation of the
regression, which means that the same samples are
used for calibration and validation of the regression.
Therefore, whether this calibration is generally applic-
able to a wide range of different genetically modified
strains still remains to be shown.
In our case, samples from the exponential phase were
shown to be the most important; a regression using only
the samples from the exponential phase was successful,
but a regression using only samples from the stationary
phase was not. The logarithm of slope plot [29] was
therefore an important tool, because it shows exactly
Increased levels of NADPH in Aspergillus niger B. R. Poulsen et al.
1320 FEBS Journal 272 (2005) 1313–1325 ª 2005 FEBS
when a culture grows exponentially. The extra- and
intracellular polyol concentrations are important for
the regression and it might be applicable to other fila-
mentous fungi, as they usually produce polyols. Enzyme
concentrations are also important for the prediction of
the NADPH concentration and other compounds than
polyols which require reduction of NADPH to NADP
upon formation may also be useful.
The main conclusion from this study is that
NADPH concentration was successfully increased by
overproducing 6PGDH (Figs 4C and 5). This is in
contrast with previous studies of A. niger where over-
production of citrate synthase [30], phosphofructo-
kinase and pyruvate kinase [31] showed no effect on
metabolism other than decreased levels of the activator
fructose 2,6-biphosphate and of ATP in the phospho-
fructokinase overproducing strain [32]. Although many
significant differences in enzyme and metabolite levels
were observed in the 6PGDH overproducing strain
compared to wild-type, overproduction had no signifi-
cant influence on overall physiology. For example,
specific growth rate and spore formation remained
unchanged, which is of great advantage when propaga-
ting the engineered fungal strains. This indicates that
A. niger has a relatively robust primary metabolism
which is in contrast to results obtained in E. coli
[10,14] and R. eutropha [11,12], where increased
NADPH levels as a result of metabolic engineering
had a negative effect on growth rate.
The increased NADPH concentration might result
in increased biotransformation rates of substrates that
require reducing equivalents. However, this still
remains to be shown by application of strains overpro-
ducing 6PGDH in NADPH-dependent processes.
Because overproduction of both G6PDH and TKT
also results in significant changes in concentrations of
intracellular metabolites it would be very interesting to
overproduce all three enzymes or combinations thereof
in the same strain.
Materials and methods
Strains and culture conditions
We used Aspergillus niger NW 131 (cspA1 goxC17) as the
wild-type (wt) strain, which is a glucose oxidase negative
strain [33] with short conidiophores [34]. All strains used
were derived from N400 (CBS 120.49) and are listed in
Table 2.
Unless stated otherwise, medium composition, plate cul-
tures and bioreactor cultures were as described previously
[29]. Shake flask cultures for preliminary characterization
(Southern analysis, transcript analysis and enzyme activity)
and screening of isolated transformants contained minimal
medium (MM) with 70 mm NaNO
3
as the nitrogen source
and 1% (w ⁄ v) glucose as the carbon source. Bioreactor cul-
tures for detailed characterization of strains contained MM
with 21 mm NH
4
Cl or NaNO
3
as the nitrogen source (final
cell density limiting substrate) and 5% (w ⁄ v) glucose as the
carbon source. Titrants for maintaining pH at 3 were 2 m
NaOH and 2 m HCl.
Molecular biology techniques
DNA manipulations were essentially as described by [35].
E. coli DH5a was used for propagation of plasmid DNA.
Unless stated otherwise the plasmid used was pBluescript
(SK+). Preliminary and control DNA sequencing were car-
ried out using a Ready Reaction Dye Deoxy Terminater
Cycle Sequencing kit (Perkin Elmer, Wellesley, MA) in an
Applied Biosystems automatic DNA sequencer model 310
(ABI Prism 310 Genetic Analyser, Perkin Elmer). tktA was
sequenced by ligating the gene into pUC19 and using
33
P-labelled ddNTPs (Amersham-Pharmacia, Piscataway,
NJ) by standard methods [35,36] covering all parts of the
sequence at least twice in each direction. gndA and pgiA were
sequenced using the BigDye sequencing kit and an ABI
Prism 310 capillary sequencer (Perkin-Elmer). A. niger DNA
was isolated as described in de Graaff et al. [37] and RNA
was isolated using TRIZOL (Life Technologies, Gaithers-
burg, MD).
Transformations of A. niger were performed essentially as
described by Kusters-van Someren et al. [38] using 2 · 10
7
protoplasts. Overexpressing strains were obtained by
cotransformation of the uridine requiring strain [39] NW129
(cspA1 goxC17 pyrA6) with 1 lg of the plasmid pGW635
containing the pyrA gene and 20 lg of a plasmid containing
the gene coding for the enzyme to be overproduced. After
transformation the protoplasts were plated on minimal med-
ium, which unless otherwise stated contained 0.95 m sucrose
as osmotic stabilizer and carbon source in addition to 70 mm
nitrate as nitrogen source. The protoplasts transformed with
pIM440 (gsdA, described above) were plated on minimal
media osmotically stabilized with sorbitol and with different
carbon and nitrogen sources to obtain different rates of intra-
cellular NADPH oxidation: 1% (w ⁄ v) glucose and 70 mm
ammonium, 1% (w ⁄ v) glucose and 70 mm nitrate, 1% (v ⁄ v)
dihydroxyacetone and 70 mm nitrate, and 1% (w ⁄ v) l-arabi-
nose and 70 mm nitrate, because NADPH is needed for
growth on nitrate, dihydroxyacetone and l-arabinose. Copy
number of genes introduced in transformants was estimated
by Southern analysis.
Sampling and analysis
Culture filtrate samples were obtained as described before
[20]. Mycelium samples were collected by filtration in a fun-
B. R. Poulsen et al. Increased levels of NADPH in Aspergillus niger
FEBS Journal 272 (2005) 1313–1325 ª 2005 FEBS 1321
nel with a sintered glass filter. After washing, the mat of
mycelium was frozen in liquid nitrogen. Dry biomass (DB)
samples were sampled directly into a measuring cylinder
and mycelium was washed twice on the sintered glass filter
by resuspension in distilled water, frozen in liquid nitrogen,
and stored at )20 °C. Samples for measurement of enzymes
were washed twice with 50 mm potassium phosphate buffer
(pH 7) on the sintered glass filter, frozen in liquid nitrogen,
and stored at )70 °C. Samples for measurement of intracel-
lular polyols were not washed since this can cause loss of
up to 60% of the intracellular (I) polyols [40]; mycelium
was frozen in liquid nitrogen, and stored at )70 °C. Samp-
ling for intermediary metabolites was done directly into a
methanol buffer at )40 °C to inactivate metabolism [41],
and samples were frozen in liquid nitrogen, and stored at
)70 °C.
Biochemicals were from Boehringer Mannheim (Man-
nheim, Germany), Roche (Basel, Switzerland) or Sigma
(St. Louis, MO). Glucose was determined either by glucose
test strips (Roche), by HPLC analysis or enzymatically
essentially as described by Bergmeyer [42]. Nitrate was
detected by nitrate ⁄ nitrite test strips (Merck). Glucose,
polyols and organic acids were determined by HPLC analy-
sis using a Dionex system (Dionex Corp., Sunnyvale, CA,
USA). Extracellular (E) concentrations were determined
after centrifuging culture filtrate samples to remove any
precipitate after freezing. Intracellular (I) polyols were
extracted from mycelium according to Witteveen et al. [40].
For glucose and polyols, an anion-exchange CarboPac
MA1 column (Dionex) was used. Elution was isocratic at
0.4 mLÆmin
)1
with 0.48 m NaOH and amperometric detec-
tion. For organic acids an Aminex ion exclusion HPX-87H
column (BioRad, Hercules, CA), thermostated at 50 °C was
used. Elution was isocratic at 0.5 mLÆmin
)1
with 25 mm
HCl and detection by refractive index and UV at 210 nm.
Extracellular polyols and acids were calculated as concen-
tration measured extracellularly (molÆL
)1
) divided by dry
biomass concentration (g DBÆL
)1
) to compensate for
slightly different times of sampling.
Dry biomass samples were lyophilized and weighed. Fro-
zen mycelium sampled for measurement of enzymes and for
isolation of DNA and RNA was precooled in liquid nitro-
gen and powdered in a precooled Teflon container with
a stainless steel ball using a Micro-Dismembrator II
(B. Braun, Melsungen, Germany). For measurement of
enzymes 0.1–0.4 g powderÆmL
)1
was suspended in extrac-
tion buffer containing 50 mm potassium phosphate
(pH 7.0), 0.5 mm EDTA, 5 mm MgCl
2
and 5 mm 2-merca-
ptoethanol at 0 °C. The suspension was mixed by pipetting
and the enzyme extract was obtained as the supernatant
after centrifugation at 40 000 g for 10 min. Enzyme assays
were based on measurement of NAD(P)H and performed
at 30 °C using a Cobas Bio autoanalyzer (Roche; absorb-
ance at 340 nm, e ¼ 6.22 mm
)1
Æcm
)1
). ALD, G6PDH, PGI
and M1PDH activities were determined as described by
Ruijter et al. [31]. GLYDH activity was determined as des-
cribed by de Vries et al. [43]. 6PGDH was determined as
described by Rippa and Signorini [44] with the modification
that EDTA was omitted. TAL activity was determined as
described in [45] with the modifications that the buffer
was 100 mm Pipes pH 7.6, the concentration of F6P was
increased to 3 mm and EDTA was omitted. The specific
TAL activity was found by subtraction of the M1PDH
activity. TKT activity was determined as described by Brui-
nenberg [45] with the modifications that the buffer was
50 mm Pipes pH 7.6, the concentration of R5P was doubled
to 4 m m and the reaction was started with Xu5P. Protein
concentration in enzyme extracts was determined after
denaturation and precipitation of protein with sodium
deoxycholate and trichloroacetic acid [46] using the BCA
method as described by the manufacturer (Sigma).
Extraction and determination of intermediary metabolites
were performed as described by Ruijter and Visser [41]. The
assays for G6P, F6P, PYR, ADP, AMP, NAD and ATP
were also as described by Ruijter and Visser [41]. The assay
for 6PG was the same as for G6P, except that G6PDH was
exchanged with 6PGDH. The assay for NADP was as des-
cribed by Klingenberg [47] with the modification that 50 mm
triethanolamine (pH 7.6) was used, G6P was 0.5 mm,
G6PDH was 1.4 UÆmL
)1
and 2.5 mm MgCl
2
was added
instead of MgSO
4
. The assay for NADH and NADPH was
as described by Klingenberg [47] with the modifications that
50 mm triethanolamine (pH 7.6) was used, 2-ketoglutarate
was 1.25 mm and instead of absorbance the fluorescence
was measured (k
excitation
¼ 340 nm and k
emission
¼ 460 nm,
F4500 Fluorescence Spectrophotometer, Hitachi, Tokyo,
Japan) to increase the sensitivity. G6P, F6P and S7P were
determined in a modified version of the assay developed by
Racker [48] in the presence of 25 mm glycylglycine (pH 7.4),
0.5 mm NADP and 0.2 mm GAP by addition of 0.3 UÆmL
)1
6PGDH, 0.3 UÆmL
)1
PGI and 0.3 UÆmL
)1
TAL, respect-
ively. DHAP, GAP, R5P and Ru5P were determined in a
modified version of the assay from [49]. Our assay was car-
ried out in the presence of 25 mm glycylglycine (pH 7.4),
6mm MgCl
2
, 2.4 mm thiamine pyrophosphate, 1 mm
NADH and 0.5 mm Xu5P by addition of 0.7 UÆmL
)1
glycerol 3-phosphate dehydrogenase, 40 UÆmL
)1
triosephos-
phate isomerase, 0.33 UÆmL
)1
TKT and 1 UÆmL
)1
ribose-
phosphate isomerase, respectively. DHAP, GAP and Xu5P
were determined in a similar assay by exchanging 0.5 mm
Xu5P with 0.5 mm R5P, whereby Xu5P is measured by the
addition of 0.33 UÆmL
)1
TKT and the addition of ribose-
phosphate isomerase is omitted.
Accumulated titrant added to maintain constant pH was
analyzed with natural logarithm of slope plots [29] to
ensure correct sampling time points (exponential growth
phase, e, and stationary phase, s) and to measure the maxi-
mum specific growth rate (l
max
,h
)1
) and the rate constant
of induction of acid production (IAP, h
)1
) in the postexpo-
nential phase. Samples from exponential growth phase (e)
Increased levels of NADPH in Aspergillus niger B. R. Poulsen et al.
1322 FEBS Journal 272 (2005) 1313–1325 ª 2005 FEBS
were taken 13–20 h after inoculation with spores, which
corresponds to 1–8 h before exhaustion of the final cell
density limiting substrate (ammonium or nitrate). Samples
from stationary phase (s) were taken 11–14 h after exhaus-
tion of the final cell density limiting substrate.
Partial least square (PLS) regressions (see Martens and
Næs [21], Ho
¨
skuldsson [22], Esbensen [23] for a general
introduction to PLS regression) were made with the stati-
stical software package for multivariate data analysis
unscrambler vs. 7.8 (CAMO Process AS, Oslo, Norway).
Because the number of samples (16) was relatively small,
full cross validation was applied. Skewed (asymmetric)
variables with a skewness higher than 1 or lower than )1
were preprocessed by a simple log-transformation (a ¼
log[a]), which reduced the absolute value of the skewness to
lower than 1. Variables were centralized (subtraction of
mean) and weighted (division with standard deviation) to
obtain a mean of zero and a standard deviation of 1 for all
variables. Variables with little correlation to the Y-variable
(low absolute values of X-loading weights) were excluded
from the PLS regression, because they contribute little to
the prediction but significantly to the error. Several PLS
regressions were performed with different X-variables with
low X-loading weights excluded to optimize the correlation
and minimize the error.
Acknowledgements
We thank Nawaf Abu-Khalaf and Kim H. Esbensen
for advice on the multivariate data analysis. We
acknowledge Henk Panneman and Patricia van Kuyk
for advice on molecular biology work, Peter van de
Vondervoort for expert technical help with transforma-
tions, and Tina Schuleit and Jasper Walther who parti-
cipated in analysis of transformants. This work was
financially supported by the Danish Research Agency,
The Siemens Foundation, Nucleic Acid Centre of the
Danish Grundforskningsfond, and The Plasmid Foun-
dation.
References
1 Henriksen CM, Christensen LH, Nielsen J & Villadsen
J (1996) Growth energetics and metabolic fluxes in con-
tinuous cultures of Penicillium chrysogenum. J Biotech-
nol 45, 149–164.
2 Jørgensen H, Nielsen J & Villadsen J (1995) Metabolic
flux distributions in Penicillium chrysogenum during fed-
batch cultivations. Biotechnol Bioeng 46, 117–131.
3 Obanye AIC, Hobbs G, Gardner DCJ & Oliver SG
(1996) Correlation between carbon flux through the
pentose phosphate pathway and production of the anti-
biotic methylenomycin in Streptomyces coelicolor A3
(2). Microbiology 142, 133–137.
4 Pedersen H, Carlsen M & Nielsen J (1999) Identification
of enzymes and quantification of metabolic fluxes in the
wild-type and in a recombinant Aspergillus oryzae
strain. Appl Environ Microbiol 65, 11–19.
5 Schmidt K, Marx A, de Graaf AA, Wiechert W, Sahm
H, Nielsen J & Villadsen J (1998)
13
C tracer experiments
and metabolite balancing for metabolic flux analysis:
comparing two approaches. Biotechnol Bioeng 58,
254–257.
6 Marx A, Eikmanns BJ, Sahm H, de Graaf AA &
Eggeling L (1999) Response of the central metabolism
in Corynebacterium glutamicum to the use of an
NADH-dependent glutamate dehydrogenase. Metab
Eng 1, 35–48.
7 dos Santos M, Thygesen G, Kotter P, Olsson L &
Nielsen J (2003) Aerobic physiology of redox-engineered
Saccharomyces cerevisiae strains modified in the ammo-
nium assimilation for increased NADPH availability.
FEMS Yeast Res 4, 59–68.
8 Li Z, van Beilen JB, Wouter AD, Schmid A, de Raadt
A, Griengl H & Witholt B (2002) Oxidative biotransfor-
mations using oxygenases. Curr Opin Chem Biol 6, 136–
144.
9 Lehman LR & Stewart JD (2001) Filamentous fungi:
potentially useful catalysts for the biohydroxylations of
non-activated carbon centers. Curr Org Chem 5, 439–470.
10 Lim SJ, Jung YM, Shin HY & Lee YH (2002) Amplifi-
cation of the NADPH-related genes zwf and gnd for the
oddball biosynthesis of PHB in an E. coli transformant
harboring a cloned phbCAB operon. J Biosci Bioeng 93,
543–549.
11 Choi JC, Shin HD & Lee YH (2003) Modulation of
3-hydroxyvalerate molar fraction in poly (3-hydroxy-
butyrate-3-hydroxyvalerate) using Ralstonia eutropha
transformant co-amplifying phbC and NADPH genera-
tion-related zwf genes. Enzyme Microbial Technol 32,
178–185.
12 Lee JN, Shin HD & Lee YH (2003) Metabolic engineer-
ing of pentose phosphate pathway in Ralstonia eutropha
for enhanced biosynthesis of poly-b-hydroxybutyrate.
Biotechnol Prog 19, 1444–1449.
13 Broek, P., Goosen, T., Wennekes, B. & van den Broek,
H. (1995) Isolation and characterization of the glucose-
6-phosphate dehydrogenase encoding gene (gsdA) from
Aspergillus niger. Mol General Genet 247, 229–239.
14 Canonaco F, Hess TA, Heri S, Wang T, Szyperski T &
Sauer U (2001) Metabolic flux response to phosphoglu-
cose isomerase knock-out in Escherichia coli and impact
of overexpression of the soluble transhydrogenase
UdhA. FEMS Microbiol Lett 204, 247–252.
15 Harmsen JAM, Kusters-van Someren MA & Visser J
(1990) Cloning and expression of a second Aspergillus
niger pectin lyase gene (pelA): indications of a pectin
lyase gene family in A. niger. Curr. Genet. 18, 161–166.
B. R. Poulsen et al. Increased levels of NADPH in Aspergillus niger
FEBS Journal 272 (2005) 1313–1325 ª 2005 FEBS 1323
16 Gurr SJ, Unkles SE & Kinghorn JR (1987) The struc-
ture and organization of nuclear genes of filamentous
fungi. In Gene structure in eukaryotic microbes (King-
horn JR, ed), pp. 93–139. IRL Press, Oxford.
17 Schaaff-Gerstenschla
¨
ger I, Miosga T & Zimmermann
FK (1994) Genetics of pentose-phosphate pathway
enzymes in Saccharomyces cerevisiae. Biores Technol 50,
59–64.
18 Ikeda M, Okamoto K & Katsumata R (1999) Cloning
of the transketolase gene and the effect of its dosage on
aromatic amino acid production in Corynebacterium
glutamicum. Appl Microbiol Biotechnol 51, 201–206.
19 Iversen JJL, Thomsen JK & Cox RP (1994) On-line
growth measurements in bioreactors by titrating meta-
bolic proton exchange. Appl Microbiol Biotechnol 42,
256–262.
20 Hrdlicka, PJ, Poulsen BR, Sørensen AB, Ruijter GJG,
Visser, J & Iversen J (2004) Characterization of neroli-
dol biotransformation based on indirect on-line estima-
tion of biomass concentration and physiological state in
batch cultures of Aspergillus niger. Biotechnol Prog 20,
368–376.
21 Martens H & Næs T (1989) Multivariate Calibration.
John Wiley and Sons Ltd, Chichester, UK.
22 Ho
¨
skuldsson A (1996) Prediction Methods in Science
and Technology, Vol. 1, Basic Theory. Thor Publishing,
Denmark.
23 Esbensen KH (2002) Multivariate Data Analysis in Prac-
tice, 5th edn. CAMO Process AS, Oslo.
24 Witteveen, CFB, Busink R, van de Vondervoort P,
Dijkema C, Swart K & Visser J (1989) l-arabinose and
d-xylose catabolism in Aspergillus niger. J General
Microbiol 135, 2163–2171.
25 Hankinson O (1974) Mutants of the pentose phosphate
pathway in Aspergillus nidulans. J Bacteriol 117, 1121–
1130.
26 Fu
¨
hrer L, Kubicek CP & Ro
¨
hr M (1980) Pyridine
nucleotide levels and ratios in Aspergillus niger. Can J
Microbiol 26, 405–408.
27 Ruijter GJG & Visser J (1999) Characterization of
Aspergillus niger phosphoglucose isomerase. Use for
quantitative determination of erythrose 4-phosphate.
Biochimie 81, 267–272.
28 Ruijter GJG, Visser J & Rinzema A (2004) Polyol
accumulation by Aspergillus oryzae at low water activity
in solid-state fermentation. Microbiology 150, 1095–1101.
29 Poulsen BR, Ruijter GJG, Visser J & Iversen JJL (2003)
Determination of first order rate constants by natural
logarithm of the slope plot exemplified by analysis of
Aspergillus niger in batch culture. Biotechnol Lett 25,
565–571.
30 Ruijter GJG, Panneman H, Xu D-B & Visser J (2000)
Properties of Aspergillus niger citrate synthase and
effects of citA overexpression on citric acid production.
FEMS Microbiol Lett 184, 35–40.
31 Ruijter GJG, Panneman H & Visser J (1997) Overex-
pression of phosphofructokinase and pyruvate kinase in
citric acid producing Aspergillus niger. Biochim Biophys
Acta 1334, 317–326.
32 Poulsen BR, Ruijter GJG, Panneman H, Iversen JJL &
Visser J (2004) Fast response filter module with plug
flow of filtrate for on-line sampling from submerged
cultures of filamentous fungi. Anal Chim Acta 510, 203–
212.
33 Swart K, Van der Vondervoort PJI, Witteveen CFB &
Visser J (1990) Genetic localization of a series of genes
affecting glucose oxidase levels in Aspergillus niger. Curr
Genet 18, 435–539.
34 Bos CJ, Debets AJM, Swart K, Huybers A, Kobus G &
Slakhorst SM (1988) Genetic analysis and the construc-
tion of master strains for assignment of genes to six link-
age groups in Aspergillus niger. Curr Genet 14, 437–443.
35 Sambrook J, Fritsch EF & Maniatis T. (1989) Molecu-
lar Cloning: a Laboratory Manual, 2nd edn. Cold Spring
Harbor Laboratory Press, Cold Spring Harbor, NY.
36 Sanger F, Nicklen S & Coulsen AR (1977) DNA squen-
cing with chain-terminating inhibitors. Proc Natl Acad
Sci USA 74, 5463–5467.
37 Graaff L, van den Broek H & Visser J (1988) Isolation
and expression of the Aspergillus nidulans pyruvate
kinase gene. Curr Genet 13, 315–321.
38 Kusters-van Someren MA, Harmsen JAM, Kester
HCM & Visser J (1991) Structure of the Aspergillus
niger pelA gene and its expression in Aspergillus niger
and Aspergillus nidulans. Curr Genet 20, 293–299.
39 Goosen T, Bloemheuvel G, Gysler C, de Bie DA, van den
Broek HWJ & Swart K (1987) Transformation of Asper-
gillus niger using the homologous orotidine-5¢-phosphate-
decarboxylase gene. Curr Genet 11, 499–503.
40 Witteveen, C.F.B., Weber, F., Busink, R. & Visser, J.
(1994) Isolation and characterization of two xylitol
dehydrogenases from Aspergillus niger. Microbiology
140, 1679–1685.
41 Ruijter GJG & Visser J (1996) Determination of inter-
mediary metabolites in Aspergillus niger. J Microbiol
Methods 25, 295–302.
42 Bergmeyer HU, Bernt E, Schmidt F & Stork H (1974)
Determination with hexokinase and glucose-6-phosphate
dehydrogenase. In Methods of Enzymatic Analysis
(Bergmeyer HU, ed), 2nd edn, Vol. 3, pp. 1196–1201.
Verlag Chemie, Weinheim.
43 Vries RP, Flitter SJ, Van de Vondervoort PJI, Chaver-
oche M-K, Fontaine T, Fillinger S, Ruijter GJG, d’Enf-
ert C & Visser J (2003) Glycerol dehydrogenase,
encoded by gldB is essential for osmotolerance in
Aspergillus nidulans. Mol Microbiol 49, 131–141.
44 Rippa M & Signorini M (1975) 6-phosphogluconate
dehydrogenase from Candida utilis.InMethods in
Enzymology (Wood WA, ed), Vol. 41, pp. 237–240.
Academic Press, New York.
Increased levels of NADPH in Aspergillus niger B. R. Poulsen et al.
1324 FEBS Journal 272 (2005) 1313–1325 ª 2005 FEBS
45 Bruinenberg PM, van Dijken JP & Scheffers WA (1983)
An enzymic analysis of NADPH production and con-
sumption in Candida utilis. J General Microbiol 129,
965–971.
46 Bensadoun A & Weinstein D (1976) Assay of proteins
in the presence of interfering materials. Anal Biochem
70, 241–250.
47 Klingenberg M (1985) End-point UV-methods. In Meth-
ods of Enzymatic Analysis (Bergmeyer HU, ed), 3rd edn,
Vol. 7, pp. 251–271. Verlag Chemie, Weinheim.
48 Racker, E. (1970) d-sedoheptulose-7-phosphat. In Metho-
den der Enzymatischen Analyse (Bergmeyer HU, ed), 2nd
edn, Vol. 2, pp. 1156–1159. Verlag Chemie, Weinheim.
49 Racker E (1984) d-ribulose 5-phosphate. In Methods
of Enzymatic Analysis (Bergmeyer HU, ed), 3rd edn,
Vol. 6, pp. 437–441. Verlag Chemie, Weinheim.
50 Witteveen CFB (1993) Gluconate formation and polyol
metabolism in Aspergillus niger. PhD Thesis, Wagenin-
gen Agricultural University, the Netherlands.
51 Ruijter GJG, Bax M, Patel H, Flitter SJ, Van de
Vondervoort PJI, de Vries RP, vanKuyk PA & Visser J
(2003) Mannitol is required for stress tolerance in Asper-
gillus niger conidiospores. Eukaryot Cell 2, 690–698.
52 Melchers WJG, Verweij PE, van den Hurk P, van
Belkum A, de Pauw BE, Hoogkamp-Korstanje JAA &
Meis JFGM (1994) General primer-mediated PCR for
detection of Aspergillus species. J Clin Microbiol 32,
1710–1717.
Supplementary material
The following material is available from http://www.
blackwellpublishing.com/products/journals/suppmat/EJB/
EJB4554/EJB4554sm.htm
Table S1. Table of variables measured in the cultures
for detailed characterization of wild-type and overpro-
ducing strains.
Figure S1. Residual variance of calibrated X and of
validated Y (NADPH) in PLS regression shown in
Fig. 4.
Figure S2. U vs. T scores on PC1 and on PC2 in PLS
regression shown in Fig. 4.
Figure S3. Scores and X-loading Weights and Y-loa-
dings in PLS regression shown in Fig. 5.
Figure S4. Residual variance of calibrated X and of
validated Y (NADPH) in PLS regression shown in
Fig. 5.
Figure S5. U vs. T scores on PC1 and on PC2 in PLS
regression shown in Fig. 5.
B. R. Poulsen et al. Increased levels of NADPH in Aspergillus niger
FEBS Journal 272 (2005) 1313–1325 ª 2005 FEBS 1325