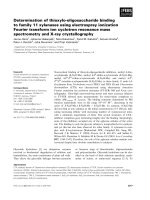
Báo cáo khoa học: Determination of thioxylo-oligosaccharide binding to family 11 xylanases using electrospray ionization Fourier transform ion cyclotron resonance mass spectrometry and X-ray crystallography pot
Bạn đang xem bản rút gọn của tài liệu. Xem và tải ngay bản đầy đủ của tài liệu tại đây (550.08 KB, 17 trang )
Determination of thioxylo-oligosaccharide binding
to family 11 xylanases using electrospray ionization
Fourier transform ion cyclotron resonance mass
spectrometry and X-ray crystallography
Janne Ja
¨
nis
1
, Johanna Hakanpa
¨
a
¨
1
, Nina Hakulinen
1
, Farid M. Ibatullin
2
, Antuan Hoxha
3
,
Peter J. Derrick
3
, Juha Rouvinen
1
and Pirjo Vainiotalo
1
1 Department of Chemistry, University of Joensuu, Finland
2 Biophysics Division, Petersburg Nuclear Physics Institute, Gatchina, Russia
3 Department of Chemistry, Mass Spectrometry Institute, University of Warwick, Coventry, UK
Glycoside hydrolases [1] are ubiquitous enzymes
involved in biochemical degradation of cellulose and
hemicellulose, the main constituents of plant cell walls.
They cleave the glycosidic linkages between pyranose
or furanose rings of disaccharides, oligosaccharides
and polysaccharides. Glycoside hydrolases can be clas-
sified on the basis of their substrate specificity, mech-
anism of action, or amino-acid sequence [2–5]. To
Keywords
Fourier transform ion cyclotron resonance
(FT-ICR); noncovalent binding; thioxylo-
oligosaccharides; X-ray crystallography;
xylanases
Correspondence
P. Vainiotalo, Department of Chemistry,
University of Joensuu, PO Box 111,
FI-80101 Joensuu, Finland
Fax: +358 13 2513360
Tel: +358 13 2513362
E-mail: pirjo.vainiotalo@joensuu.fi
(Received 4 January 2005, revised 1 March
2005, accepted 10 March 2005)
doi:10.1111/j.1742-4658.2005.04659.x
Noncovalent binding of thioxylo-oligosaccharide inhibitors, methyl 4-thio-
a-xylobioside (S-Xyl2-Me), methyl 4,4
II
-dithio-a-xylotrioside (S-Xyl3-Me),
methyl 4,4
II
,4
III
-trithio-a-xylotetroside (S-Xyl4-Me), and methyl 4,4
II
,
4
III
,4
IV
-tetrathio-a-xylopentoside (S-Xyl5-Me), to three family 11 endo-1,4-
b-xylanases from Trichoderma reesei (TRX I and TRX II) and Chaetomium
thermophilum (CTX) was characterized using electrospray ionization
Fourier transform ion cyclotron resonance (FT-ICR) MS and X-ray crys-
tallography. Ultra-high mass-resolving power and mass accuracy inherent
to FT-ICR allowed mass measurements for noncovalent complexes to
within |DM|
average
of 2 p.p.m. The binding constants determined by MS
titration experiments were in the range 10
4
)10
3
M
)1
, decreasing in the
series of S-Xyl5-Me ‡ S-Xyl4-Me > S-Xyl3-Me. In contrast, S-Xyl2-Me
did not bind to any xylanase at the initial concentration of 5–200 lm, indi-
cating increasing affinity with increasing number of xylopyranosyl units,
with a minimum requirement of three. The crystal structures of CTX–
inhibitor complexes gave interesting insights into the binding. Surprisingly,
none of the inhibitors occupied any of the aglycone subsites of the active
site. The binding to only the glycone subsites is nonproductive for catalysis,
and yet this has also been observed for other family 11 xylanases in com-
plex with b-d-xylotetraose [Wakarchuk WW, Campbell RL, Sung WL,
Davoodi J & Makoto Y (1994) Protein Sci 3, 465–475, and Sabini E,
Wilson KS, Danielsen S, Schu
¨
lein M & Davies GJ (2001) Acta Crystallogr
D57, 1344–1347]. Therefore, the role of the aglycone subsites remains con-
troversial despite their obvious contribution to catalysis.
Abbreviations
CTX, catalytic domain of Chaetomium thermophilum xylanase; ESI, electrospray ionization; FT-ICR, Fourier transform ion cyclotron
resonance; GlcNAc, N-acetyl-
D-glucosamine; Hex, hexose (Man ⁄ Gal); S-Xyl2-Me, methyl 4-thio-a-xylobioside; S-Xyl3-Me, methyl 4,4
II
-dithio-
a-xylotrioside; S-Xyl4-Me, methyl 4,4
II
,4
III
-trithio-a-xylotetroside; S-Xyl5-Me, methyl 4,4
II
,4
III
,4
IV
-tetrathio-a-xylopentoside; TRX I, Trichoderma
reesei xylanase I; TRX II, Trichoderma reesei xylanase II; Xyl2, b-
D-xylobiose; Xyl3, b-D-xylotriose; Xyl4, b-D-xylotetraose; Xyl5,
b-
D-xylopentaose; Xyl6, b-D-xylohexaose.
FEBS Journal 272 (2005) 2317–2333 ª 2005 FEBS 2317
date, the sequence-based classification of glycoside
hydrolases comprises more than 90 families, further
categorized into 14 clans displaying the same structural
folds and catalytic machinery [5,6].
Xylan is the most abundant hemicellulose compo-
nent in plant cell walls, mainly constituted of anhydro
b-1,4-d-xylopyranose backbone. Natural xylan usually
contains various substituents, such as 4-O-methyl-
a-1,2-d-glucuronic acid, a-1,2-d-glucuronic acid, a-1,3-
d-arabinofuranosyl, and 2-O ⁄ 3-O-acetyl, depending on
the botanical origin. Xylan accounts for 7–10% dry
weight of softwoods, 15–30% of hardwoods and up to
30% of annual graminaceous plants [7,8].
Endo-1,4-b-xylanases (EC 3.2.1.8) are O-glycoside
hydrolases that catalyze a random hydrolysis of inter-
nal b-1,4-glycosidic linkages of d-xylan by a double-
displacement mechanism, with a net retention of the
anomeric configuration [8,9]. The reaction proceeds
through a covalent intermediate with oxocarbenium
ion-like transition states, utilizing two conserved cata-
lytic glutamate residues, a nucleophile and an acid ⁄
base catalyst [10,11]. Xylanases have been generally
classified in the glycoside hydrolase families 10 and 11,
but recently xylanases associated with the families 5, 7,
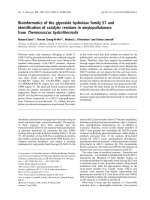
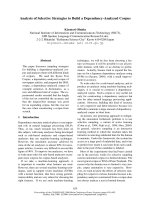
8 and 43 have also been reported [8,12–14]. Figure 1
shows the proposed reaction scheme for a family 11
xylanase. Xylanases have a number of industrially
important applications [15–21], such as roles in animal
feeding [16,17], pulp processing [18,19] and baking
[20,21]. In addition, their potential use in the biomass
conversion to liquid fuel (i.e. bioethanol) has gained
considerable interest [15].
X-ray crystallography [22] has been extensively used
to dissect catalytic mechanisms for glycoside hydro-
lases, particularly through the use of specific covalent
or noncovalent inhibitors [11,12,23]. Elegant experi-
mental approaches providing snapshots along an enzy-
matic reaction co-ordinate have been presented, in
which the crystal structures for each of the enzyme–
substrate (Michaelis), covalent intermediate and prod-
uct complexes have been determined and further kinet-
ically analyzed [24,25]. Both fluoro [24–32] and
epoxyalkyl [33–37] glycosides have been successfully
used to identify catalytic residues and gather informa-
tion on the reaction mechanisms, such as the itinerary
of the sugar ring conformations along the catalytic
pathway [24,25,29,30] or the inversion of the roles of
the catalytic glutamates [34]. Substrate derivatives with
a fluorine atom at the 2-O-position of the xylose or
glucose moiety (e.g. 2-deoxy-2-fluoroglycosides) slow
down the formation of the intermediates by inductively
destabilizing the oxocarbenium transition states and
eliminating an important hydrogen bond to the 2-O-
position [24]. Epoxyalkyl glycosides bind to the
enzymes by forming a covalent bond to the putative
nucleophile [34].
Fig. 1. Proposed reaction scheme for a reta-
ining family 11 xylanase, with b-
D-xylopenta-
ose as a model substrate. Putative glycone
(from )3to)1) and aglycone (+1 and +2)
subsites at the enzyme active site have
been numbered as described in [77]. The
reaction proceeds by a nucleophilic attack of
the catalytic glutamate on the anomeric car-
bon of the xylopyranoside ring (at the )1
subsite) to produce a covalent glycosyl–
enzyme intermediate via an oxocarbenium
ion-like transition state. At this point, the
first product (b-
D-xylobiose) is released. The
intermediate is then hydrolyzed via a second
transition state to give the second product
(b-
D-xylotriose) and the free enzyme. The
proposed conformations for the xylopyra-
nose ring in the )1 subsite have been
indicated.
Thioxylo-oligosaccharide binding to xylanases J. Ja
¨
nis et al.
2318 FEBS Journal 272 (2005) 2317–2333 ª 2005 FEBS
In recent years, many noncovalent glycosidase inhib-
itors, e.g. glyco-, xylo-, manno-, and galacto-configured
aza [38,39], imino [40–42] tetrahydropyridoazole ([23]
and references therein), and hydroximolactam [43]
sugar derivatives have been introduced. Imino-sugar
inhibitors, for instance, are potential transition state
mimics by virtue of the protonated nitrogen atom that
highly resembles the oxocarbenium ion-like transition-
state structure [12]. However, only a handful of the
above inhibitors possess considerable aglycone (i.e. the
subsites that bind the ‘aglycone’ leaving group portion
of the substrate; Fig. 1) specificity. However, inter-
actions of the substrate with the aglycone subsites play
an important role in transition-state stabilization along
the catalytic pathway [28]. Attention has been drawn
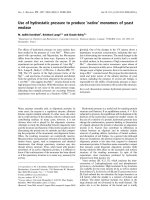
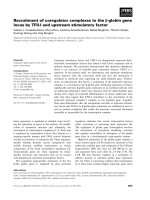
to thio-oligosaccharides (Fig. 2) as being promising
noncovalent inhibitor candidates for structural biology
studies among glycoside hydrolases [44–50]. Such
oligosaccharides, in which two or more carbohydrate
residues are incorporated via S-glycosidic linkage(s),
should conserve the global geometry of the natural
substrate while being hydrolytically inert [44]. In fact,
changes only occur at the glycosidic bond. The length
and angle for the S-glycosidic bond are 1.83 A
˚
and
97°, whereas the respective values for O-glycosides are
1.41 A
˚
and 117°, resulting in a difference of % 0.35 A
˚
between the adjacent sugar rings [49].
During the past 15 years, electrospray ionization
(ESI) MS [51] has become an increasingly important
analytical technique for the study of protein structure
and function. Of particular interest is the use of ESI-
MS in the studies of noncovalent interactions [52–54],
as valuable parameters such as stoichiometry and bind-
ing constants can be determined. A Fourier transform
ion cyclotron resonance (FT-ICR) MS [55,56] has
extended the possibilities of MS in protein analysis
because of its inherently ultra-high mass-resolving
power and mass accuracy. For instance, protein–ligand
[57], protein–carbohydrate [58,59], protein–peptide
[60], and protein–RNA [61] interactions have been
analyzed by ESI FT-ICR MS, providing valuable ther-
modynamic and kinetic data.
The filamentous fungus Trichoderma reesei is an effi-
cient xylanase producer, expressing at least four xylan-
ases, of which TRX I and TRX II are the most
characterized [62,63]. CTX is a thermostable xylanase
expressed from Chaetomium thermophilum, another
filamentous fungus [64]. TRX I, TRX II and CTX,
associated with family 11 of glycoside hydrolases, are
folded into a single domain (b-jelly roll) structure
comprising two parallel b-sheets and a single a-helix.
TRX II and CTX have been previously studied using
ESI FT-ICR [64–66]. The complex structures of
TRX II with covalently attached epoxyalkyl xylosides
have been obtained using X-ray crystallography [34–
37]. In this paper, we report the characterization of the
noncovalent binding of thioxylo-oligosaccharide inhibi-
tors to TRX I, TRX II and CTX using high-field ESI
FT-ICR MS and X-ray crystallography.
Results and Discussion
ESI FT-ICR analyses
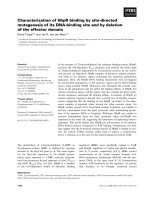
Figure 3 presents typical 9.4 T ESI FT-ICR mass spec-
tra of TRX I, TRX II and CTX in 10 mm ammonium
acetate buffer (pH 6.8). The resolving power of
% 150 000 (defined as m ⁄Dm
FWHM
, where m is the ion
mass and Dm
FWHM
is the peak full width at half-maxi-
mum) allowed isotopic distributions, a consequence of
the contributions of heavier isotopes (primarily
13
C
and
15
N), to be well resolved (Fig. 3B, inset). Each
peak represents an unresolved superimposition of sev-
eral isotopic compositions of the same nominal mass
(actually differing by a few mDa), except the first
peak, which represents the monoisotopic mass (i.e. all
hydrogens are
1
H, all carbons are
12
C, all nitrogens
are
14
N, etc.). However, the monoisotopic peak is
often undetectable for proteins > 10 kDa, except for
isotope-depleted proteins [67]. Hence, the molecular
masses reported hereafter refer to the masses calcula-
ted from the most abundant isotopic peaks (exp.) or
the sequence-derived, most abundant elemental compo-
sition of a protein (theor.). The charge state for the
species at a given mass-to-charge (m ⁄ z) ratio can be
readily assigned, as the spacing between the adjacent
isotopic peaks corresponds to a reciprocal of the
charge, i.e. z
)1
for the species [M + zH]
z+
, which then
allows the accurate mass to be unequivocally deter-
mined.
All proteins exhibited narrow charge state distribu-
tions of mainly four charge states, from 7+ to 10+,
Fig. 2. Structures of thioxylo-oligosaccharide inhibitors. From top to
bottom: S-Xyl5-Me, S-Xyl4-Me, S-Xyl3-Me, and S-Xyl2-Me.
J. Ja
¨
nis et al. Thioxylo-oligosaccharide binding to xylanases
FEBS Journal 272 (2005) 2317–2333 ª 2005 FEBS 2319
at m ⁄ z 2000–3500. We have previously shown that in
these conditions, TRX II exists in a single conforma-
tion which represents the native protein structure
[65,66]. On the basis of the mass spectra presented in
Fig. 3, all proteins had a variable degree of modifica-
tion. The first peaks at each charge state in the mass
spectrum of TRX I (Fig. 3A) represent the native
protein (19 046.920 ± 0.011 Da exp., 19 046.939 Da
theor.), and the second peaks are due to a mass incre-
ment of % 162 Da, consistent with the post-translation-
ally attached hexose (Hex, +162.053 Da), the form
(TRX I
Hex
) comprising less than 5%. The first peaks
in the mass spectrum of TRX II (Fig. 3B) represent
the native protein (20 824.823 ± 0.008 Da exp.,
20 824.850 Da theor.) with the N-terminal glutamine
existing in its cyclized pyrrolidonecarboxylic acid
()17.027 Da) form. The second peaks correspond to a
mass increment of % 203 Da, consistent with the previ-
ously observed N-glycosylation by a single N-acetyl-
d-glucosamine (GlcNAc, +203.076 Da; TRX II
GlcNAc
)
[65,66], comprising % 30% of the protein content.
Exactly the same modifications as in TRX II were
determined in CTX (Fig. 3C), although the glycosyl-
ated protein form (CTX
GlcNAc
) was the major form
(21 680.114 ± 0.021 Da exp., 21 680.289 Da theor.)
comprising % 90% of the total protein content. The
observed modifications of TRX II and CTX agree with
our earlier reports [64–66]. The mass data are summar-
ized in Table 1.
Close examination of the peaks at m ⁄ z 2900–3300 in
the ESI FT-ICR spectrum of TRX II (Fig. 3B) also
revealed the existence of noncovalent protein dimers.
The peak at m ⁄ z % 3200 represents [(TRX II)
2
+
13H]
13+
(41 649.665 ± 0.029 Da exp., 41 649.700 Da
theor.), whereas the peak at m ⁄ z % 2975 is a compos-
ite, in which [TRX II + 7H]
7+
and [(TRX II)
2
+
14H]
14+
are overlapping each other (Fig. 4). This
results in a superimposition of the two isotopic distri-
butions, one with the peak spacing of % 0.143 (z ¼ 7)
representing the monomer, and the other with % 0.071
(z ¼ 14) representing the dimer. Also, a heterodimer,
TRX II–TRX II
GlcNAc
, was observed at m ⁄ z % 2990
(14+) and % 3220 (13+). We have previously reported
noncovalent dimerization of TRX II upon heat-
induced conformational change [63]. Also, TRX I had
minor peaks in the mass spectra representing noncova-
lent dimer (Fig. 3A), but CTX did not dimerize under
any solution conditions, regardless of the close struc-
tural homology with TRX II. Although the only signi-
ficant difference between TRX II and CTX was the
extent of N-glycosylation, this would not explain the
absence of the dimeric form of CTX, as the hetero-
dimer was present in the case of TRX II.
Observation of noncovalent protein–inhibitor
complexes
The formation of noncovalent protein–inhibitor com-
plexes was readily observed by mixing appropriate
aliquots of xylanase and thio-oligosaccharide solutions
before direct analysis by MS. Figure 5 represents the
ESI FT-ICR mass spectra of 10 lm TRX II with
50 lm methyl 4,4
II
,4
III
,4
IV
-tetrathio-a-xylopentoside
(S-Xyl5-Me), 50 lm methyl 4,4
II
,4
III
-trithio-a-xylote-
troside (S-Xyl4-Me), and 50 lm methyl 4,4
II
-dithio-
a-xylotrioside (S-Xyl3-Me) in 10 mm ammonium
acetate buffer (pH 6.8). Comparison with the spectrum
in Fig. 3B reveals the presence of the noncovalent 1 : 1
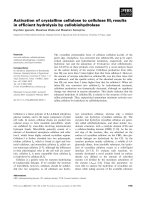
Fig. 3. 9.4 T ESI FT-ICR mass spectra of 5 lM TRX I (A), 10 lM
TRX II (B), and 10 lM CTX (C) in 10 mM ammonium acetate buffer
(pH 6.8). Numbers (n+) denote charge states. (B) The inset shows
the isotopic distribution for the charge state 9+, with white spheres
representing the theoretical abundance distribution. Glycosylated
protein forms (TRX I
Hex
, TRX II
GlcNAc
and CTX
GlcNAc
) at each charge
state have been denoted by # (see text for details).
Thioxylo-oligosaccharide binding to xylanases J. Ja
¨
nis et al.
2320 FEBS Journal 272 (2005) 2317–2333 ª 2005 FEBS
protein–inhibitor complexes on the basis of the new
peaks at the expected m ⁄ z values. The accurate mass
data for the complexes are summarized in Table 1.
However, no complexes could be detected for methyl
4-thio-a-xylobioside (S-Xyl2-Me), at the initial concen-
tration of 5–200 lm, suggesting no interaction or
the dissociation constant being a high millimolar
concentration, unreachable with our mass spectro-
meter. Similar results for the thio-oligosaccharide bind-
ing were observed for TRX I and CTX (Table 1). The
glycosylation in TRX II did not have any influence on
the binding as the same ratio of protein–inhibitor com-
plex ⁄ free protein was obtained at each charge state for
both the glycosylated and nonglycosylated protein
forms. The same was observed for CTX. Therefore,
the subsequent analyses for the calculation of binding
constants were made on the basis of the major pro-
tein forms only (i.e. nonglycosylated protein form rep-
resenting TRX II and glycosylated protein form
representing CTX).
In addition to equimolar complexes, 1 : 2 and 1 : 3
protein–inhibitor complexes were typically present with
higher initial inhibitor concentrations (Fig. 5). Com-
plexes with higher stoichiometric compositions are
probably due to nonspecific aggregation on the electro-
spray process [59]. On the basis of the crystal struc-
tures, TRX I, TRX II and CTX have each only a
single binding site. Therefore, the subsequent molecules
apparently bind to the protein surface by weak electro-
static forces, e.g. hydrogen bonds.
Determination of binding constants
MS titration experiments [68] were performed to deter-
mine binding constants for protein–inhibitor complexes
as explained in Experimental Procedures. The mass
spectra were first background subtracted. Assuming
that the observed protein ion intensities reflect the true
Table 1. The most abundant isotopic masses for TRX I, TRX II and CTX xylanases and their noncovalent thioxylo-oligosaccharide inhibitor
complexes. The data were obtained using 9.4 T ESI FT-ICR MS. n.b., No binding (the peaks at the expected m ⁄ z for any charge states of
the CTX–S-Xyl2-Me complex were not detected with [S-Xyl2-Me]
initial
¼ 5–200 lM).
Protein (modifications) Inhibitor M
exp
(Da)
a
M
theor
(Da)
b
DM (p.p.m.)
c
TRX I (none) None 19046.920 ± 0.011 19046.939 ) 1.0
S-Xyl2-Me n.b. 19359.026
S-Xyl3-Me 19508.080 ± 0.032 19508.048 + 1.6
S-Xyl4-Me 19656.081 ± 0.012 19656.067 + 0.7
S-Xyl5-Me 19804.091 ± 0.033 19804.087 + 0.2
TRX II (PCA) None 20824.823 ± 0.008 20824.850 ) 1.3
S-Xyl2-Me n.b. 21136.942
S-Xyl3-Me 21285.981 ± 0.037 21285.964 + 0.8
S-Xyl4-Me 21433.993 ± 0.022 21433.983 + 0.4
S-Xyl5-Me 21582.033 ± 0.034 21582.002 + 1.4
CTX (PCA, GlcNAc) None 21680.114 ± 0.021 21680.189 ) 3.5
S-Xyl2-Me n.b. 21993.279
S-Xyl3-Me 22141.411 ± 0.057 22141.298 + 5.1
S-Xyl4-Me 22289.412 ± 0.063 22289.317 + 4.3
S-Xyl5-Me 22437.463 ± 0.063 22437.336 + 5.7
a
Mean ± SD measured over the charge state distributions.
b
Calculated from the elemental composition of a protein and an inhibitor, inclu-
ding observed post-translational modifications.
c
Calculated from DM (p.p.m.) ¼ [(M
exp
–M
theor
) ⁄ M
exp
] · 10
6
.
Fig. 4. Expansion of the 9.4 T ESI FT-ICR mass spectrum of 10 lM
TRX II in 10 mM ammonium acetate (pH 6.8) at m ⁄ z 2920–3060
showing the group of peaks representing monomers (charge state
7+) and noncovalent dimers (charge state 14+) of TRX II and
its glycosylated form (TRX II
GlcNAc
). From left to right:
[TRX II + 7H]
7+
⁄ [(TRX II)
2
+ 14H]
14+
(the inset shows the superim-
posed isotopic distributions with the peak spacing of Dm ⁄ z ¼ 0.143
for the monomer and Dm ⁄ z ¼ 0.071 for the dimer),
[TRX II + TRX II
GlcNAc
+ 14H]
14+
(the inset shows isotopic distribu-
tion with Dm ⁄ z ¼ 0.071 for the dimer), and [TRX II
GlcNAc
+ 7H]
7+
(no inset).
J. Ja
¨
nis et al. Thioxylo-oligosaccharide binding to xylanases
FEBS Journal 272 (2005) 2317–2333 ª 2005 FEBS 2321
protein concentrations, one can readily calculate the
free and bound protein concentrations [68]. Conse-
quently, the free ligand concentration can also be
calculated. Previously it has been shown that different
charge states can represent different binding patterns,
reflecting different conformations [60]. The intensities
used for these calculations were therefore summed over
the charge state distributions. Moreover, in FT-ICR
the signal intensity (i.e. the induced image current)
increases linearly with the charge state [55]. Hence, the
data were charge-normalized by dividing the intensity
of each signal by the respective z. This should
reduce any bias introduced by a possible shift of
the charge state distribution caused by ligand binding.
The dimeric protein forms were disregarded in the
determination of binding constants because of their
low abundance and the fact that no peaks representing
dimers were actually observed at ligand concentrations
higher than 20 lm. The MS titration curves for
TRX I, TRX II and CTX are presented in Fig. 6. On
the basis of the data presented in Fig. 6, even at the
highest ligand concentrations the proteins were still far
from saturation, indicating relatively low binding con-
stants. The nonspecific binding was also observed in
the titration experiments; the relatively important two
and three ligand binding indicated that the nonspecific
binding constants were of the same order of magni-
tude.
For simplicity, we will consider here only the case of
a protein with a single specific binding site. As will be
explained in more detail in the next few paragraphs,
this situation corresponds well to TRX I, TRX II and
CTX xylanases. In such cases, the binding constant,
K
a
, can be expressed as
K
a
¼
½PL
½P½L
ð1Þ
in which [PL] is the concentration of the protein–lig-
and complex, and [P] and [L] are the concentrations of
the free protein and free ligand (i.e. inhibitor), respect-
ively [68]. Expressed in terms of r, defined as the num-
ber of ligands bound to one protein molecule, Eqn (1)
can be written as:
r ¼
n
a
K
a
½L
1 þ K
a
½L
ð2Þ
in which n
a
¼ 1. r⁄ [L] plotted vs. r is called the Scat-
chard plot and is a straight line with a slope of –K
a
.In
the case of nonspecific binding (in our case, PL
2
and
PL
3
complexes), the number of ligands bound to one
protein molecule is proportional to the concentration
of free ligand. Therefore, another term has to be
implemented in Eqn (2) giving:
r ¼
n
a
K
a
½L
1 þ K
a
½L
þðK
nsp
½LÞ
a
ð3Þ
in which K
nsp
is a binding constant for the nonspecific
protein–ligand complexes, with negative or positive
co-operativity (the coefficient a). MS measurements
readily provided the values of r as follows:
rð½L
initial
; ½P
initial
Þ¼
P
ðI
PL
þ 2I
PL
2
þ 3I
PL
3
Þ
P
ðI
P
þ I
PL
þ I
PL
2
þ I
PL
3
Þ
ð4Þ
in which I
P
and I
PLn
are the intensities of a free pro-
tein and different protein–ligand complexes summed
over the charge states and the isotopic distributions.
The free ligand concentration was then:
Fig. 5. 9.4 T ESI FT-ICR mass spectra of 10 lM TRX II with 50 lM
S-Xyl5-Me (A), 50 lM S-Xyl4-Me (B) and 50 lM S-Xyl3-Me (C) in
10 m
M ammonium acetate buffer (pH 6.8). Noncovalent protein–
inhibitor complexes are indicated. (A) The insets show the isotopic
distributions for [TRX II + S-Xyl5-Me + 9H]
9+
and [TRX II + (S-Xyl5-
Me)
2
+ 9H]
9+
. Only the 9+ charge states have been denoted for
clarity.
Thioxylo-oligosaccharide binding to xylanases J. Ja
¨
nis et al.
2322 FEBS Journal 272 (2005) 2317–2333 ª 2005 FEBS
½L¼½L
initial
À r½P
initial
ð5Þ
To obtain values for K
a
and K
nsp
, nonlinear curve
fittings based on the Levenberg–Marquardt algorithm
were performed using Microcal origin 6.1 (Origin
Laboratory Corp., Northampton, MA, USA). Briefly,
starting from the given set of parameters, the sum of
squared residuals of Eqn (3) from the experimental
data points was minimized by performing a series of
iterations. Figure 7 shows the binding isotherm, i.e. r
as a function of the free ligand concentration and the
fit to Eqn (3) (solid line), obtained in the case of
TRX I and S-Xyl5-Me. On the basis of the K
a
obtained, one can calculate the binding free energy
(for specific binding) at a given temperature from the
general expression D G
bind
¼ –RTlnK
a
. The K
a
, K
nsp
, a
values determined and DG
bind
values calculated are
presented in Table 2.
All of the thioxylo-oligosaccharide complexes had
specific binding constants (K
a
) within the range
10
3
)10
4
m
)1
, whereas the nonspecific binding constants
(K
nsp
) were % 10
2
)10
3
m
)1
(Table 2). The a values
were % 1 in most cases, suggesting no significant
co-operativity in the nonspecific binding. For both
TRX I and TRX II, a decreasing trend in the spe-
cific binding constants was observed as follows:
S-Xyl5-Me > S-Xyl4-Me > S-Xyl3-Me >>> S-Xyl2-Me.
For CTX, a similar trend, S-Xyl5-Me % S-Xyl4-Me>S-
Xyl3-Me >>> S-Xyl2-Me, was observed. In fact, none
Fig. 7. Binding isotherm for 5 lM TRX I with S-Xyl5-Me ([L]
initial
¼
0–100 l
M) at 293 K. For details of the calculations of r and [L], see
text and Eqns (1–5).
Fig. 6. MS titration curves for TRX I (5 lM), TRX II (10 lM) and CTX (10 lM) with S-Xyl5-Me, S-Xyl4-Me and S-Xyl3-Me (initial concentrations
of 0–100 l
M). [PL
n
] is the concentration for 1:n protein–inhibitor complex with n ¼ 1–3, calculated from the 9.4 T ESI FT-ICR intensity data.
[L] is the free inhibitor concentration.
J. Ja
¨
nis et al. Thioxylo-oligosaccharide binding to xylanases
FEBS Journal 272 (2005) 2317–2333 ª 2005 FEBS 2323
of the xylanases had detectable affinity for S-Xyl2-Me,
at the initial concentration of 5–200 lm. This may be
because the K
a
values for the S-Xyl2 complexes were
in the range 1–100 m
)1
, which is undetectable with our
instrument. These observations clearly show that the
ligand binding is highly influenced by the number of
xylopyranosyl units, with a minimum requirement of
three.
Protein crystallography
The final model of CTX contained 191 residues (on
the basis of the ESI FT-ICR data, CTX contained
196 amino-acid residues with an N-terminal pyrroli-
donecarboxylic acid and glycosylation by a single
GlcNAc; neither the last five C-terminal amino acids
nor the carbohydrate residue were visible in the crys-
tal structures of CTX or CTX–S-Xyl5-Me complex)
in both of the two molecules (A and B) of the
asymmetric unit, 450 water molecules, three sulfate
ions and two inhibitor molecules (S-Xyl5-Me) partly
attached to the active site (Fig. 8). In the electron-
density maps, three xylopyranose rings of the inhib-
itor molecules could be observed in the active site of
both molecules (Fig. 9). The xylopyranose rings, all
adopting a normal
4
C
1
ground-state conformation,
were observed only in the )1, )2 and )3 subsites
(for the nomenclature, see [69]), missing the point of
catalysis which occurs between subsites )1 and +1.
Additional densities were observed in the glycone
ends of the inhibitor chains in both molecules, but
no more xylopyranose rings could be unambiguously
fitted into those electron densities. In the active site
of molecule B, two of the rings, 1 and 2, were
packed between two tryptophan residues (Trp19 and
Trp80), with sugar ring 3 located just outside the
active-site, forming hydrogen bonds only with water
molecules. The hydrogen bonds formed between
CTX and S-Xyl5-Me are listed in Table 3 and sche-
matically represented for molecule B in Fig. 9C.
Similar results were obtained for other inhibitors
(data not presented), except for S-Xyl2-Me. When
crystals were soaked in the solution containing S-Xyl2-
Me and further in 2-methyl-2,4-pentanediol before
measurement at 120 K, no electron density caused by
the inhibitor was detected. However, some residual
density was observed, consistent with 2-methyl-2,4-
Table 2. Thermodynamic parameters for thioxylo-oligosaccharide
inhibitor binding to TRX I, TRX II, and CTX xylanases. The data
were obtained in 10 m
M ammonium acetate (pH 6.8) at 293 K
using 9.4 T ESI FT-ICR MS. n.b., No binding (the peaks at the
expected m ⁄ z for any charge state of CTX–S-Xyl2-Me complex
were not detected within [S-Xyl2-Me]
initial
¼ 5–200 lM).
Protein Inhibitor
K
a
· 10
)3
(M
)1
)
DG
bind
(kJÆmol
)1
)
K
nsp
· 10
)3
(M
)1
)
a
a
TRX I S-Xyl2-Me n.b.
S-Xyl3-Me 1.4 ± 0.2 )17.7 n.d.
b
1.0
S-Xyl4-Me 4.5 ± 0.5 )20.5 0.84 1.1
S-Xyl5-Me 11.0 ± 0.7 )22.7 0.55 1.0
TRX II S-Xyl2-Me n.b.
S-Xyl3-Me 2.5 ± 0.5 )19.1 0.54 1.0
S-Xyl4-Me 7.0 ± 0.9 )21.6 0.71 1.0
S-Xyl5-Me 9.1 ± 0.2 )22.2 1.6 1.0
CTX S-Xyl2-Me n.b.
S-Xyl3-Me 2.2 ± 0.3 )18.8 0.64 1.0
S-Xyl4-Me 12.0 ± 1.1 )22.9 0.92 1.0
S-Xyl5-Me 10.9 ± 0.9 )22.7 0.92 1.1
a
The fitting procedure did not provide error for K
nsp
probably
because of several minima reached on replicate runs.
b
Too low to
be accurately determined.
Fig. 8. Cartoon representation (A) and surface representation (B) of
the crystal structure of CTX with S-Xyl5-Me. The observed part of
the inhibitor (three xylopyranose rings) is shown at the active site.
Carbon atoms of the inhibitor are coloured in purple, oxygen atoms
in red, and sulfur atoms in orange. The figure was created with
PYMOL [86].
Thioxylo-oligosaccharide binding to xylanases J. Ja
¨
nis et al.
2324 FEBS Journal 272 (2005) 2317–2333 ª 2005 FEBS
pentanediol bound to the active site. On the other
hand the electron density for S-Xyl2-Me was actually
detected in subsites )1 and )2 when the measurements
were performed at room temperature. This suggests
that the cryo-protectant replaces the bound inhibitor
before the cryogenic measurement, which is consistent
with the observations of low binding affinity by MS.
The overall conformations of molecules A and B
were quite alike (rmsd ¼ 0.85 A
˚
for 1495 atoms).
However, both molecules in the asymmetric unit
contained several residues with signs of multiple
conformations. Most of these residues were located
on the surface of the enzyme, and only residues
TyrB74 and GluB178 were fitted into two conforma-
tions in the final model, as these conformations are
relevant to ligand binding. In addition, molecule B
contained a loop region (residues 162–167) that was
slightly disordered. In the disordered region, the
main chain of the protein was intact, but clear signs
of peptide flipping and several side-chain conforma-
tions could be seen, and fitting of the residues to
the electron density was challenging.
The main differences were the two conformations
of the catalytic glutamate, Glu178, in molecule B but
not in molecule A and the disordered loop region in
molecule B that was unambiguous in molecule A.
Glu178 has one unambiguous conformation in mole-
cule A, where it points towards the other catalytic
glutamate, Glu87. This conformation is also present
in molecule B together with another conformation, in
which Glu178 is bent away from the inhibitor mole-
cule. Movement of Glu178 forces the tyrosine resi-
due, Tyr74, to adopt another conformation in
molecule B. The single position of Tyr74 in molecule
A is an intermediate of the two conformations found
in molecule B.
Fig. 9. Final 2F
o
-F
c
electron density map of the active site of CTX
in molecule A (top) and molecule B (middle). Contour level is 1.0 r.
Water molecules are depicted as red spheres. The figure was cre-
ated with
PYMOL [86]. Schematic representation of the interactions
of CTX with S-Xyl5-Me inhibitor (in molecule B) is shown at the
bottom.
Table 3. Hydrogen bonds formed between CTX xylanase and
S-Xyl5-Me inhibitor.
Inhibitor atom
a
⁄
side chain hydroxy group Residue ⁄ water Distance (A
˚
)
A1 ⁄ 1-O
b
Glu178 OE2 3.08
A1 ⁄ 1-O HOH440 2.60
A1 ⁄ 2-O HOH438 2.55
A1 ⁄ 3-O HOH441 2.52
A2 ⁄ 2-O Tyr78 OH 2.86
A2 ⁄ 2-O Tyr172 OH 3.00
A2 ⁄ 3-O Tyr172 OH 2.70
A2 ⁄ 3-O HOH1 2.53
A3 ⁄ 2-O HOH450 2.58
A3 ⁄ 2-O HOH357 2.66
A3 ⁄ 3-O HOH450 2.86
B1 ⁄ 1-O Glu178 OE1 2.94
B1 ⁄ 1-O HOH192 2.61
B1 ⁄ 3-O HOH436 2.68
B2 ⁄ 2-O Tyr78 OH 2.74
B2 ⁄ 2-O Tyr172 OH 3.09
B2 ⁄ 3-O Tyr172 OH 2.73
B2 ⁄ 3-O HOH6 2.58
B3 ⁄ 2-O HOH145 3.01
B3 ⁄ 3-O HOH372 2.91
a
A and B refer to the corresponding molecules in the asymmetric
unit, and numbers refer to the xylopyranose rings at the corres-
ponding glycone subsites, )1, )2and)3.
b
Side-chain methoxy
group at 1-O-position.
J. Ja
¨
nis et al. Thioxylo-oligosaccharide binding to xylanases
FEBS Journal 272 (2005) 2317–2333 ª 2005 FEBS 2325
A few differences were observed when comparing
the CTX–S-Xyl5-Me complex with the native structure
of CTX. The space group and cell dimensions in the
complex structure were the same as for the native pro-
tein, and the native structure also contained two mole-
cules in the asymmetric unit. In molecule B, the
catalytic glutamate of the native protein adopted a sin-
gle conformation, the one described as bent away from
the inhibitor in the complex structure. An arginine
residue, Arg105, on the surface of the native protein
was in a more extended conformation in the native
protein compared with the CTX–S-Xyl5-Me complex
in both A and B molecules. This is probably due to
the packing of the molecules, as Arg105 bends away to
make space for the inhibitor molecule of the adjacent
enzyme molecule.
Evaluation of inhibitor binding and implications
for catalysis
Ultra-high mass-resolving power and high mass accu-
racy inherent to FT-ICR, as demonstrated here,
allowed unequivocal identification of the different pro-
tein forms as well as noncovalent protein complexes.
The binding constants for thioxylo-oligosaccharides
were determined using ‘classical’ titration experiments.
Such analyses are feasible using ESI-MS intensity data
to represent the thermodynamic equilibrium of free
protein and protein–ligand complexes in solution [68].
However, nonspecific protein–carbohydrate complexes,
which can be even energetically preferred in the gas
phase [70], often arise during the electrospray process.
A large amount of nonspecific binding complicates the
analysis because of its indefinable manner. Here, we
distinguished between these two types of binding from
the crystal structures, given that only a single binding
site exists in each xylanase, capable of occupying only
one inhibitor molecule. An equimolar titration,
recently described for the determination of protein–
carbohydrate association constants [59], might have
been a better approach as it diminishes the extent of
nonspecific binding.
Unfortunately, there are no other reports on the
binding of xylo-oligosaccharides or thioxylo-oligosac-
charides to family 11 xylanases for which the binding
constants had been determined. However, some com-
parison can be on the basis of xylo-oligosaccharide-
binding thermodynamics reported for isolated
carbohydrate-binding domains from Clostridum ther-
mocellum Xyn10B (X6b domain, family 10 [71]) and
Pseudomonas cellulosa Xyn10C (CBM15 domain,
family 15 [72]) xylanases, which display a similar
b-jelly roll fold, characteristic of family 11 xylanases.
The affinity for xylo-oligosaccharide binding deter-
mined using isothermal titration calorimetry of both
domains decreased in the series b-d-xylohexaose
(Xyl6) > b-d-xylopentaose (Xyl5) > b-d-xylotetraose
(Xyl4) > b-d-xylotriose (Xyl3), with no detectable
affinity for b-d-xylobiose (Xyl2), which is consistent
with our results. However, absolute affinity values for
X6b were % 10-fold higher than the values for CBM15
and the values reported here. A similar trend was seen
in the Michaelis constants (K
M
) for Penicillium simplic-
issium xylanase from family 10 vs. the length of the
oligosaccharide (K
M
¼ 1.4, 3.1, 5.1 and 7.9 mm for
Xyl6, Xyl5, Xyl4, and Xyl3, respectively), with no
hydrolysis occurring in the case of Xyl2 [73].
On the basis of the results, it remains controversial
why such a correlation between the number of xylo-
pyranose rings and the binding constants was observed
for the thio-oligosaccharides given that none of the
sugar rings occupied any of the aglycone subsites. The
electron densities for three sugar rings were observed
only in the )1, )2 and )3 subsites. Yet, the same has
previously been observed with catalytically incompet-
ent Bacillus circulans E172C [74] and Bacillus agarad-
haerens E94A [75] mutant xylanases in complex with
Xyl4. In the case of B. circulans xylanase, only two
carbohydrate residues were unequivocally fitted into
the electron densities. The authors suggested that
either the enzyme had a small amount of residual
activity (i.e. being able to hydrolyze Xyl4), which
sounds questionable from the mechanistic point of
view (E172C mutation) and in view of the K
M
and k
cat
values reported in the same paper, or that the enzyme
requires a larger substrate for tight binding. In CTX,
the main contribution to the binding in the glycone
subsites together with multiple hydrogen bonds
(Table 3) is apparently the hydrophobic interactions of
the proximal sugar ring (A2, B2) with the conserved
active-site tryptophan residue (Trp19) (Fig. 8C). There
were no clear electron densities for the sugar rings
A4 ⁄ B4 and A5 ⁄ B5 (some partial disordered density
was, in fact, visible for the sugar ring B4 outside of
the active site). However, the third sugar ring (A3 ⁄ B3)
makes hydrogen bonds only to the adjacent water
molecules, with no direct contacts to the protein
(Fig. 9C), the same as with B. agaradhaerens E94A
xylanase [75]. Therefore, the major contributions to the
binding in the glycone side must come from the interac-
tions within the subsites )1 and )2. However, the ther-
modynamic data suggest that, although the importance
of the glycone subsites in substrate binding is more
evident, some affinity must remain in the aglycone sub-
sites to explain the results. In fact, the results could be
easily interpreted in view of the proposed model for
Thioxylo-oligosaccharide binding to xylanases J. Ja
¨
nis et al.
2326 FEBS Journal 272 (2005) 2317–2333 ª 2005 FEBS
xylo-oligosaccharide binding to TRX II [63] in which,
at least five putative subsites, from )2 to +3, could be
modeled. As there is no reported crystal structure in
which xylo-oligosaccharides would completely traverse
the active site for any family 11 xylanase, the experi-
mental verification for the +1, +2 and +3 subsites
remains controversial.
For family 11 xylanases, it has been demonstrated
that catalysis is performed via a covalent reaction inter-
mediate adopting an unusual
2,5
B (boat) conformation
[29,30,75], in constrast with the
4
C
1
(chair) conforma-
tion observed for other b-glycosidases. The distortion of
the xylopyranose ring from its ground-state conforma-
tion at the point of cleavage (i.e. in the )1 subsite) plays
an important role in the catalytic mechanism utilized
by glycoside hydrolases. As the
2,5
B conformation
also fulfills the stereochemical constraints for the
oxocarbenium-ion-like transition states (sp
2
-hybridized
C1 coplanar with C5, O1 and C2), catalysis in family 11
members probably takes a
4
C
1
fi
2
H
3
fi
2
S
0
fi
2,5
B
route [75]. For family 10, a
4
C
1
fi
1
S
3
fi
4
H
3
fi
4
C
1
itinerary has been proposed instead [25] (C, H, S and B
refer to chair, half-chair, skew-boat and boat conforma-
tions, respectively, and numbers denote the orientations
of the respective ring atoms from the reference plane
[87]). However, in our case all of the detected xylo-
pyranosides adopted a low-energy
4
C
1
conformation,
including the one occupying the )1 subsite. In the crys-
tal structures reported for barley b-d-glucan gluco-
hydrolase in complex with 4,4
III
,4
V
-trithiocellohexaose
[48] and B. agaradhaerens endoglucanase Cel5A in com-
plex with methyl 4,4
II
,4
III
,4
IV
-tetrathio-a-cellopentoside
[49], all xylopyranose rings also adopted a
4
C
1
confor-
mation. In contrast, Fusarium oxysporum endoglucanase
Cel7A in complex with the same inhibitor as with Cel5A
revealed a considerable distortion towards the
1,4
B
(‘sofa’) conformation [45], displaying a preferred quasi-
axial orientation for the leaving group. In addition, an
unusual
2
S
0
conformation has also been reported for
Humicola insolens cellobiohydrolase Cel6A in complex
with methyl cellobiosyl-4-thio-b-cellobioside [46,50].
Distorted Michaelis complexes of retaining glycoside
hydrolases are believed to reflect the incipient transition-
state conformations [25,50,75]. However, a large vari-
ation among the different conformations obtained for
Michaelis complexes of different glycoside hydrolases
suggests that it may be difficult to assess whether the
observed conformation is catalytically relevant [50].
As there was no observable distortion from the
4
C
1
ground-state conformation, we looked for any geo-
metric constraints arising from S-glycosidic bonds. In
fact, the crystal structure of CTX–S-Xyl5-Me super-
imposed with B. agaradhaerens E94A xylanase in
complex with Xyl4 shows that there are significant
differences in the locations of the xylopyranose rings
at the active site (Fig. 10). The xylopyranose rings in
the )2 subsite are almost superimposable, whereas
the other two observed rings for S-Xyl5-Me in the )1
and )3 subsites display considerable movement com-
pared with Xyl4. This results in 5.80 A
˚
in molecule A
and 3.78 A
˚
in molecule B between the nucleophile
(Glu87 OE2) and the anomeric carbon (C1). This
may partly explain the nonproductive binding of
thioxylo-oligosaccharide inhibitors to CTX without
distortion to the expected
2,5
B conformation [75].
Experimental procedures
Protein expression and purification
Native, DNA-encoded TRX I and TRX II xylanases
(Swiss-Prot accession codes P36218 and P36217, respect-
ively), originally obtained from Cultor Ltd, were pro-
duced in a T. reesei Rut-C30 mutant strain and purified
as previously reported [61]. TRX II is now commercially
available from Hampton Research (Hampton Research,
Aliso Viejo, CA, USA). The catalytic domain of the
recombinant CTX xylanase (GenBank accession code
AJ508931) expressed from T. reesei (hereafter referred to
as CTX) was kindly provided by O. Turunen (Helsinki
University of Technology, Helsinki, Finland). CTX was
initially purified using cation-exchange and hydrophobic-
interaction chromatography and characterized by SDS ⁄
PAGE and ESI FT-ICR analyses as described previously
in detail [64]. Further purification of the protein solutions
for MS analyses is described in Sample preparation,
below.
Fig. 10. Superposition of the crystal structures of CTX in complex
with S-Xyl5-Me (in purple) and B. agaradhaerens xylanase in com-
plex with Xyl4 (in blue). The PDB codes are 1XNK and 1H4H,
respectively. Superpositioning was performed with
O [73], and the
figure was created with
PYMOL [86].
J. Ja
¨
nis et al. Thioxylo-oligosaccharide binding to xylanases
FEBS Journal 272 (2005) 2317–2333 ª 2005 FEBS 2327
Thioxylo-oligosaccharides
S-Xyl2-Me, S-Xyl3-Me, S-Xyl4-Me, and S-Xyl5-Me (Fig. 2)
were produced by stereoselective synthesis from S-glycosyl
isothiourea precursors and characterized using elemental
analysis and
1
H ⁄
13
C NMR spectroscopy. Experimental
synthesis and purification protocols have been reported
elsewhere in detail [76,77]. Several precursors were also
characterized using ESI FT-ICR MS [77]. The stock
solutions were prepared from thioxylo-oligosaccharides by
accurately weighing and dissolving in ultra-pure water (Elga
LabWater, High Wycombe, Bucks, UK) to a final concen-
tration of 1–10 mm.
Sample preparation
All chemicals, typically the highest HPLC grade, were
purchased from Sigma-Aldrich (Gillingham, Dorset, UK).
Protein stock solutions were first desalted over a PD-10 col-
umn (Amersham Biosciences Ltd, Amersham, Bucks, UK)
previously equilibrated with 10 mm ammonium acetate
(pH 6.8). Protein-containing fractions were concentrated
using Millipore Ultrafree (5 kDa cut-off) centrifugal filter
devices (Millipore, Bedford, MA, USA) by ultracentrifuga-
tion at 4 °C. Finally, protein concentrations were deter-
mined from A
280
. For TRX II, A
280
¼ 1 corresponds to a
concentration of 18.5 lm (0.37 mgÆmL
)1
) [66], equivalent to
a molar absorption coefficient of 54 050 m
)1
Æcm
)1
. For
TRX I and CTX, the molar absorption coefficients (46 940
and 62 870 m
)1
Æcm
)1
, respectively) were calculated using a
GPMAW 6.01 [78] from the A
280
contribution of Tyr, Trp,
and Cys [79]. The calculated coefficient for TRX II,
55 900 m
)1
Æcm
)1
, differs from the experimental value for
less than 4%.
Mass spectrometry
All MS measurements were performed using a Bruker Bio-
APEX II ESI FT-ICR instrument (Bruker Daltonics, Bill-
erica, MA, USA), described previously in detail [66,80].
Briefly, the instrument was equipped with an external ESI
source (Analytica, Branford, CT, USA) having a dielectric
Pyrex capillary with Pt ⁄ Ni-coated ends (V
CapExit
¼ 80–120)
and a radio frequency hexapole (operated at 5.2 MHz and
500 V
p-p
) used for external ion accumulation. Samples were
directly infused into the ion source at a flow rate of 1.0 lLÆ
min
)1
. Carbon dioxide (69 kPA at 200 °C) was used as a
drying gas. ESI-generated ions were accumulated for 1.0 s
(D1) and transferred within 5.5 ms (P2) to an Infinity ICR
cell [81], located inside a 9.4 T central-field passively shiel-
ded superconducting magnet (Magnex Scientific Ltd,
Abingdon, Oxon, UK). Other ion source parameters were
adjusted to the most appropriate values. Ions were trapped
by a ‘SideKick’ technique before frequency-sweep excitation
(35–103 kHz, % 72 V
p-p
) and broadband detection
(36–96 kHz). All measurements were carried out with 512 k
(524 288) data points, and 64 coadded time-domain tran-
sients were recorded. The transients were subjected to fast
Fourier transform, magnitude calculation, and one zero-fill.
Mass spectra were externally calibrated using an ES Tuning
Mix (Hewlett Packard, Palo Alto, CA, USA) by a two-
parameter frequency-to-m ⁄ z calibration function [82]. Mass
spectral acquisition and postprocessing were performed
using Bruker xmass 5.0.1 ⁄ 6.0.1 software.
Titration experiments
MS titration experiments were performed in order to deter-
mine binding constants for xylanase–thioxylo-oligosaccha-
ride complexes. Experiments were carried out with
xylanases at a fixed concentration of 5.0 or 10.0 lm in
10 mm ammonium acetate buffer (pH 6.8), by varying the
concentration of oligosaccharide. Briefly, appropriate aliqu-
ots of protein and thioxylo-oligosaccharide solutions were
mixed up to obtain initial oligosaccharide concentrations of
5–100 lm. The samples were equilibrated at 20 °C for
10 min before MS analyses. To ascertain that the true
chemical equilibrium had been reached within 10 min,
xylanases (10 lm) were incubated with S-Xyl5-Me (50 lm)
overnight and analyzed as previously. The same relative
abundances of the free and bound enzymes were observed
with either 10 min or the extended incubation periods
within the error level of the experiments. Some of the ion
source parameters were carefully adjusted to minimize the
unintended dissociation of the weak noncovalent com-
plexes. For quantitative analysis (i.e. calculation of the
binding constants), this has crucial importance as relative
MS intensities should, as close as possible, reflect the true
chemical equilibrium in solution [68]. For instance, the
capillary exit potential, V
CapExit
, was typically set to 80–
120, as values of 160 clearly induced dissociation (data not
presented). The drying gas temperature adjusted between 25
and 300 °C did not have any effect on the relative free pro-
tein complex ratios (except the number of sodium adducts
present), and therefore 200 ° C was chosen as the optimized
value for maintaining good desolvation conditions.
X-ray crystallography
The catalytic domain of CTX was crystallized from solu-
tion containing 1.2 m ammonium sulfate as precipitant in
0.1 m Hepes buffer (pH 7.0) using a hanging-drop vapor
diffusion method at room temperature. The protein stock
solution was diluted with 10 mm sodium citrate buffer
(pH 5.0) to an approximate concentration of 7 mgÆmL
)1
.
Crystallization was initiated by mixing equal amounts of
protein and crystallization solutions. The crystals grew in
the space group P2
1
2
1
2. To obtain complex structures with
thioxylo-oligosaccharides, the crystals were soaked for 2 h
in the crystallization solutions containing 20 mm inhibitor
Thioxylo-oligosaccharide binding to xylanases J. Ja
¨
nis et al.
2328 FEBS Journal 272 (2005) 2317–2333 ª 2005 FEBS
before rapid soaking in the crystallization solution contain-
ing 40% (v ⁄ v) 2-methyl-2,4-pentanediol, acting as a cryo-
protectant. Alternatively, cocrystallization was performed
(data not presented) with all thioxylo-oligosaccharides, with
similar results to the soaking experiments. X-ray diffraction
measurements were carried out using a Rigaku RU-200HB
copper rotating anode source (wavelength 1.54 A
˚
) operated
at 50 kV and 100 mA, equipped with Osmic Confocal
optics (Osmic Inc., Auburn Hills, MI, USA) and an
R-AXIS IIC imaging plate detector (Rigaku ⁄ MSC, Wood-
lands, TX, USA). The crystals diffracted to a resolution of
1.55 A
˚
at 120 K. The data were processed with denzo and
scaled with scalepack [83]. The native structure of CTX
[64] was used as a starting point in the model construction.
The initial model was refined with cns [84], and electron-
density maps were visualized with program o [85]. The
asymmetric unit contained two molecules, A and B. Param-
eters of the measurement and refinement statistics for the
CTX–S-Xyl5-Me complex are summarized in Table 4.
Atomic co-ordinates for the crystal structures of TRX I,
TRX II, CTX, and CTX–S-Xyl5-Me complex can be found
at the Protein Data Bank ( by the
respective PDB codes, 1XYN, 1XYO, 1H1A, and 1XNK.
Acknowledgements
Financial support was provided by the European
Union 5th Framework Marie Curie Fellowship Pro-
gram (Grant HPMT-CT-2001-00366), the Graduate
School of Bioorganic and Medicinal Chemistry, and
the National Graduate School in Informational and
Structural Biology. We thank Dr Mark P. Barrow
(University of Warwick, Coventry, UK) for excellent
technical assistance, Dr Albert J. Jin (National Insti-
tutes of Health, Bethesda, MD, USA) for helpful dis-
cussions, and Dr Ossi Turunen (Helsinki University of
Technology, Helsinki, Finland) for kindly providing
the CTX samples.
References
1 Davies G & Henrissat B (1995) Structures and mechan-
isms of glycosyl hydrolases. Structure 3, 853–859.
2 Henrissat B (1991) A classification of glycosyl hydrolas-
es based on amino acid sequence similarities. Biochem J
280, 309–316.
3 Henrissat B & Bairoch A (1993) New families in the
classification of glycosyl hydrolases based on amino acid
sequence similarities. Biochem J 293, 781–788.
4 Henrissat B & Bairoch A (1996) Updating the sequence-
based classification of glycosyl hydrolases. Biochem J
316, 695–696.
5 Henrissat B & Davies G (1997) Structural and sequence-
based classification of glycoside hydrolases. Curr Opin
Struct Biol 7, 637–644.
6 Coutinho PM & Henrissat B (1999) Carbohydrate-
active enzymes (CAZy) server. />cazy/.
7 Jeffries TW (1994) Biodegradation of lignin and hemi-
celluloses. In Biochemistry of Microbial Degradation
(Ratledge C, ed), pp. 233–277. Kluwer Academic,
Amsterdam, the Netherlands.
8 Collins T, Gerday C & Feller G (2005) Xylanases, xyla-
nase families amd extromephilic xylanases. FEMS
Microb Rev 29, 3–23.
9 Jeffries TW (1996) Biochemistry and genetics of micro-
bial xylanases. Curr Opin Biotechnol 7, 337–342.
10 White A & Rose DR (1997) Mechanism of catalysis by
retaining b-glycosidases. Curr Opin Struct Biol 7, 645–
651.
11 Zechel DL & Withers SG (2000) Glycosidase mechan-
isms: anatomy of a finely tuned catalyst. Acc Chem Res
33, 11–18.
12 Larson SB, Day J, de la Rosa APB, Keen NT &
McPherson A (2003) First crystallographic structure of
Table 4. X-ray diffraction measurement and refinement statistics
for the CTX–S-Xyl5-Me Complex.
Inhibitor Methyl 4,4
II
,4
III
,4
IV
-
tetrathio-a-
D-xylopentaoside
Space group P2
1
2
1
2
Unit cell dimensions (A
˚
) a ¼ 108.24, b ¼ 57.59, c ¼ 66.21
Unit cell angles (°) 90, 90, 90
Resolution range (A
˚
) 1.55–99.0 (1.55–1.61)
a
Completeness (%) 92.8 (52.1)
R
sym
(%) 6.6 (29.6)
I ⁄ I
r
1.7 (1.04)
Number of observations 166670
Number of unique
reflections
56502
Temperature (K) 120
R
factor
(%) 19.7
R
free
(%) 22.4
Rmsd bond lengths (A
˚
) 0.0053
Rmsd bond angles (°) 1.52
Number of all atoms 3533
Number of protein atoms 3011
Number of waters 450
Number of inhibitor atoms 58
B
average
(A
˚
2
)
Protein main chain atoms 14.2
Protein side chain atoms 16.3
All protein atoms 15.2
Inhibitor atoms 30.6
Water atoms 28.1
Other atoms 36.6
All atoms 17.2
PDB code 1XNK
a
Values in parentheses are for the highest resolution shell (1.55–
1.61).
J. Ja
¨
nis et al. Thioxylo-oligosaccharide binding to xylanases
FEBS Journal 272 (2005) 2317–2333 ª 2005 FEBS 2329
a xylanase from glucoside hydrolase family 5: implica-
tions for catalysis. Biochemistry 42, 8411–8422.
13 Parkkinen T, Hakulinen N, Tenkanen M, Matti Siika-
Aho M & Rouvinen J (2004) Crystallization and preli-
minary X-ray analysis of a novel Trichoderma reesei
xylanase IV belonging to glycoside hydrolase family 5.
Acta Crystallogr D60, 542–544.
14 Collins T, Meuwis MA, Claeyssens M, Feller G & Ger-
day C (2002) A novel family 8 xylanase: functional and
physicochemical characterization. J Biol Chem 277,
35133–35139.
15 Beg QK, Kapoor M, Mahajan L & Hoondal GS (2001)
Microbial xylanases and their industrial applications: a
review. Appl Microbiol Biotechnol 56, 326–338.
16 Silversides FG & Bedford MR (1999) Effect of pelleting
temperature on the recovery and efficacy of a xylanase
enzyme in wheat-based diets. Poult Sci 78, 1184–1190.
17 Dersjant-Li Y, Schulze H, Schrama JW, Verreth JA &
Verstegen MWA (2001) Feed intake, growth, digestibil-
ity of dry matter and nitrogen in young pigs as affected
by dietary cation-anion difference and supplementation
of xylanase1. J Anim Physiol Anim Nutr 85, 101–105.
18 Jeffries TW & Kirk TK (1996) Roles for microbial
enzymes in pulp and paper processing. In Enzymes for
Pulp and Paper Processing (Jeffries TW & Viikari L,
eds), pp. 2–14. American Chemical Society, Washington
DC, USA.
19 Oksanen T, Pere J, Paavilainen L, Buchert J & Viikari
L (2000) Treatment of recycled kraft pulps with Tricho-
derma reesei hemicellulases and cellulases. J Biotechnol
78, 39–48.
20 Haros M, Rosell CM & Benedito C (2002) Improve-
ment of flour quality through carbohydrase treatment
during wheat tempering. J Agric Food Chem 50, 4126–
4130.
21 Frederix SA, Courtin CM & Delcour JA (2003) Impact
of xylanases with different substrate selectivity on glu-
ten-starch separation of wheat flour. J Agric Food Chem
51, 7338–7345.
22 Drenth J (1999) Principles of Protein X-Ray Crystallo-
graphy, 2nd edn. Springer-Verlag, New York, USA.
23 Heightman TD & Vasella AT (1999) Recent insights
into inhibition, structure, and mechanism of configura-
tion-retaining glycosidases. Angew Chem Int Ed 38,
750–770.
24 Davies GJ, Mackenzie L, Varrot A, Dauter M,
Brzozowski AM, Schulein M & Withers SG (1998)
Snapshots along an enzymatic reaction coordinate: ana-
lysis of a retaining glycoside hydrolase. Biochemistry 37,
11707–11713.
25 Varrot A & Davies GJ (2003) Direct experimental
observation of the hydrogen-bonding network of a
glycosidase along its reaction coordinate revealed by
atomic resolution analyses of endoglucanase Cel5A.
Acta Crystallogr D59, 447–452.
26 Withers SG, Warren AJ, Street IP, Rupitz K, Kempton
JB & Aebersold R (1990) Unequivocal demonstration of
the involvement of a glutamate residue as a nucleophile
in the mechanism of a ‘retaining’ glycosidase. JAm
Chem Soc 112, 5887–5889.
27 Miao S, Ziser L, Aebersold R & Withers SG (1994)
Identification of glutamic acid 78 as the active site
nucleophile in Bacillus subtilis xylanase using electro-
spray tandem mass spectrometry. Biochemistry 33,
7072–7032.
28 McCarter JD, Yeung W, Chow J, Dolphin D & Withers
SG (1997) Design and synthesis of 2¢-deoxy-2¢-fluorodi-
saccharides as mechanism-based glycosidase inhibitors
that exploit aglycon specificity. J Am Chem Soc 119,
5792–5797.
29 Sidhu G, Withers SG, Nguyen NT, McIntosh LP, Ziser
L & Brayer GD (1999) Sugar ring distortion in the gly-
cosyl-enzyme intermediate of a family G ⁄ 11 xylanase.
Biochemistry 38, 5346–5354.
30 Sabini E, Sulzenbacher G, Dauter M, Dauter Z, Jørgen-
sen PL, Schulein M, Dupont C, Davies GJ & Wilson
KS (1999) Catalysis and specificity in enzymatic gluco-
side hydrolysis: a
2,5
B conformation for the glycosyl-
enzyme intermediate revealed by the structure of the
Bacillus agaradhaerens family 11 xylanase. Chem Biol 6,
483–492.
31 Sulzenbacher G, Mackenzie LF, Wilson KS, Withers
SG, Dupont C & Davies GJ (1999) The crystal structure
of a 2-fluorocellotriosyl complex of the Streptomyces
lividans endoglucanase CelB2 at 1.2 A
˚
resolution.
Biochemistry 38, 4826–4833.
32 Vocadlo DJ, Davies GJ, Laine R & Withers SG (2001)
Catalysis by hen egg-white lysozyme proceeds via a
covalent intermediate. Nature 412, 835–838.
33 Keitel T, Simon O, Borriss R & Heinemann U (1993)
Molecular and active-site structure of a Bacillus 1,3–
1,4-b-glucanase. Proc Natl Acad Sci USA 90, 5287–5291.
34 Havukainen R, To
¨
rro
¨
nen A, Laitinen T & Rouvinen J
(1996) Covalent binding of three epoxyalkyl xylosides to
the active site of endo-1,4-xylanase II from Trichoderma
reesei. Biochemistry 35, 9617–9624.
35 Muraki M & Kazuaki H (1996) Origin of carbohydrate
recognition specificity of human lysozyme revealed by
affinity labeling. Biochemistry 35, 13562–13567.
36 Sulzenbacher G, Schu
¨
lein M & Davies GJ (1997) Struc-
ture of the endoglucanase I from Fusarium oxysporum:
native, cellobiose, and 3,4-epoxybutyl b-d-cellobioside-
inhibited forms, at 2.3 A
˚
resolution. Biochemistry 36,
5902–5911.
37 Ntarima P, Nerickx W, Klarskov K, Devreese B, Bhat
MK, van Beeumen J & Claeyssens M (2000) Epoxyalkyl
glycosides of d-xylose and xylooligosaccharides are
active-site markers of xylanases from glycoside
hydrolase family 11, not from family 10. Biochem J 347,
865–873.
Thioxylo-oligosaccharide binding to xylanases J. Ja
¨
nis et al.
2330 FEBS Journal 272 (2005) 2317–2333 ª 2005 FEBS
38 Williams SJ, Hoos R & Withers SG (2000) Nanomolar
versus millimolar inhibition by xylobiose-derived azasu-
gars: significant differences between two structurally dis-
tinct xylanases. J Am Chem Soc 122, 2223–2235.
39 Notenboom V, Williams SJ, Hoos R, Withers SG &
Rose DR (2000) Detailed structural analysis of
glycosidase ⁄ inhibitor interactions: complexes of Cex
from Cellulomonas fimi with xylobiose-derived aza-
sugars. Biochemistry 39, 11553–11563.
40 Williams SJ, Notenboom V, Wicki J, Rose DR & With-
ers SG (2000) A new, simple, high-affinity glycosidase
inhibitor: analysis of binding through X-ray crystallo-
graphy, mutagenesis, and kinetic analysis. J Am Chem
Soc 122, 4229–4230.
41 Zechel DL, Boraston AB, Gloster T, Boraston CM,
Macdonald JM, Tilbrook DMG, Stick RV & Davies
GJ (2003) Iminosugar glycosidase inhibitors: structural
and thermodynamic dissection of the binding of isofago-
mine and 1-deoxynojirimycin to b-glucosidases. JAm
Chem Soc 125, 14313–14323.
42 Varrot A, Tarling CA, Macdonald JM, Stick RV,
Zechel DL, Withers SG & Davies G (2003) Direct
observation of the protonation state of an imino sugar
glycosidase inhibitor upon binding. J Am Chem Soc
125, 7496–7497.
43 Gloster TM, Ducros VM-A, Roberts S, Perugino G,
Rossi M, Hoos R, Moracci M, Vasella A & Davies GJ
(2004) Structural studies of the b-glycosidase from
Sulfolobus solfataricus in complex with covalently and
noncovalently bound inhibitors. Biochemistry 43, 6101–
6109.
44 Driguez H (2001) Thiooligosaccharides as tools for
structural biology. Chembiochem 2, 311–318.
45 Sulzenbacher G, Driguez H, Henrissat B, Schulein M &
Davies GJ (1996) Structure of the Fusarium oxysporum
endoglucanase I with a nonhydrolyzable substrate ana-
logue: substrate distortion gives rise to the preferred
axial orientation for the leaving group. Biochemistry 35,
15280–15287.
46 Zou J, Kleywegt GJ, Sta
˚
hlberg J, Driguez H, Nerinckx
W, Claeyssens M, Koivula A, Teeri TT & Jones AT
(1999) Crystallographic evidence for substrate ring dis-
tortion and protein conformational changes during cata-
lysis in cellobiohydrolase Cel6A from Trichoderma
reesei. Structure 7, 1035–1045.
47 Parsiegla G, Reverbel-Leroy C, Tardif C, Belaich JP,
Driguez H & Haser R (2000) Crystal structures of the
cellulase Cel48F in complex with inhibitors and sub-
strates give insights into its processive action. Biochemis-
try 39, 11238–11246.
48 Hrmova M, Varghese JN, De Gori R, Smith BJ,
Driguez H & Fincher GB (2001) Catalytic mechanisms
and reaction intermediates along the hydrolytic pathway
of a plant b-d-glucan glucohydrolase. Structure 9, 1005–
1016.
49 Varrot A, Schu
¨
lein M, Fruchard S, Driguez H & Davies
GJ (2001) Atomic resolution structure of endoglucanase
Cel5A in complex with methyl 4,4
II
,4
III
,4
IV
-tetrathio-
a-d-cellopentaoside highlights the alternative binding
modes targeted by substrate mimics. Acta Crystallogr
D57, 1739–1742.
50 Varrot A, Frandsen TP, Driguez H & Davies GJ
(2002) Structure of the Humicola insolens cellobiohy-
drolase Cel6A D416A mutant in complex with a non-
hydrolysable substrate analogue, methyl cellobiosyl-4-
thio-b-cellobioside, at 1.9 A
˚
. Acta Crystallogr D58,
2201–2204.
51 Fenn JB, Mann M, Meng CK, Wong SF & Whitehouse
CM (1989) Electrospray ionization for mass spectrome-
try of large biomolecules. Science 246 , 64–71.
52 Loo JA (2000) Electrospray ionization mass spectrome-
try: a technology for studying noncovalent macro-
molecular complexes. Int J Mass Spectrom 200, 175–
186.
53 Daniel JM, Friess SD, Rajagopalan S, Wendt S &
Zenobi R (2002) Quantitative determination of nonco-
valent binding interactions using soft ionization mass
spectrometry. Int J Mass Spectrom 216, 1–27.
54 Heck AJR & van den Heuvel RHH (2004) Investigation
of intact protein complexes by mass spectrometry. Mass
Spectrom Rev 23, 368–389.
55 Marshall AG, Hendrickson CL & Jackson GS (1998)
Fourier transform ion cyclotron resonance mass spec-
trometry: a primer. Mass Spectrom Rev 17, 1–35.
56 Smith RD (2000) Evolution of ESI-mass spectrometry
and Fourier transform ion cyclotron resonance for pro-
teomics and other biological applications. Int J Mass
Spectrom 200, 509–544.
57 Yu Y, Kirkup CE, Pi N & Leary JA (2004) Characteri-
zation of noncovalent protein–ligand complexes and
associated enzyme intermediates of GlcNAc-6-O-sulfo-
transferase by electrospray ionization FT-ICR mass
spectrometry. J Am Soc Mass Spectrom 15, 1400–
1407.
58 Daneshfar R, Kitova EN & Klassen JS (2004) Determi-
nation of protein–ligand association thermochemistry
using variable-temperature nanoelectrospray mass
spectrometry. J Am Chem Soc 126, 4786–4787.
59 Wang W, Kitova EN & Klassen JS (2003) Influence of
solution and gas phase processes on protein–carbohy-
drate binding affinities determined by nanoelectrospray
Fourier transform ion cyclotron resonance mass spectro-
metry. Anal Chem 75, 4945–4955.
60 Nousiainen M, Vainiotalo P, Cooper HJ, Hoxha A,
Derrick PJ, Fati D, Trayer HR, Ward DG & Trayer IP
(2002) Calcium and peptide binding to folded and
unfolded conformations of cardiac troponin C. Electro-
spray ionization and Fourier transform ion cyclotron
resonance mass spectrometry. Eur J Mass Spectrom 8,
471–481.
J. Ja
¨
nis et al. Thioxylo-oligosaccharide binding to xylanases
FEBS Journal 272 (2005) 2317–2333 ª 2005 FEBS 2331
61 Hagan N & Fabris D (2003) Direct mass spectrometric
determination of the stoichiometry and binding affinity
of the complexes between nucleocapsid protein and
RNA stem-loop hairpins of the HIV-1 w-recognition
element. Biochemistry 42, 10763–10745.
62 To
¨
rro
¨
nen A, Harkki A & Rouvinen J (1994) Crystallo-
graphic studies on endo-1,4-b-xylanase II from Tricho-
derma reesei: two conformational states in the active
site. EMBO J 13, 2493–2501.
63 To
¨
rro
¨
nen A & Rouvinen J (1995) Structural comparison
of two major endo-1,4-b-xylanases from Trichoderma
reesei. Biochemistry 34, 847–856.
64 Hakulinen N, Turunen O, Ja
¨
nis J, Leisola M & Rouvi-
nen J (2003) Three-dimensional structures of thermophi-
lic b-1,4-xylanases from Chaetomium thermophilum and
Nonomuraea flexuosa: comparison of twelve xylanases in
relation to their thermal stability. Eur J Biochem 270,
1399–1412.
65 Ja
¨
nis J, Rouvinen J, Leisola M, Turunen O & Vainio-
talo P (2001) Thermostability of endo-1,4-b-xylanase
II from Trichoderma reesei studied by electrospray
ionization Fourier transform ion cyclotron resonance
MS, hydrogen ⁄ deuterium-exchange reactions and
dynamic light scattering. Biochem J 356, 453–460.
66 Ja
¨
nis J, Turunen O, Leisola M, Derrick PJ, Rouvinen J
& Vainiotalo P (2004) Characterization of mutant xyla-
nases using Fourier transform ion cyclotron resonance
mass spectrometry: stabilizing contributions of disulfide
bridges and N-terminal extensions. Biochemistry 43 ,
9556–9566.
67 Marshall AG, Senko MW, Li W, Li M, Dillon S, Guan
S & Logan TM (1997) Protein molecular mass to 1 Da
by
13
C,
15
N double-depletion and FT-ICR mass spectro-
metry. J Am Chem Soc 119, 433–434.
68 Peschke M, Verkerk UH & Kebarle P (2004) Features
of the ESI mechanism that affects the observation of
multiply charged noncovalent protein complexes and
the determination of the association constant by the
titration method. J Am Soc Mass Spectrom 15, 1424–
1434.
69 Davies GJ, Wilson KS & Henrissat B (1997) Nomencla-
ture for sugar-binding subsites in glycosyl hydrolases.
Biochem J 321, 557–559.
70 Wang W, Kitova EN & Klassen JS (2003) Bioactive
recognition sites may not be energetically preferred in
protein–carbohydrate complexes in the gas phase. JAm
Chem Soc 125, 13630–13631.
71 Charnock SJ, Bolam DN, Turkenburg JP, Gilbert HJ,
Ferreira LMA, Davies GJ & Fontes CMGA (2000) The
X6 ‘thermostabilizing’ domains of xylanases are carbo-
hydrate-binding modules: structure and biochemistry of
the Clostridium thermocellum X6b domain. Biochemistry
39, 5013–5021.
72 Szabo
´
L, Jamal S, Xie H, Charnock SJ, Bolam DN,
Gilbert HJ & Davies GJ (2001) Structure of a family 15
carbohydrate-binding module in complex with xylopen-
taose. J Biol Chem 276, 49061–49065.
73 Schmidt A, Gu
¨
bitz GM & Kratky C (1999) Xylan bind-
ing subsite mapping in the xylanase from Penicillum
simplicissimum using xylooligosaccharides as cryo-pro-
tectant. Biochemistry 38, 2403–2412.
74 Wakarchuk WW, Campbell RL, Sung WL, Davoodi J
& Yaguchi M (1994) Mutational and crystallographic
analyses of the active site residues of the Bacillus circu-
lans xylanase. Protein Sci 3, 467–475.
75 Sabini E, Wilson KS, Danielsen S, Schu
¨
lein M &
Davies GJ (2001) Oligosaccharide binding to family 11
xylanases: both covalent intermediate and mutant pro-
duct complexes display
2,5
B conformations at the active
centre. Acta Crystallogr D57, 1344–1347.
76 Ibatullin FM, Shabalin KA, Ja
¨
nis JV & Selivanov SI
(2001) Stereoselective synthesis of thioxylooligosacchar-
ides from S-glycosyl isothiourea precursors. Tetrahedron
Lett 42, 4565–4567.
77 Ibatullin FM, Shabalin KA, Ja
¨
nis JV & Shavva AG
(2003) Reaction of 1,2-trans-glycosyl acetates with
thiourea: a new entry to 1-Thiosugars. Tetrahedron Lett
44, 7961–7964.
78 Peri S, Steen H & Pandey A (2001) GPMAW: a soft-
ware tool for analyzing proteins and peptides. Trends
Biochem Sci 26, 687–689.
79 Gill SC & von Hipple PH (1989) Calculation of protein
extinction coefficients from amino acid sequence data.
Anal Biochem 182, 319–332.
80 Palmblad M, Ha
˚
kansson K, Ha
˚
kansson P, Feng X,
Cooper HJ, Giannakopulos AE, Green PS & Derrick
PJ (2000) A 9.4 T Fourier transform ion cyclotron reso-
nance mass spectrometer: description and performance.
Eur J Mass Spectrom 6, 267–275.
81 Caravatti P & Alleman M (1991) The ¢infinity¢ cell: a
new trapped-ion cell with radiofrequency covered trap-
ping electrodes for Fourier transform ion cyclotron
resonance mass spectrometry. Org Mass Spectrom 26,
514–518.
82 Shia SD-H, Drader JJ, Freitas MA, Hendrickson CL &
Marshall AG (2000) Comparison and interconversion of
the two most common frequency-to-mass calibration
functions for Fourier transform ion cyclotron resonance
mass spectrometry. Int J Mass Spectrom 195 ⁄ 196, 591–
598.
83 Otwinowski Z & Minor W (1997) Processing of X-ray
diffraction data collected in oscillation mode. Methods
Enzymol 276, 307–326.
84 Bru
¨
nger AT, Adams PD, Clore GM, DeLano WL,
Gros P, Grosse-Kunstleve RW, Jiang J-S, Kuszewski
J, Nilges M, Pannu NS, Read RJ, Rice LM, Simon-
son T & Warren GL (1998) Crystallography and
NMR System: a new software suite for macromole-
cular structure determination. Acta Crystallogr D54,
905–921.
Thioxylo-oligosaccharide binding to xylanases J. Ja
¨
nis et al.
2332 FEBS Journal 272 (2005) 2317–2333 ª 2005 FEBS
85 Jones TA, Zou JY, Cowan SW & Kjelgaard M (1991)
Improved methods for building protein models in
electron density maps and location of errors in these
models. Acta Crystallogr A47, 110–119.
86 DeLano WL (2002) The PyMOL Molecular Graphics
System. DeLano Scientific, San Carlos, CA, USA.
87 IUPAC-IUB, (1980) Joint Commission on Biochemical
Nomenclature (JCBN). Conformational nomenclature
for five and six-membered ring forms of monosaccha-
rides and their derivatives: recommendations. Eur J
Biochem 111, 295–298.
J. Ja
¨
nis et al. Thioxylo-oligosaccharide binding to xylanases
FEBS Journal 272 (2005) 2317–2333 ª 2005 FEBS 2333