Tài liệu Báo cáo khoa học: Use of hydrostatic pressure to produce ‘native’ monomers of yeast enolase ppt
Bạn đang xem bản rút gọn của tài liệu. Xem và tải ngay bản đầy đủ của tài liệu tại đây (318.57 KB, 8 trang )
Use of hydrostatic pressure to produce ‘native’ monomers of yeast
enolase
M. Judith Kornblatt
1
, Reinhard Lange
2,
* and Claude Balny
2,
*
1
Department of Chemistry and Biochemistry, Concordia University, Montreal, Quebec, Canada;
2
INSERM Unite 128, IFR 122,
Montpellier, France
The effects of hydrostatic pressure on yeast enolase have
been studied in the presence of 1 m
M
Mn
2+
. When com-
pared w ith apo-enolase, and Mg-enolase, the Mn-enzyme
differs from th e others in three ways. Exposure t o hydro-
static pressure does not inactivate the enzyme. If the
experiments are performed i n t he presence of 1 m
M
Mg
2+
,
or with apo-enzyme, the enzyme is inactivated [Kornblatt,
M.J., Lange R., Balny C. (1998) Eur. J. Biochem 251, 775–
780]. The UV spectra of the high pressure forms of the
Mg
2+
- and apo-forms of enolase are identical and distinct
from the spectrum of the form obtained in the presence of
1m
M
Mn
2+
; this s uggests that M n
2+
remains bound to the
high pr essure form of enolase. With Mn-enolase, the various
spectral changes do not occur in the same pressure range,
indicating that multiple processes are occurring. Pressure
experiments were performed as a function of [Mn
2+
]and
[protein]. One of t he changes in th e UV spectra shows a
dependence on protein concentration, indicating that eno-
lase is dissociating into monomers. The small changes in the
UV spectrum a nd the retention of activity lead to a model
in which enolase, in t he presence of high concentrations of
Mn
2+
, dissociates into native monomers; upon release of
pressure, the enzyme isfully active. A lthough f urther spectral
changes occur at higher pressures, there is no inactivation as
long as Mn
2+
remains bound. We propose t hat the relatively
small and polar nature of the subunit interface of yeast
enolase, including the presence of several salt bridges, is
responsible for the ability of hydrostatic pressure to disso-
ciate this enzyme into monomers with a native-like structure.
Keywords: dissociation; enolase; hydrostatic pressure; native
monomers.
Many enzymes normally exist as oligomeric proteins. In
some cases, the e nzyme is a regulatory enzyme; allosteric
kinetics require multiple subunits. In other cases, the active
site is at the interface of the subunits, with two subunits each
contributing residues. In many cases, however, it is not
obvious what role is played by the oligomeric structure.
Attempts to study the relationship between oligomeric state
and the structure a nd function of the protein usually involve
dissociating the protein into its subunits and then compar-
ing the properties of the monomeric and oligomeric forms.
Often, the r esulting monomers a re catalytically inactive.
Because tertiary and quaternary structure are maintained b y
similar forces, agents, such as temperature and chemical
denaturants, that disrupt quater nary structure may also
disrupt tertiary structure. Thus, when faced with inactive
monomers of an active oligomeric protein, it is difficult to
know if the conformation of the monomer has b een altered
or if the quaternary structure is, i n some way, necessary for
activity.
Hydrostatic pressure is a useful tool for s tudying p rotein
structure a nd function. If an equilibrium system, A Ð B, is
subjected to pressure, the equilibrium will be displaced in the
direction of t he system that occupies the smaller v olume. In
the case of a solution of a protein, hydrostatic pressure may
change the conformation, promote binding or dissociation
of a ligand, denature the protein or dissociate an oligomeric
protein [1–3]. Factors that contribute t o d ifferences in
volume between an oligomer and its subunits include
removal of p acking defects, hydration of buried surfaces,
and disruption of salt bridges. As a general rule (although
there are exceptions), the pressure required to dissociate an
oligomeric protein is less than that required to denature
monomeric proteins. It t herefore seems reasonable t o e xpect
that pressure could d issociate oligomeric protein s while
having relatively little effect on the secondary and tertiary
structure of the resulting monomers. In spite of this
expectation, most monomers produced by hydrostatic
pressure have been inactive [1].
Yeast enolase (EC 4.2.1.11), which catalyzes the inter-
conversion of 2-phosphoglycer ic a cid and pho sphoenol-
pyruvate, is a homodimer. High resolution X-ray structures
are available for the yeast enzyme [4–6], as well as en olase
from lobster [ 7], Escherichia coli [8] and Trypanosoma brucei
[9]. Each subunit has two domains; the larger domain is an
a/b barrel, while the smaller is a mixture of b-sheet and
a-helices. The dimer interface includes two helices in the
large domain and two b-strands in the small domain. The
active site is at the bottom of the barrel and is totally
Correspondence to M. J. Kornblatt, Department of Chemistry and
Biochemistry, Concordia University, 7141 Sherbrooke W, Montreal,
Que. H4B 1R6 Canada. Fax: +1 514 848 2868,
E-mail:
Enzyme: enolase, EC 4 .2.1.11
*Current address: Universite
´
Montpellier 2, EA3763, Place E uge
`
ne
Bataillon, 34095 Montpellier cedex 5, France.
(Received 7 June 2004, revised 2 August 2004, accepted 6 August 2004)
Eur. J. Biochem. 271, 3897–3904 (2004) Ó FEBS 2004 doi:10.1111/j.1432-1033.2004.04326.x
contained within the monomer. The small domain of the
same subunit contributes a loop which closes over the active
site when substrate b inds. Enolase is a metalloenzyme;
substrate can not bind unless a divalent cation, usually
Mg
2+
or Mn
2+
,isboundattheactivesite[10].
Hydrostatic pressure [11–13], a nd salts [14–18] have been
used to dissociate enolases. Most of these procedures have
produced inactive, but folded, monomers. As the active s ite
is physically contained w ithin each s ubunit and as the
interface contains elements of secondary structure which
should be relatively unperturbed by mild treatments, we
have been puzzled by our inability t o produce active
monomers. Brewer, in his extensive studies on the dissoci-
ation of yeast enolase [ 14], dissociated the enzyme by d iluting
it into millimolar solutions of EDTA. These monomers,
formed in the a bsence of a d ivalen t cation, were inactive. O ur
studies using hydrostatic pressure indicated that the Mg
2+
was l ost during p ressure-induced dissociation [12]; these
monomers were also inactive. We proposed that, in o rder to
maintain the structure of the active site, divalent cation and,
perhaps, substrate had to be bound to the enzyme.
This article presents a study of the pressure-induced
dissociation of yeast enolase in the presence of Mn
2+
.We
demonstrate the ability of hydrostatic pressure to produce
native monomers – monomers which have undergone no
apparent conformational changes and maintain enzymatic
activity upon return to low pressure.
Materials and methods
Buffer for all experiments contained 25 m
M
Mes, 25 m
M
Tris, pH 7.1. The pH of this buffer is relatively insensitive to
pressure. Mg
2+
or Mn
2+
was present at the stated
concentration; EDTA was present at 1/10th the concentra-
tion of the Mg
2+
or Mn
2+
. EDTA binds divalent cations
such as Co
2+
,Ni
2+
,Cu
2+
and Zn
2+
more strongly than it
binds Mn
2+
and Mg
2+
. EDTA was added t o t he buffer in
the hope of minimizing the free concentration of o ther
divalent cations. Yeast enolase ( Sigma) was dialyzed against
buffer prior to use. For the experiments that compared apo-
enolase with enolase containing Mg
2+
or varying concen-
trations o f Mn
2+
, the enzyme was dialyzed against buffer
and t hen passed through a small chelex column ( Bio-Rad,
Hercules, C A, USA) in order to remove divalent cations.
The stated concentrations of EDTA, M g
2+
or Mn
2+
were then added. The concentration of yeast enolase
was determined from its absorbance at 280 nm, using,
e ¼ 0.9 mLÆmg
)1
Æcm
)1
[19] and a molecular mass of
94 000 Da. Protein concentrations are expressed as the
concentration o f dimeric enzyme. Enzyme activity was
measured by following the change in absorbance a t 240 nm,
due to the production of phosphoenol pyruvate; the
concentration of 2-phosphoglyceric acid (Sigma) i n the
assay w as 1 m
M
. Pressure dissociation and pressure inacti-
vation experiments were performed at 15 °C.
UV spectra were recorded under pressure, using a Varian
Cary 3 spectrophotometer (Varian, Australia) interfaced to
a high pressure bomb. After correction for increased
absorption due to compression, the 4th derivatives of the
spectra were calculated, as described previously [20]. Data
collection was optimized in order to maintain spectral
quality. When the protein concentration was 9 l
M
(0.9 mg ÆmL
)1
), spectra were r ecorded in a square cuvette
with path length of 1 cm. Samples were scanned from 260 to
305 nm, using a 1 nm band pass, 1 s signal averaging time
and a 0.1 nm data interval. At 53 l
M
(5 mgÆmL
)1
), the
same procedures were used except that the p ath length of
the cuvette was 0.2 cm. At 2.2 l
M
(0.2 mg ÆmL
)1
), samples
were scanned from 270 to 296 nm, using 5 s signal
averaging time. Preliminary experiments were performed in
order to determine the pressure range in which spectral
changes were occurring and the length of time necessary for
equilibrium to be reached. One s ample was used for each
complete pressure curve. At low pressures (the r ange where
no spectral changes are occurring) the pressure was held fo r
5–10 min, the spectrum was recorded and the pressure then
increased to the next value. In the pressure range where
spectral changes were occurring, pressure was held for
45 min prior to recording the spectrum. At high pressures
(spectral changes are complete), the time at pressure was
decreased to 10 min. At the end of the experiment, the
pressure was lowered to 5–10 MPa and, after 10 min, a final
spectrum was recorded. At 2.2 l
M
enolase, 22 min was
required to record each spectrum; the time at pressure was
reduced to 7 min at low a nd high pressur es and 37 min in the
region where spectral changes were occurring. In all cases, in
the range where c hanges were occurring, the total time at
pressure (hold time plus recording time) was at least 53 min.
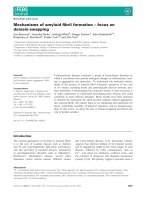
The s pectra were analyzed using four parameters (Fig. 1):
(a) the absorbance value at 296 nm, after correction for
pressure; (b) D1 ¼ (maximum value of the 4th derivative in
the region of 291 nm) – (minimum value of the 4th
derivative in the region of 295–296 nm); (c) D2 ¼ (maxi-
mum value of the 4th derivative at 287–288 nm) ) (mini-
mum value at 283–284 nm); (iv) D3 ¼ (value of the 4th
derivative at 276.6 nm) – (value at 279.6 nm).
In order to compare different e xperiments and different
spectral changes, the values of these parameters were
normalized as follows. The low pressure and high pressure
values for each parameter were determined from the
spectra. Values for intermediate pressures were expressed
as a fraction of the total change in that parameter that
occurred between low and high pressures. The values of D2
were used to calculate K
d
for dissociation o f t he dimer into
monomers, assuming that the low pressure value of D2is
that of dimeric enzyme and the high pressure value of D2
is that of the monomer: K
d
¼ 4[eno lase](fraction mono-
meric)
2
/(fraction dimeric).
As ¶(ln K
d
)/¶P ¼ –DV/RT,aplotoflnK
d
vs. press ure
gives DV, the volume change for the process, and K
d
at
0.1 MPa.
Pressure inactivation of enolase was measured by
subjecting dilute solutions of enolase to pressure for varying
times, returning to 0.1 MPa, and immediately assaying the
sample for enzymatic activity. Samples used for equilibriu m
inactivation experiments contained 0.04 mgÆmL
)1
BSA.
The albumin was a dded in order to minimize losses of
activity due to absorption of enolase to the sides of the
cuvette during the 45 min incubation under pressure.
Results
Exposure of yeast enolase to hydrostatic pressure in the
range o f 0.1–240 MPa dissociates the enzyme reversibly into
3898 M. J. Kornblatt et al. (Eur. J. Biochem. 271) Ó FEBS 2004
monomers [11–13]; there is no spectral evidence for
denaturation occurring in these samples. There are a
number of small changes that occur in the UV spectrum
of the protein. Figure 1 shows the zero order UV spectra of
the p rotein at low and high pressures a nd the 4th derivatives
of the same spectra. Changes in the UV spectra of Fig. 1A,
which a re small, are magnified by calculating the 4th
derivative; in addition, it is e asier to quantify t he changes in
the U V s pectra if one u ses t he 4th derivatives. In our
analysis, we use the following spectral characteristics: (a)
changes in the zero order spectra at 296 nm; (b) changes in
three regions of the 4th derivative o f the spectra, as indicated
on Fig. 1B. The changes in these three regions – D1, D2,
D3 – were c alculated as d escribed in Material and methods.
These spectral changes are fully and rapidly (within 10 min)
reversible upon return to 5–10 MPa. The changes in the UV
spectra that occur during exposure to hydrostatic pressure
indicate that changes are occurring in the environment of at
least some of the aromatic residues. This is consistent with
earlier work [11] showing changes in the intrinsic fluores-
cence emission spectrum of enolase during pressure-induced
dissociation.
In an earlier study [12], we concluded that Mg
2+
disso-
ciates from eno lase during pressure-induced dissociation of
enolase into monomers; the resulting monomers were
inactive. W e reasoned that the monomers produced by
hydrostatic pressure might maintain their native structure
and activity if t he divalent cation remained bound. We
therefore compared the spectral changes occurring under
pressure with Mg
2+
,Mn
2+
or no divalen t cation present.
The s pectra in Fig. 1 w ere recorded in the presence of
Mn
2+
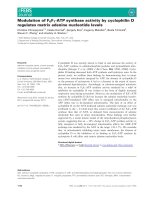
. F igure 2 shows the spectr a of the low pres sure
(Fig. 2A) and high pressure (Fig. 2B) forms of apo-, Mg
2+
-
and Mn
2+
-enolase. The low pressure form is fully dimeric;
based on previous experiments, we assume that the high
pressure forms are monomeric. T he presence or absence of
divalent cation has a small effect on the spectrum of dimeric
enzyme. Although the Mg
2+
and Mn
2+
forms have
identical spectra at low pressure, they do not have the same
high pressure spectra; this is most apparent for the
parameter, D1. With the Mn
2+
enzyme, D1 decreases very
slightly at high pressure; with the Mg
2+
form, there is a
noticeable increase in D1 a t high pressure. Figure 2B shows
that the spectra of the apo- and Mg
2+
forms of enolase at
high pressure are identical and differ from that of the Mn
2+
enzyme. As the spectrum of Mn
2+
-enolase differs from the
other two spectra, we conclude that Mn
2+
remains bound
to the high pressure form of the enzyme.
Fig. 2. Fourth derivative spectra of the apo-, Mg
2+
and Mn
2+
forms of
yeast enolase a t high and low pressures. Enolase was passed through a
small chelex colum n and dilut ed, with chelexed buffer, to 10 m
M
.
Additions were then made such that the samples contained 1 m
M
EDTA (apo-form, solid line), 1 m
M
Mg
2+
and 0.1 m
M
EDTA (dotted
line) or 1 m
M
Mn
2+
and 0.1 m
M
EDTA (dashed line). (A) Spe ctra
were recorded at 10 MPa. (B) Spectra were recorded at 220 MPa.
Fig. 1. UV spectra o f yeast enolase at high and low pressures. The
spectrum of yeast enolase, 10.6 m
M
, i n Mes/Tris b uffer containing
1m
M
Mn
2+
and 0.1 m
M
EDTA was recorded at 10 (continuous line)
and 220 (dashed line) MPa. (A) T he zero order spectra, which have
been c orrected for the volume ch ange due to pressure. (B) The 4th
derivative of the spectra shown in (A); the thr ee arrows indicate the
parameters that were used to an alyze the ch anges that occur upon
exposure to pressure.
Ó FEBS 2004 Native monomers of yeast enolase produced by pressure (Eur. J. Biochem. 271) 3899
If Mn
2+
stays bound to enolase during the exposure to
pressure, what happens to enzymatic activity? In order to
answer this question, a dilute solution of enolase, 9 n
M
,was
exposed to pressure for short periods of time. Immediately
upon returning to 0.1 MPa, the sample was removed and
assayed for enzymatic activity. We were unable to demon-
strate inactivation of enolase when the sample contained
1m
M
Mn
2+
. In the presence of 1 m
M
Mg
2+
,1minat
240 MPa caused a 50% loss of activity; with 1 m
M
Mn
2+
in
the sample, no loss of activity was observed at 240 MPa,
even when the t ime at pressure w as increased t o 15 min.
Either the high pressure form of Mn-enolase is active or
its activity is completely recovered within 1.5 min at
atmospheric pressure.
Pressure exp eriments performed in the presence of 1 m
M
Mn
2+
differed from th ose in the presence of 1 m
M
Mg
2+
in
another significant manner. When Mg
2+
was the cation, all
the spectral changes (D1, D2, D3, absorbance at 296 nm),
occurred in the same pressure range. This is also observed
with apo-enzyme. When Mn
2+
was the cation, the various
spectral changes did not all occur at once (Fig. 3), indicating
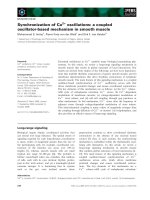
the existence of multiple processes. In order to determine if
any of the spectral changes monitor dissociation, the
pressure experiments were performed at three protein
concentrations – 2.2 l
M
,9.4l
M
and 53 l
M
;allthreewere
performed at 1 m
M
Mn
2+
. Changes in D2showedaclear
dependence on protein concentration (Fig. 4A). This indi-
cates that exposure to hydrostatic pressure does dissociate
the enzyme i nto monomers a nd that D2 monitors the
dissociation. In addition, if D2isusedtocalculateK
d
for
dissociation as a function of pressure, data from all three
protein concentrations fall on the same line (Fig. 4B). From
this data , w e ca lculate t hat K
d
at 10 MPa is 4.5 · 10
)9
and
DV ¼ )120 mLÆmol
)1
. Changes in the other parameters, D3
and absorbance at 2 96 (nm) (Fig. 3), begin at h igher
pressures and show a much smaller dependence upon
protein concentration (not shown). There is sufficient scatter
in this data that we cannot say if both of these changes occu r
at the same pressure. At a minimum, two steps – dissoci-
ation into monomers, and conformational changes in the
monomers – are occurring. Changes in D3 and absorbance
at 296 nm were shifted to slightly higher pressures with the
53 l
M
sample (not shown). This suggests that these spectral
changes only occur in the monomeric form of the protein.
We have now established t hat yeast enolase, in the
presence of 1 m
M
Mn
2+
, is dissociated by pressure and that
the spectral parameter D2 is a measure of dissociation. The
differences seen in the high pressure spe ctra of F ig. 2B
indicate that the Mn
2+
remains bound t o the monomers.
Upon release of pressure, the enzyme is fully active.
As the Mn
2+
concentration is decreased, the high
pressure spectra approach that of apo-enolase (Fig. 5) and
inactivation occurs. Does this inactivation parallel dissoci-
ation? An equilibrium pressure-inactivation experiment was
performedwith6n
M
enolase a nd 25mM Mn
2+
.Usingthe
data shown in Fig. 4B, we can calculate that, at 6 n
M
,the
Fig. 3. Effects of pressure on the spectral parameters. Asolutionof
enolase, 2.2 l
M
, containing 1 m
M
Mn
2+
, was subjected to increasing
pressure; spectra were recorded, a nalyzed, and normalized as described
in Materials and methods. The parameters are D3(s), D2(d)and
absorbance at 296 nm (.).
Fig. 4. Changes in D2dependonproteinconcentration.(A) A solution
of enolase, containing 1 m
M
Mn
2+
, was subjected to increasing pres-
sure; spectra were recorded, analyzed, and n ormalized as de scribed in
Materials and meth ods. Th e conc entrations o f en olase are 2.2 lM(s),
9.4 lM(d), 53 lM(.). (B) Th e data shown in (A) were used to
calculate K
d
, as d escribed in Materials a nd methods. Enolase con-
centrations were 2.2 l
M
(s), 9.4 l
M
(.)and53l
M
(d).
3900 M. J. Kornblatt et al. (Eur. J. Biochem. 271) Ó FEBS 2004
concentration used for the p ressure-inactivation e xperi-
ments, the enzyme would be 95% dissociated by 90 MPa.
However, inactivation does not begin until 120 MPa (8%
inactivation), with 50% inactivation occu rring a t a bout
170 MPa. D issociation is not accompanied by loss of
activity. The loss of activity that occurs at the h igher
pressures is r eversible, with 90% o f the initial a ctivity
recovered within 12 min at 10 MPa.
Pressure dissociates enolase
Depending on the identity and concentration of the divalent
cation, two different forms of the monomer are produced.
One, which we call ÔnativeÕ, has spectral properties almost
identical to that of the dimeric enzyme and still has the
cation bound. Upon return to 0.1 MPa, it i s fully active.
The second has lost the divalent cation, has greater spectral
differences and is inactive upon return to 0.1 MPa. We do
not know if 1.5 min after return to 10 MPa, the enzyme is
still monomeric. At 9 n
M
enzyme, 95% reassociation within
1.5 min would mean that t he rate constant for reassociation
was 1 · 10
7
s
)1
Æ
M
)1
. A lthough this i s fast, it is within the
range of observed rate constants for protein–protein
reactions [21]. What we do know is that the presence of
bound Mn
2+
stabilizes the monomer such that either it is
fully active or requires nothing more than reassociation to
be active. We will use the term Ônative monomerÕ to refer to
the form of the enzyme produced by dissociation under
pressure that is fully active on return to 0.1 MPa.
Our results can be summarized by the following model
(Fig. 6). With Mg
2+
as the divalent cation, dissociation, loss
of Mg
2+
, inactivation, and conformational changes in the
monomer all occur in one step (step 1). When Mn
2+
is the
cation, dissociation occurs (step 2) to p roduce mon omers
which still have Mn
2+
bound and are fully active upon
return to 0.1 MPa. As the pressure is raised still higher,
conformational ch anges occur in the monomer. Depending
on the concentration of M n
2+
and the K
d
of the monomer
for Mn
2+
,Mn
2+
and activity may be retained (step 3) or
Mn
2+
may b e lost (step 4), yielding inactive m onomers. As
both the empty Mn
2+
site and the free Mn
2+
would be
hydrated, it is not surprising that dissociation of the Mn
2+
is promoted by hydrostatic pressure.
Based on this model, we predicted that, at high Mg
2+
concentrations, the Mg
2+
form of the enzyme would
behave as the Mn
2+
– i.e. the monomers formed initially
wouldretainMg
2+
and activity. This prediction has been
confirmed. Pressure-inactivation experiments were per-
formed as a function of the Mg
2+
concentration. Exposure
of 3 n
M
enolase to 220 MPa for 4 min results in almost
complete inactivation of the enzyme w hen t he sample
contains 0.45 m
M
Mg
2+
. If, however, the sample contains
5m
M
Mg
2+
, there was only a 13% loss of activity.
Increasing the time at 220 MPa or increasing the pressure to
260 or 300 MPa did not result in any further loss of activity.
Discussion
A large number of oligomeric enzymes, including phospho-
fructokinase [22], hexokinase [23], lactate dehydrogenase
[24], and creatine kinase [25], have been examined by using
pressure. I n these examples, and others, pressure both
dissociated and inactivated the protein. In addition, recov-
ery of activity was a slow process and was ofte n incomplete.
We are aware of only two other studies reporting the
production by hydrostatic pressure of native monomers.
Two of the partial activities of carbamoyl-phosphate
synthetase were largely unaffected when the dimeric enzyme
was dissociated [26]; in this experiment, assays were begun
within 15 s of returning to 0.1 MPa. Based on electropho-
resis under pressure and activity staining of the gels,
hydroxylamine oxidoreductase is dissociated but not inac-
tivated by pressure [27].
We believe that the ability to produce native monomers
of enolase depends on at least two factors: the properties of
Fig. 5. Changes in spectral parameters as a function of [Mn
2+
]. Apo-
enolase, prepared by passing a sample of enolase through a small
chelex column, wa s used to prepare samp les containing varying con -
centrations of Mn
2+
. Protein concentration w as 2.2 l
M
.Spectrawere
recorded for each sample after 1 0 min at 10 MPa and after 45 min at
2200 MPa. The fourth derivatives were calculated as described in
Materials and methods. The ch anges in spect ral parameters D1(j)
and D2(h), are expressed as the ratio of the high pressure to low
pressure values.
Fig. 6. Model for the effects of hydrostatic pressure on yeast enolase.
Species in bold a re enzymatica lly active; monomer and monomer*
indicate different conformations of the monomer.
Ó FEBS 2004 Native monomers of yeast enolase produced by pressure (Eur. J. Biochem. 271) 3901
the enzyme and the experimental conditions and approach
used. Tsai et al. [28] have examined the role of the
hydrophobic effect in protein–protein interactions.
Although subunit interfaces are more hydrophobic than
the exposed surface of the protein, they are less hydrophobic
than the interior. In addition, several polar amino acids,
especially arginine, lysine, glutamine and glutamate are
found more frequently at the interface than in the interior.
The degree of hydrophobicity of the i nterface and the
percentage surface area buried at the interface v ary from
protein to protein; as a general rule, the greater the
percentage buried, the greater the degree of hydrophobicity.
Both Tsai et al. [28] and Janin et al. [29] suggest that in
oligomers with large interfaces, the isolated monomers
would be unstable, due to the exposure of the large
hydrophobic surface to solvent. The subunit interface of
yeast e nolase i s s mall by the criteria of Tsai et al. with only
13% of the surface b uried [4]. In addition, there are a large
number of polar groups at the interface, many of which
participate in subunit-subunit hydrogen bonds or electro-
static interactions. E nolase monomers appear t o be
relatively stable under p ressure. E ven the inactive apo-
monomers, formed in the presence of low Mg
2+
or Mn
2+
and held a t 240 MPa for 45 min or more, rapidly and
completely recover both a ctivity a nd spectral properties
upon depressurization. There is no e vidence for irreversi-
bility or Ôconformational driftÕ [30]. In the presence of bound
divalent cation, the monomers remain native, even after
45 min at 220 MPa.
Exposure of a system at equilibrium to increasing
hydrostatic pressure will shift t hat equilibrium towards
the system that occupies the smaller volume. The native
structure of a protein – secondary, tertiary and quaternary
structure – reflects a balance between opposing factors.
Conformational entropy disfavors the native structure,
while van der Waals interactions, electrostatic inter-
actions, hydrogen bonds and hydrophobic interactions are
favorable. Hydrostatic p ressure, by r educing the s ize of
internal cavities, decreases flexibility of the protein core.
At the same time, portions of the p rotein near the surface
become more flexible since pressure promotes hydration
of the protein [31]. Electrostatic inte ractions are disrupted
by pressure, with a DVof)17 to )35 mLÆmol
)1
[32]; this
volume change is d ue to electrostriction of water around
charged groups. Hydrogen bond disruption has a small,
positive DV; these bonds are s trengthened a nd diversified
by pressure [33–36]. The direction and magnitude of the
volume change for disruption o f h ydrophobic bonds is
still under debate [3,37]. Creating active monomers of an
oligomeric enzyme may require selectively disrupting
those interactions that maintain quaternary structure
without perturbing those that maintain tertiary structure.
According to the crystal structures o f yeast enolase, there
are two glutamate and two arginine residues per subunit
that form salt bridges with the two arginine and two
glutamates on the other subunit. Subunit interactions in
yeast enolase are not very strong; in the presence of
1m
M
Mn
2+
, K
d
is 4.5 · 10
)9
and DV ¼ )120 mLÆmol
)1
(Fig. 5). Given the large negative volume change for
disruption of salt bridges, t he pressure-induced dissoci-
ation of yeast enolase may be driven primarily by
disruption of these interactions.
If the monomer of an enzyme maintains the same
secondary and tertiary structure it had in the oligomer,
how will dissociation b e detected? Standard techniques
for monitoring changes in size, such as gel filtration,
fluorescence polarization or dynamic light scattering, are
not widely used. As a result, most pressure studies focus
on conditions in which major spectral changes are
occurring; smaller c hanges occurring in lower ranges of
pressure are often not examined. Interpreting the se small
changes is complicated by the fact that l ow pressure may
affect the structure of an oligomeric protein without
causing dissociation [38]; similarly, pressure can produce
changes in spectra and activity of monomeric enzymes in
the absence of denaturation [39]. W e were fortunate to
find a spectral change that monitored dissociation of
enolase, and to find conditions in which the monomer
was stable.
Although the observed changes in the UV spectrum of
yeast enolase are small, they provide information on the
changes that occur during e xposure to pressure. The first
parameter to change D2, shows a clear d ependence upon
protein concentration, indicating that D2 is monitoring
dissociation of t he protein into monomers. In the 4th
derivative of the U V spectrum, the region of D2, 282–
288 n m, contains contributions from both t yrosine a nd
tryptophan residues [20]. Simulations of the enolase spectra,
using standard spectra of tyrosine and tryptophan in
various solvents, s how t hat t he c hanges i n D2thatare
produced by pressure are due to changes in the environ-
ment of tyrosine residues. In an earlier study [13], we
proposed that the observed decrease in the polarity of the
environment of the tyrosine residues was due to two
residues which point into a cleft, between the subunits, that
is filled w ith immobilized water. U pon dissociation, the
water w ould no l onger be immobilized and its average
polarity would decrease. As far as we can tell from the UV
and fluorescence spectra (not shown), nothing else is
happening to the p rotein at pressures b elow 150 MPa.
The enzyme is b eing dissociated into monomers which
maintain their native conformation.
A comparison of t he results o f apo-enolase [ 12] with
those of enolase in t he presence of 1 m
M
Mg
2+
[12], low
(50 l
M
) and high (1 m
M
)Mn
2+
, gives the following
picture: (a) The presence of divalent cations stabilizes the
dimeric s tructure of enolase, as has been demonstrated
previously [14]. This implies that Me
2+
binds more
tightly to the dimer than to the monomer. (b) The
dimeric structure stabilizes the conformation of enolase;
we do not observe changes in t he spectra until dissoci-
ation occurs. (c) The presence of divalent cations also
stabilizes the monomer of enolase. The stabilizing effect
of the divalent c ation is not a unique property of Mn
2+
,
but is also observed with Mg
2+
.
We can now begin to explain the role of the dimeric
structure of y east enolase. The dimeric structure stabilizes
the structure of the monomer and favors the binding of
divalent cations, which in turn stabilize the dimer.
We find it difficult to believe that there are not other
dimeric proteins that could b e d issociated by pressure
into native monomers. Although the same forces are
involved in maintaining tertiary a nd quaternary structure,
in many cases they will not make the same relative
3902 M. J. Kornblatt et al. (Eur. J. Biochem. 271) Ó FEBS 2004
contributions to both levels of structure. We believe the
key points for success are threefold: (a) finding conditions
that stabilize the monomer without excessively stabilizing
the dimer. This m ay require exploring a range of
temperatures, pH, ion concentrations, etc; (b) examining
with care the pressure range in which major spectral
changes are not occurring and (c) using, under pressure,
techniques s uch as fluorescence polarization [ 11] or
dynamic light scattering that are direct measures of the
size of a protein.
Acknowledgements
We thank C onc ordia Un iversity f or the sabbatical l eave during
which time these experiments were performed, and J. A. Kornblatt
for encouragement. Financial support was provided by the N atural
Sciences and Engineering Research Council of Canada and
INSERM.
References
1. Gross, M. & Jaenicke, R. (1994) Proteins under pressure. Eur. J.
Biochem. 221, 617–630.
2. Mozhaev, V.V., Heremans, K., Frank, J., Masson, P. & Balny, C.
(1996) High pressure e ffects on protein structure and function.
Proteins 24, 81–91.
3. Boonyaratanakornkit, B.B., Park, C.B. & Clark, D.S. (2002)
Pressure e ffects on in tra- and intermole cular interactions within
proteins. Biochim. Biophys. Acta 1595, 235–249.
4. Stec, B. & Lebioda, L., (1990) Refined structure of y east apo-
enolase at 2.25 A
˚
resolution. J. Mol. Biol. 211, 235–248.
5. Zhang, E., Brewer, J.M., M inor, W., Carreira, L.A. & Lebio-
da, L. ( 1997) Mec hanism of enolase: the crystal structure of
asymmetric dimer enolase-2-phospho-
D
-glycerate/enolase-phos-
phoenolpyruvate at 2.0 A
˚
resolution. Biochemistry 36, 12526–
12534.
6. Wedekind, J.E., P oyner, R.R., Reed, G.H. & Rayment, I. (1994)
Chelation o f serine39 to Mg
2+
latches a gate at t he active site of
enolase: structure of the bis (Mg
2+
) complex of yeast e nolase a nd
the i ntermediate analog p hosphono acetohydro xamat e at 2.1 A
˚
resolution. Biochemistry 33, 9333–9342.
7. Duquerroy, S., Camus, C. & Janin, J. (1995) X-ray structure and
catalytic mechanism of lobster enolase. Biochemistry 34, 12513–
12523.
8. Kuhnel, K. & Luisi, B.F. (2001) Crystal structure of the Escher-
ichia coli RNA degradoso me co mpon ent en olase. J. Mol. Biol.
313, 583–592.
9. da Silva Giotto, M.T., Hanna ert, V., d e Vertomm en, D.A.S.,
Navarro, M.V., Rider, M.H., Michels, P.A.M., Garratt, R.C. &
Rigden, D.J. (2003) T he crystal structure of Trypanosoma brucei
enolase: visualisation of t he inhibitory metal binding site III and
potential as target for selective, irreversible inhibition. J. Mol. Biol.
331, 653–665.
10. Brewer, J.M. ( 1985) Specificity and mechanism of action of meta l
ions in yeast enolase. FEBS Lett. 182, 8–14.
11. Paladini, A.A. & Weber, G., (1981) Pressure-induced reversible
dissociation of enolase. Biochemistry 20, 2587–2593.
12. Kornblatt, M.J., Lange, R. & Balny, C., (1998) Can monomers
of yeast enolase have enzymatic activity? Eur. J. Biochem. 251,
775–780.
13. Kornblatt, J.A., Kornblatt, M.J. & Hui Bon Hoa, G. (1995)
Second derivative spectroscopy of enolase at high hydrostatic
pressure: an approach to the study of macromolecular inter-
actions. Biochemistry 34, 1218–1223.
14. Brewer, J.M., Faini, G.J., W u, C.A., Goss, L.P., Carreira, L.A. &
Wojcik, R. (1978) Characterization of the sub unit dissociation
of yeast enolase. I n Physical Aspe cts of P rotein Interactions
(Catsimpoolas, N., ed.), pp. 57–78. Els evier/North-Holland,
Amsterdam.
15. Trepannier, D ., Wong, C. & Kornblatt, M.J. (1990) The salt-
induceddissociationandinactivationofamammalianenolase:
evidence for the formation of active monomers. Arch. Biochem.
Biophys. 283, 271–277.
16. Kornblatt, M.J., Al-Ghanim, A . & Kornblatt, J.A. (1996) The
effects of sodium perchlorate on rabbit muscle enolase: spectral
characterization of the monomer. Eur. J. Biochem. 236, 78–84.
17. Marangos, P.J., Parma, A.M. & Goodwin, F.K. (1978) Func-
tional properties of ne uronal a nd glia l isoenzymes of b rain
enolase. J. Neuroc hem . 31, 727–732.
18. Chorazyczewski, J., Danielewicz, R. & Wolny, M. (1987)
Immobilization of pig muscle enolase. Studies on the activity of
subunits. Acta Biochim. Polon. 34, 421–430.
19. Chin, C.C.Q., Brewer, J.M. & Wold, F., (1981) The a mino acid
sequence of yeast enolase. J. Biol. Chem. 256, 1377–1384.
20. Lange, R., Frank, J., Saldana, J L. & Balny, C. (1996) Fourth
derivative UV-spectroscopy of proteins under high p ressure. I.
Factors affecting the fourth derivative spectrum of the aromatic
amino acids. Eur. Biophys. J. 24, 277–283.
21. Fersht, A. (1999) Structure and Mechanism in Protein Science.
W.H. Freeman, New York.
22. Deville-Bonne, D. & Else, A. (1991) Reversible high hydrostatic
pressure inactivation of phosphofructokina se from Escherichia
coli. Eur. J. Biochem. 200, 747–750.
23. Ruan, K. & Weber, G. (1988) Dissociation of yeast hexokinase by
hydrostatic pressure. Biochemistry 27, 3295–3301.
24. Mu
¨
ller, K., Lu
¨
demann, H D. & Jaenicke, R. (1982) Thermo-
dynamics and mechanism of high-pressure deactivation and
dissociation of p orcine lactic dehydrogenase. Biophys. Chem. 16 ,
1–7.
25. Zhou, J M., Zhu, L. & Balny, C. (2000) Inactivation o f creatine
kinase by high pressure may precede dimer dissociation. Eur. J.
Biochem. 267, 1247–1253.
26. Guy, H.I., Schmidt, B., Herve
´
, G. & Evans, D.R. (1998) Pressure-
induced dissociation o f carbamoyl-pho sphate synthetase do mains.
J. Biol. Chem. 273, 14172–14178.
27. Masson, P., Arciero, D.M., Hooper, A.B. & Balny, C. (1990)
Electrophoresis at elevated hydr ostatic pressure of the multih eme
hydroxylamine oxidoreductase. Electrophoresis 11, 128–133.
28. Tsai, C J., Lin, S.L., Wolfson, H.J. & Nussinov, R. (1997) Studies
of p rotein–prote in interfaces: a statistical an alysis of the hydro-
phobic effect. Protein Sci. 6, 53–64.
29. Janin, J., Miller, S. & Clothia, C., (1988) Surface, subunit inter-
faces and in terior of oligomeric proteins. J. Mol. Biol. 204,
155–164.
30. Silva, J.L., Miles, E.W. & Weber, G. (1986) Pressure dissociation
and conformational drift of th e beta dimer of tryptophan syn-
thase. Biochemistry 25 , 5780–5786.
31. Cioni, P. & Strambini, G.B. (1994) Pre ssure effects on protein
flexibility monomeric p roteins. J. Mol. Biol. 242, 291–301.
32. Heremans, L. & Heremans, K. (1989) Raman s pectrosc opic study
of the changes in secondary structure of chymotrypsin: effect of
pH and p ressure on the salt bridge. Biochim. Biophys. Acta 999,
192–197.
33. Kitchen, D.B., R eed, L.H. & Levy, R.M. (1992) Molecular
dynamics simulation of solvatedproteinathighpressure.Bio-
chemistry 31, 10083–10093.
34. Li, H., Yamada, H. & Akasaka, K. (1998) Effect of pressure on
individual hyd rogen bonds in proteins. Basic pancreatic trypsin
inhibitor. Biochemistry 37, 1167–1173.
Ó FEBS 2004 Native monomers of yeast enolase produced by pressure (Eur. J. Biochem. 271) 3903
35. Kundrot, C.E. & Richards, F.M. (1988) Effect of hydrostatic
pressure o n the solvent in crystals of hen egg-white lysozyme.
J. Mol. Biol. 200, 401–410.
36. Paci, E. (2002) High pressure simulations of biomolecules. Bio-
chim. Biophys. Acta 1595, 185–200.
37. Royer, C.A. (2002) Revisiting volume changes in pressure-induced
protein unfolding. Biochim. Biophys. Acta 1595, 201–209.
38. Cioni, P. & Strambini, G.B. (1996) Pressure e ffects on the structure
of oligomeric proteins prior to subunit dissociation. J. Mol. Biol.
263, 789–799.
39. Fujiwara, S., Kunugi, S., Oyama, H. & Oda, K. (2001) Effects of
pressure on the act ivity and spectroscopic properties of carboxyl
proteinases. Eur. J. Biochem. 268, 645–655.
3904 M. J. Kornblatt et al. (Eur. J. Biochem. 271) Ó FEBS 2004