Báo cáo khoa học: Oligosaccharide synthesis in Fibrobacter succinogenes S85 and its modulation by the substrate potx
Bạn đang xem bản rút gọn của tài liệu. Xem và tải ngay bản đầy đủ của tài liệu tại đây (475.96 KB, 12 trang )
Oligosaccharide synthesis in Fibrobacter succinogenes
S85 and its modulation by the substrate
Re
´
gis Nouaille
1,2
, Maria Matulova
1,3
, Anne-Marie Delort
1
and Evelyne Forano
2
1 Laboratoire de Synthe
`
se et Etude de Syste
`
mes a
`
Inte
´
re
ˆ
t Biologique, UMR 6504 Universite
´
Blaise Pascal – CNRS, 63177 Aubie
`
re cedex,
France
2 Unite
´
de Microbiologie, INRA, Centre de Recherches de Clermont-Ferrand-Theix, 63122 Saint-Gene
`
s-Champanelle, France
3 Institute of Chemistry, Slovak Academy of Sciences, Dubravska cesta 9, 842 38 Bratislava, Slovak Republik
Cellulolytic bacteria play an important role in nature,
borne out by the fact that microbial cellulose utiliza-
tion is responsible for one of the largest material flows
in the biosphere. Cellulolytic bacteria have thus been
studied in detail, but, because of methodological diffi-
culties in using solid cellulosic substrates, the majority
of the studies were carried out on bacteria utilizing sol-
uble substrates [1]. When data are available, it appears
that most of the statements and concepts applicable to
cellulolytic bacteria metabolizing soluble carbohydrates
are not applicable to bacteria using cellulosic substrate
[1]. In previous work, we showed that Fibrobacter suc-
cinogenes S85, a cellulolytic rumen bacterium, was able
to synthesize and release oligosaccharides, identified by
2D-NMR techniques as maltodextrins (MD) and
maltodextrin-1-phosphate (MD1P), upon incubation
with glucose [2,3]. On the contrary, no cellodextrins
were released by the bacteria. The synthesis of MD
and MD1P was unexpected in a strain specialized in
cellulose degradation and known to be unable to use
maltose and starch [4]. These results prompted us to
investigate whether such MD and MD1P were pro-
duced in bacteria metabolizing their natural substrate,
cellulose. More precisely, the objectives were to answer
the following questions (i) is the synthesis of MD and
MD1P a specific feature of bacteria metabolizing glu-
cose, or does it occur also on other carbohydrates, (ii)
is F. succinogenes able to utilize these MDs as a carbon
source, (iii) are cellodextrins produced when bacteria
degrade cellulose, and (iv) are such observations physio-
Keywords
cellodextrin; Fibrobacter succinogenes S85;
maltodextrin; NMR; rumen
Correspondence
A M. Delort, Laboratoire de Synthe
`
se et
Etude de Syste
`
mes a
`
Inte
´
re
ˆ
t Biologique,
UMR 6504 Universite
´
Blaise Pascal – CNRS,
63177 Aubie
`
re cedex, France
Fax: +33 473 407717
Tel: +33 473 407717
E-mail:
(Received 15 December 2004, revised
1 March 2005, accepted 14 March 2005)
doi:10.1111/j.1742-4658.2005.04662.x
In this article we compared the metabolism of phosphorylated and
unphosphorylated oligosaccharides (cellodextrins and maltodextrins) in
Fibrobacter succinogenes S85 resting cells incubated with the following
substrates: glucose; cellobiose; a mixture of glucose and cellobiose; and
cellulose. Intracellular and extracellular media were analysed by
1
H-NMR
and by TLC. The first important finding is that no cellodextrins were
found to accumulate in the extracellular media of cells, regardless of the
substrate; this contrasts to what is generally reported in the literature.
The second finding of this work is that maltodextrins of degree of poly-
merization > 2 are synthesized regardless of the substrate, and can be
used by the bacteria. Maltotriose plays a key role in this metabolism of
maltodextrin. Maltodextrin-1-phosphate was detected in all the incuba-
tions, and a new metabolite, corresponding to a phosphorylated glucose
derivative, was produced in the extracellular medium when cells were
incubated with cellulose. The accumulation of these phosphorylated
sugars increased with the degree of polymerization of the substrate.
Abbreviations
cellobiose, 4-O-b-
D-glucopyranosyl-D-glucose; DP, degree of polymerization; ge-DQF COSY, gradient-enhanced double quantum filtered
1
H-
1
H
correlated COSY; ge-HSQC, gradient-enhanced single quantum coherence
1
H-
13
C; Glc1P, glucose-1-phosphate; Glc6P, glucose-6-phosphate;
MD1P, maltodextrin-1-phosphate; MD, (malto-oligosaccharides) linear maltodextrins; MD
t
, the terminal Glc unit of MD; MD
int
, internal Glc
units of MD and MD1P; TSP-d
4
, sodium 3-(trimethylsilyl)propionate-d
4
; X, unknown glucose-1-phosphate derivative.
2416 FEBS Journal 272 (2005) 2416–2427 ª 2005 FEBS
logically relevant for life in the rumen where cellulose
is the main carbon source?
To answer these questions, F. succinogenes resting
cells were incubated with cellulose and with cellobiose
(the main product of cellulolysis), and with a mixture
of glucose and cellobiose. Cell extracts and extracellu-
lar media were analysed by 2D NMR spectroscopy
and by TLC to identify and quantify the oligosaccha-
rides produced.
Results
Synthesis of MDs and phosphorylated sugars
Incubation in medium containing soluble sugars
Resting cells (6 mgÆmL
)1
of protein) of F. succinogenes
S85 were incubated anaerobically with 32 mm glucose
or 16 mm cellobiose, or with a mixture of 16 mm glu-
cose and 8 mm cellobiose, in order to maintain the
same glucose unit concentration. Samples of the cell
suspension were taken at regular time-points, and
extracellular and intracellular media (see the Experi-
mental procedures) were separated by centrifugation
and analysed, in parallel, by
1
H NMR spectroscopy
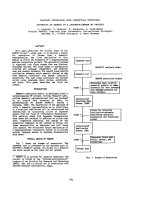
and by TLC. Consumption of the substrates and pro-
duction of the final metabolites (succinate and acetate)
were quantified from integrals in 1D
1
H NMR spectra
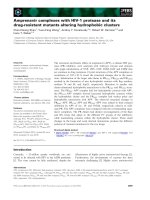
(Fig. 1). Under these three different substrate condi-
tions, the same concentrations of succinate and acetate
were produced in the extracellular medium (Fig. 1B).
Figure 1A shows that glucose was metabolized faster
than cellobiose: when glucose or cellobiose were used
as the only substrate, the rates of their utilization were
0.10 lmolÆmg of protein
)1
Æmin
)1
and 0.06 lmolÆmg of
protein
)1
Æmin
)1
, respectively, while the rates were
0.05 lmolÆmg of protein
)1
Æmin
)1
and 0.03 lmolÆmg of
protein
)1
Æmin
)1
when these two sugars were used sim-
ultaneously. It should also be noted that the rate of
utilization of these sugars is two times slower when
they are used as part of a mixture.
Detailed investigation of supernatant and cell extract
composition was carried out using
1
H NMR gradient-
enhanced double quantum filtered
1
H-
1
H correlated
COSY (ge-DQF COSY) and
1
H-
13
C gradient-enhanced
single quantum coherence
1
H-
13
C (ge-HSQC) spectra;
identification of the various sugars was as described in
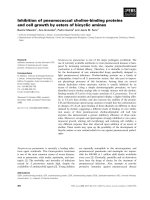
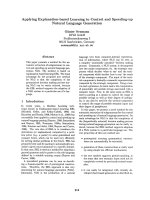
detail previously [3]. Figure 2 shows the region of
ge-DQF COSY NMR spectra that allowed a quantita-
tive H1 ⁄ H2 cross-peak analysis of MDs, MD1P and
glucose-1-phosphate (Glc1P) [3]. The same products
were found under all three conditions of incubation
(Fig. 2A–C). MDs and MD1P, which were first des-
cribed when the cells metabolized glucose, were also
found in both the intracellular and extracellular media
of cells metabolizing cellobiose or a mixture of the two
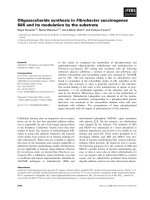
sugars. Figure 3 shows the concentration of sugars
obtained after cross-peak integration of the identified
species in 2D ge-DQF COSY NMR spectra. It should
be noted that the concentrations of all the intracellular
sugars are much higher ( 30-fold) than those of the
extracellular sugars. Furthermore, the ratio of phos-
phorylated sugars (including Glc1P and MD1P) vs.
MD is much higher in the supernatants than in the
cells. This ratio increases when the substrates are chan-
ged from glucose (Fig. 3A) to cellobiose (Fig. 3B); an
0
5
10
15
20
25
30
A
B
0 10203040
time (min)
010203040
time (min)
concentration (mM)
0
5
10
15
20
25
30
concentration (mM)
Fig. 1. Time dependence of sugar consumption (A) and metabolite
production (B). Fibrobacter succinogenes cells were incubated with
32 m
M glucose (white symbols), 16 mM cellobiose (black symbols),
or a mixture of glucose (16 m
M) and cellobiose (8 mM) (grey sym-
bols). (A) Consumption of glucose (squares) and cellobiose (tri-
angles). (B) Production of succinate (squares) and acetate (circles).
Glucose was assayed by using an enzymatic kit (Roche Diagnos-
tics, Meylan, France); the concentrations of cellobiose, acetate and
succinate were measured from 1D
1
H NMR spectra.
R. Nouaille et al. Cellulose metabolism in Fibrobacter succinogenes S85
FEBS Journal 272 (2005) 2416–2427 ª 2005 FEBS 2417
3.45
S
S
S
S
MD-1P
a
+Glc1P
MD-1P
a
+Glc1P
MD-1P
b
MD-1P
b
MD
t
X
MD
int
MD
t
X
MD
int
E
E
E
E
A
B
C
D
3.50
3.55
3.60
3.65
3.70
ppm
3.45
3.50
3.55
3.60
3.65
3.70
5.55 5.50 5.45 5.40
5.55 5.50 5.45 5.40
5.55 5.50 5.45 5.40
5.55 5.50 5.45 5.40
5.55 5.50 5.45 5.40
5.55 5.50 5.45 5.40
5.55 5.50 5.45 5.40
5.55 5.50 5.45 5.40
ppm
ppm
ppm
ppm
ppm
ppm
ppm
ppm
ppm
ppm
ppm
ppm
ppm
ppm
ppm
3.45
3.50
3.55
3.60
3.65
3.70
3.45
3.50
3.55
3.60
3.65
3.70
3.45
3.50
3.55
3.60
3.65
3.70
3.45
3.50
3.55
3.60
3.65
3.70
3.45
3.50
3.55
3.60
3.65
3.70
3.45
3.50
3.55
3.60
3.65
3.70
Cellulose metabolism in Fibrobacter succinogenes S85 R. Nouaille et al.
2418 FEBS Journal 272 (2005) 2416–2427 ª 2005 FEBS
intermediary situation is observed with a mixture of
the two sugars (Fig. 3C). Note that, for clarity, ‘MD’
is used here for both maltose and MDs of larger size,
and that, similarly, MD1P is used for both maltose-1P
and MD1P of degree of polymerization (DP) > 2.
The evolution of the various metabolite concentrations
with time were similar regardless of the substrates
used: they increased with time in the extracellular
media, while in the cells they decreased at the end of
the incubations.
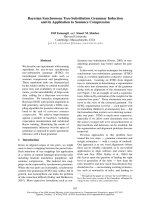
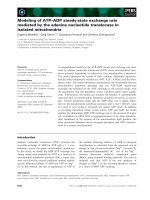
Figure 4 shows TLC analyses of supernatants and
cell extracts obtained following the incubation of rest-
ing F. succinogenes with glucose (Fig. 4A), cellobiose
(Fig. 4B), or glucose and cellobiose (Fig. 4C). Spots
corresponding to MDs were detected and, in all cases,
they had the same lengths, ranging from maltotriose to
maltoheptaose. No maltose was detected, either in the
supernatant or in the cell extracts, following incuba-
tion with glucose. Maltose was not detected in cell
extracts following incubation with cellobiose, or glu-
cose and cellobiose. In the corresponding supernatants,
spot T2 was cellobiose as its intensity decreased with
time. Only maltotriose was present in the cell extracts
of all incubations. In the supernatant obtained after
incubation with cellobiose, the intensities of MD spots
seemed to be lower (Fig. 4B), in agreement with the
decrease of the terminal Glc unit of MD (MD
t
) and of
the internal Glc units of MD and MD1P (MD
int
)
cross-peaks in NMR spectra (Fig. 2B, plot S).
The two large spots (spot 1 and spot 2), previously
observed following incubation with glucose [3], were
also detected in cells metabolizing cellobiose (Fig. 4B)
or a mixture of glucose and cellobiose (Fig. 4C). Spot 1
was present in both supernatants and cell extracts,
while spot 2 was found only in the cells. The spots were
previously shown to contain phosphorylated sugars. In
the case of incubation with glucose, spot 1 was shown
to include Glc1P, Glc6P and MD1P [3]. As these phos-
phorylated sugars were detected in 2D NMR spectra of
cellobiose incubation media, we can assume that they
are also present in spot 1 of the corresponding TLC.
Unfortunately, under these TLC conditions it was not
possible to separate MD1P according to their length.
The kinetics of production of the different metabo-
lites was not changed significantly by the nature of the
substrate.
Incubation in medium containing cellulose
Resting cells of F. succinogenes (10 mgÆmL
)1
of pro-
tein) were preincubated with 0.2 g of cellulose (Sigma-
cell 20), for 1 h in order to allow a maximal adhesion
of the bacteria to cellulose [5,6]. Then, centrifugation
was carried out to separate adherent and nonadherent
cells. As shown previously, under these conditions only
one-third of the bacteria were adherent to cellulose [5].
Adherent cells (final concentration 3.5 mgÆmL
)1
of
protein) were then further incubated with their sub-
strate for 3 h. Samples of the incubation were taken at
1, 2 and 3 h, and extracellular and intracellular media
were separated by centrifugation and analysed in par-
allel by
1
H NMR spectroscopy and by TLC. Under
these conditions, 12.5 mm succinate was produced in
the extracellular medium after 3 h of incubation. With
respect to the cell concentration (3.5 mgÆmL
)1
of pro-
tein) which was 1.7 times lower than that of the cells
incubated with soluble sugars (6 mgÆmL
)1
of protein),
the production of succinate after 3 h of incubation
with cellulose (21 mm) was comparable to that
obtained after 40 min of incubation with soluble
sugars (19 mm, Fig. 1B). Consequently, we decided to
compare the production of other metabolites, including
Glc1P, MDs and MD1P, when soluble sugars and cel-
lulose were metabolized by F. succinogenes S85.
In the 2D
1
H NMR spectra of samples collected after
3 h of incubation with cellulose (Fig. 2D), the same
metabolites were identified as occurring after incu-
bation with glucose or cellobiose (Fig. 2A,B) or their
mixture (Fig. 2C). However, in the spectrum of the
supernatant (Fig. 2D, panel S) a new, high-intensity
H1 ⁄ H2 cross-peak appeared at 5.46 ⁄ 3.48 p.p.m.
Although the structure of this new metabolite (named
X) was not completely determined, both the H1 ⁄ H2
chemical shift values and the same cross-peak pattern
as that of Glc1P indicated that Glc1P was a part of the
X molecule. X was thus a Glc1P derivative. A precise
quantification of signals was carried out by 2D
1
H NMR. As already noted for incubation with
soluble sugars, the intracellular concentrations were
much higher than the extracellular concentrations
(Fig. 3D). In the extracellular medium (Fig. 3D, panel
S), metabolite X was the major product, while it could
not be detected in the cells (Fig. 3D, panel E). The ratio
Fig. 2. a-Anomeric region of gradient-enhanced double quantum filtered
1
H-
1
H correlated COSY (ge-DQF COSY) NMR spectra of supernatant
(S) and cell extract (E). Incubation of Fibrobacter succinogenes resting cells for 40 min with 32 m
M glucose (A), 16 mM cellobiose (B), or a mix-
ture of 16 m
M glucose and 8 mM cellobiose (C), and for 3 h with 0.2 g of cellulose Sigmacell 20 (Sigma-Aldrich, Saint Quentin Fallavier, France)
(D). Glc1P, glucose-1-phosphate; MD1P, maltodextrin-1-phosphate; MD1P
a
, Glc1P unit of MD1P; MD1P
b
, Glc unit neighbouring the Glc1P of
MD1P; MD, linear maltodextrins; MD
t
, the terminal Glc unit of MD; MD
int
, internal Glc units of MD and MD1P. X, unknown Glc1P derivative.
R. Nouaille et al. Cellulose metabolism in Fibrobacter succinogenes S85
FEBS Journal 272 (2005) 2416–2427 ª 2005 FEBS 2419
45
37.5
30
22.5
15
7.5
0
45
37.5
30
22.5
15
7.5
0
45
37.5
30
22.5
15
7.5
0
60
52.5
45
37.5
30
22.5
15
7.5
0
1.5
1.25
1
0.75
0.5
0.25
concentration (mM)concentration (mM)
concentration (mM)concentration (mM)
concentration (mM) concentration (mM) concentration (mM) concentration (mM)
0
01020
time (min)
S
A
B
C
D
S
S
SE
E
E
E
time (min)
time (min) time (min)
30 40 0 10 20 30 40
0 10 20 30 40 0 10 20 30 40
0 10 20 30 40 0 10 20 30 40
123 12
time (h)time (h)
3
1.5
1.25
1
0.75
0.5
0.25
0
1.5
1.25
1
0.75
0.5
0.25
0
2
1.75
1.5
1.25
1
0.75
0.5
0.25
0
Fig. 3. Time courses of the concentrations of glucose-1-phosphate (Glc1P) (black squares), maltodextrin-1-phosphate (MD1P) (stripped),
maltodextrin (MD) (empty squares) and X (light grey). Supernatants (S) and cell extracts (E) were obtained after the incubation of Fibrobacter
succinogenes resting cells for 40 min with 32 m
M glucose (A), 16 mM cellobiose (B), or a mixture of 16 mM glucose and 8 mM cellobiose
(C), and for 3 h with 0.2 g of cellulose Sigmacell 20 (D). Quantification of metabolite concentrations was obtained by integrating 2D NMR
signal volumes. For the supernatants obtained, values were directly reported, while for cell extracts, the intracellular concentrations were cal-
culated relative to an intracellular volume of 5.5 lLÆmg
)1
of protein [21]. In the case of Sigmacell 20 cellulose, obtained and calculated values
were multiplied by 1.7 to take into account the lower cell concentration. X, unknown Glc1P derivative.
Cellulose metabolism in Fibrobacter succinogenes S85 R. Nouaille et al.
2420 FEBS Journal 272 (2005) 2416–2427 ª 2005 FEBS
of phosphorylated sugars (Glc1P, md1P and X) vs. MD
was also much higher in supernatants than in cell
extracts. This ratio was dramatically increased following
incubation with cellulose compared to incubation with
glucose or cellobiose.
All the metabolite concentrations increased with
time in the supernatant; the concentration of metabo-
lite X increased by sevenfold between 1 and 2 h of
incubation and reached its maximum after 3 h of incu-
bation.
TLC experiments confirmed the presence of spot 1
and spot 2 in these incubations with cellulose (data
not shown).
Synthesis of cellodextrins
The synthesis of cellodextrins was monitored by
1
H
NMR spectra after incubation with various substrates:
glucose, cellobiose, a mixture of glucose and cellobiose,
and cellulose; the spectra of supernatants and cell
extracts after 40 min of incubation are shown in Fig. 5.
The H1 signal of nonreducing end glucose units of cello-
biose or cellodextrins resonating at d 4.52 p.p.m. was
used to monitor the metabolism of these sugars. In
the spectra of supernatants after incubation with cello-
biose, the
1
H signal at 4.52 p.p.m. was detected at the
start of the incubation; it decreased with time and was
barely detectable at 40 min (Fig. 5B, plots S). The
kinetics of disappearance of this signal was consistent
with the consumption of cellobiose without simulta-
neous accumulation of cellodextrins in the supernatant
(Fig. 1A). Consequently, we assumed that no cello-
dextrins were produced in the supernatants of cells
metabolizing cellobiose. Similarly, no cellodextrins were
produced in the supernatants of cells metabolizing glu-
cose and a mixture of glucose and cellobiose (Fig. 5A,C,
plot S). When cells metabolized cellulose, the signal at
4.52 p.p.m. was not detected at any point in the kinetics
(Fig. 5D, plot S). This result showed that no cello-
dextrins accumulated in the extracellular medium when
cellulose was used as substrate. We recently showed that
a low concentration of cellodextrins was present in cell
extracts when cells metabolized glucose [2]. The pres-
ence of cellodextrins was also confirmed in the spectra
of cell extracts obtained after incubation with the four
different substrates tested (Fig. 5A–D, plots E), in
agreement with this previous finding.
Following culture with the four different substrates
(Fig. 5A–D), MD and MD1P H1 signals were clearly
seen in
1
H NMR spectra.
Glc
T2
M3
M4
M5
M6
Spot 1
Spot 2
AB
S
C
Glc
T2
M3
M4
M5
M6
Spot 1
Spot
2
0 10 20 30 40 50 0 10 20 30 40 50 0 10 20 30 40 50 0 10 20 30 40 50 0 10 20 30 40 50 0 10 20 30 40 50
time (min)
SE
ES
ES
Fig. 4. TLC of saccharide derivatives present in supernatants (S) or cell extracts (E). Incubation of Fibrobacter succinogenes resting cells with
32 m
M glucose (A), 16 mM cellobiose (B), or a mixture of 16 mM glucose and 8 mM cellobiose (C). Glc, glucose; T2, disaccharide; M3, malto-
triose; M4, maltotetraose; M5, maltopentaose; M6, maltohexaose; Spot 1, Spot 2, spots containing phosphorylated sugar species. The same
amount of sample was spotted on TLC and the same treatment (intensity and contrast) was applied to the different images.
R. Nouaille et al. Cellulose metabolism in Fibrobacter succinogenes S85
FEBS Journal 272 (2005) 2416–2427 ª 2005 FEBS 2421
Incubation with maltose and MDs
It has previously been shown that F. succinogenes S85
was not able to grow on maltose [4], but as MD syn-
thesis was clearly shown under various conditions, we
decided to test the ability of the strain to grow on dif-
ferent MDs, ranging from maltotriose to maltohexaose
alone, or in a mixture. The largest MD tested was
maltohexaose, as it was considered in Escherichia coli
as the maximal length able to cross the maltoporin,
Fig. 5. 1D
1
H NMR spectra of supernatant (S) and cell extract (E). Incubation of Fibrobacter succinogenes resting cells for 40 min with 32 mM
glucose (A), 16 mM cellobiose (B), or a mixture of 16 mM glucose and 8 mM cellobiose (C), and for 3 h with 0.2 g of cellulose Sigmacell 20
(D). CD, cellodextrins; Glc1P, glucose-1-phosphate; MD, linear maltodextrins; MD1P, maltodextrin-1-phosphate. *The presence of CD signals.
Cellulose metabolism in Fibrobacter succinogenes S85 R. Nouaille et al.
2422 FEBS Journal 272 (2005) 2416–2427 ª 2005 FEBS
LamB [7]. The results are reported in Table 1. We also
verified that F. succinogenes S85 was not able to grow
on starch (data not shown). Growth and metabolism
were monitored by measuring the attenuance (D)at
600 nm and by succinate and acetate assays from
1
H
NMR spectra, respectively. Maltodextrins of DP > 2
were clearly metabolized by the cells, as shown by the
following that (i) their presence allowed the mainten-
ance of cells in a metabolically active state as acetate
and succinate were produced, (ii) an increase in D
600
(maximal increase of 0.2) was observed, suggesting
slight growth (data not shown) and (iii) bacteria cul-
tured in the presence of MDs of DP > 2 could grow
rapidly when subcultured on cellobiose (D
600
of > 1.5)
and produced large amounts of succinate and acetate
(Table 1). On the contrary, no growth was observed in
a culture medium containing maltose, and no acetate
and succinate were produced. In addition, when cells
were first incubated with maltose and then subcultured
on cellobiose, no growth was observed, indicating that
the cells were no longer viable. Also, under these con-
ditions, the amount of acetate and succinate produced
was much lower when compared to that produced
when cells were first cultured with maltotriose, malto-
tetraose or maltohexaose. Moreover, on MDs of
DP > 2, the acetate : succinate ratio (> 1) was
inverted compared to that measured after culture on
glucose or cellobiose (< 1). This shift to acetate pro-
duction could be explained by a need for ATP produc-
tion to maintain cell survival.
From the results obtained above, there are two stri-
king points concerning MD chain lengths, namely (i)
maltose was not used for growth and was not present
in either the supernatant or in the cell extracts of rest-
ing cells incubated with or without glucose, and
(ii) maltotriose was the minimum MD ‘building block’
allowing bacterial metabolism and observed in cell
extracts, and only MDs of DP > 3 were detected in the
extracellular medium (Fig. 4). These observations
prompted us to design experiments to test the minimum
MD length necessary to promote their synthesis. There-
fore, resting cells were incubated with 16 mm maltose
(Fig. 6A), 11 mm maltotriose (Fig. 6B) and 8 mm
maltotetraose (Fig. 6C); these concentrations are all
equivalent to 32 mm glucose. In all the samples, the
metabolites previously observed were present, including
MDs, glucose, spot 1 and spot 2. When incubated with
maltose (Fig. 6A), the spots were similar to those
formed in the absence of exogenous substrate (Fig. 4B).
This fact suggests their origin in endogenous glycogen
degradation. TLC clearly showed that, although malt-
ose was able to enter the cell, it was not used as the
smallest substrate for the synthesis of longer MDs in
either the extracellular or the intracellular compart-
ment. These MDs probably came from endogenous
glycogen. On the contrary, in the case of incubation
with maltotriose (Fig. 6B) and maltotetraose (Fig. 6C),
the spots were larger than those in Fig. 6A,B. This
showed that maltotriose and maltotetraose, which were
also transported into the bacteria, were used to synthes-
ize longer MDs: these MDs (mainly maltotetraose,
maltopentaose and maltohexaose, but also longer
chains in lower concentrations) were present both in
supernatants and in the cell extracts (Fig. 6B,C). Again,
no maltose was detected while glucose was present.
Discussion
It is usually assumed that the degradation of cellulose
by F. succinogenes produces cellodextrins that are
released into the medium [8]. In a previous work, we
were unable to detect cellodextrins, but found MDs
and MD1P, in culture media from F. succinogenes cells
incubated with glucose. In the present study we pro-
vide further evidence that cellodextrins are released on
neither cellobiose nor cellulose, i.e. the natural sub-
strate in the rumen. A small amount of cellodextrins
was detected in cell extracts, but the absence of detect-
able cellodextrins in the medium, regardless of the type
of carbon source, suggests that these compounds are
used internally rather than released into the medium.
The present work provides further details regarding
the metabolism of MDs in F. succinogenes. These
Table 1. Production of succinate and acetate by Fibrobacter succin-
ogenes grown on various carbon sources. CB, cellobiose; Glc, glu-
cose; M2, maltose; M3, maltotriose; M4, maltotetraose; M6,
maltohexaose or a mixture of maltodextrins (M2M3, M2M4, M3M4
and M3M6). M to CB means that bacteria were first grown on the
carbon source M and then subcultured on cellobiose. Succinate
and acetate concentrations were determined from
1
H NMR spectra
of the culture media after 48 h. Average standard deviations were
± 0.7 and 0.2 for acetate and succinate, respectively.
Concentration ⁄ m
M Concentration ⁄ mM
Sugar Succinate Acetate Sugar Succinate Acetate
No 0.0 0.0
Glc 12.6 6.4
CB 13.6 6.5
M2 0.0 0.0 M2 to CB 0.4 1.1
M3 0.9 1.5 M3 to CB 8.5 5.7
M4 0.5 1.4 M4 to CB 8.9 5.5
M6 0.5 2.1 M6 to CB 9.0 6.0
M2M3 1.4 2.9 M2M3 to CB 9.4 6.2
M2M4 1.5 3.0 M2M4 to CB 9.2 5.9
M3M4 1.0 2.1 M3M4 to CB 8.3 4.2
M3M6 1.3 2.0 M3M6 to CB 8.7 6.0
R. Nouaille et al. Cellulose metabolism in Fibrobacter succinogenes S85
FEBS Journal 272 (2005) 2416–2427 ª 2005 FEBS 2423
compounds were synthesized from either glucose or
cellobiose, or cellulose, with DP ranging from 3 to 7,
regardless of the sugar. They were detected both in
cell extracts and in media but, interestingly, maltotri-
ose (DP 3) was found only in cell extracts. Maltose
was detected in neither the cell extracts nor media.
F. succinogenes did not grow when MDs were provi-
ded as carbon sources, but MDs of DP ‡ 3 did main-
tain cells in an active metabolic state. In addition, the
elongation of MD chains was observed when the MD
primers had a DP of ‡ 3. Taken together, these obser-
vations suggest that maltotriose is a key oligomer for
MD metabolism in F. succingenes, having the mini-
mum size required for chain elongation or to support
bacterial metabolism, whereas maltose is not used.
The situation in this bacterium may share some anal-
ogy with the amylomaltase (MalQ) (EC 2.4.1.25) sys-
tem of E. coli, where maltotriose is the shortest
oligomer substrate for chain elongation [7]. An ortho-
log of malQ is found in the genome of F. succino-
genes, sharing 30% homology, but the inability of
maltose and longer MDs to sustain growth, as well
as the apparent lack of any role for maltose, makes
the MD metabolism in this bacterium different from
that depicted in E. coli.
In addition to MDs, F. succinogenes synthesizes and
releases a number of phosphorylated sugars, including
Glc1P, MD1P, and some compounds that still remain
to be identified. All of these metabolites are found
both in cell extracts and in extracellular media, sug-
gesting that they are generated inside the cells before
being released into the medium, but it cannot be exclu-
ded that they might be – at least partly – also gener-
ated extracellularly. The accumulation of Glc1P is
likely to result from the action of cellobiose phos-
phorylase (EC 2.4.1.20) when the carbon source is
cellobiose. Indeed, intracellular accumulation and
excretion of Glc1P and Glc6P were previously des-
cribed in F. succinogenes metabolizing cellobiose [9,10].
Cellobiose phosphorylase may be responsible for the
Glc1P accumulation on cellulose, provided that cello-
biose is produced, but because the main products of
cellulolysis are cellodextrins, a cellodextrin phosphory-
lase (EC 2.4.1.49) could be additionally involved. The
two enzymes are often found in anaerobic cellulolytic
bacteria [1,11,12]. The export of Glc1P may be caused
by a specific permease, such as that reported to occur
for Glc6P in E. coli [13].
The synthesis and release of MD1P is more puzzling.
We previously hypothesized that these compounds
0 10 20 40 0 10 20 40 standards 0 10 20 40 0 10 20 40 0 10 20 30 40 0 10 20 30 40
time (min) time (min)
Glc
M2
M3
M4
M5
M6
Spot 1
Spot 2
A
BC
S S SE EE
Fig. 6. TLC of saccharide derivatives present in supernatants (S) or cell extracts (E). Incubation of Fibrobacter succinogenes resting cells with
16 m
M maltose (A), 11 mM maltotriose (B) or 8 mM maltotetraose (C). Samples taken at the same time-points were applied to the TLC. Glc,
glucose; M2, maltose; M3, maltotriose; M4, maltotetraose; M5, maltopentaose; M6, maltohexaose; Spot 1, Spot 2, spots containing phos-
phorylated sugar species. Standards: Glc, M2, M3. Note that the intensity and contrast of the image presented in panel A are higher than
those shown in panels B and C, although the sample deposits were similar.
Cellulose metabolism in Fibrobacter succinogenes S85 R. Nouaille et al.
2424 FEBS Journal 272 (2005) 2416–2427 ª 2005 FEBS
might be intermediates of MD synthesis [3], and the
occurrence of both MDs and MD1P in all situations
examined here is consistent with such a hypothesis.
Because we previously reported such synthesis for glu-
cose, a soluble sugar not relevant to the physiology of
F. succinogenes in the rumen, the present work was ini-
tially undertaken in order to assess whether the synthe-
sis of such compounds was relevant to cells utilizing
cellulose or cellulose-like compounds (i.e. cellobiose).
The results showed not only that MD1P were synthes-
ized on both cellobiose and cellulose, but also that the
amounts of MD1 P produced increased with the com-
plexity of the substrate (cellulose>cellobiose>glucose).
The latter observation also holds for the other phos-
phorylated sugars detected. All these results are consis-
tent with a physiological role of MD1P synthesis for
F. succinogenes cells living in the rumen.
In addition, the conditions of incubation with cellu-
lose are different from those of soluble sugars, namely
(i) adherent cells to a solid support can display a dif-
ferent metabolism to planktonic cells [5], and (ii) dur-
ing the whole incubation time the substrate is not
limiting in the case of cellulose, while this is not the
case for soluble sugars. This great difference of incuba-
tion conditions might also explain the increase of
MD-1P concentration and the presence of compound
X when cells metabolized cellulose. It can be also
noted that the MD ⁄ MD1P ratio decreased with the
sugar size, reaching a ratio of 1.0 in the case of cellu-
lose. Two interpretations of this can be given, namely
(i) the length of MD1P decreased, or (ii) the concen-
tration of MD decreased, suggesting that MD might
be phosphorylated.
F. succinogenes plays a key role in the rumen by
degrading cellulose into metabolic products that are
available to noncellulolytic species such as Streptococ-
cus bovis, Selenomonas ruminantium or Treponema bry-
antii, which have been shown to grow on cellulose in
the presence of F. succinogenes [8,14,15]. It is usually
accepted that cellodextrins are responsible for such
cross-feeding effects. From the results presented here,
where both MDs and MD1P, but not cellodextrins,
were released by F. succinogenes metabolizing cellulose,
we hypothesize that MDs and MD1P, rather than cel-
lodextrins, may be responsible for such effects. Indeed,
Strep. bovis is a major starch-degrading rumen bacter-
ium and probably utilizes MDs efficiently. Several
strains of Sel. ruminantium have been shown to be able
to use MDs [16]. In addition, our hypothesis is consis-
tent with the observation that starch-degrading bac-
teria are always found in high numbers, together with
cellulolytic bacteria, in animals fed a cellulose-rich diet
[17]. Further investigations should be undertaken to
investigate the contribution of MD1P into the
exchange of carbon between F. succinogenes and other
rumen microorganisms.
In conclusion, we showed that, contrary to what
was previously thought, cellodextrins do not accumu-
late in the extracellular medium of cells degrading cel-
lulose. In addition, we showed that maltotriose plays a
key role in MD metabolism in F. succinogenes. Finally,
the two main findings in this work are the detection of
unusual phophorylated sugars (MD1P and X), and
their differential accumulation, depending on the sub-
strate. These results open new perspectives for the
understanding of modulation of metabolism by the
substrate, particularly the increase in production of
phosphorylated species with the degree of polymeriza-
tion of the b(1,4) saccharide. Also, the origin and the
role of these phosphorylated sugars remains to be dis-
covered; they might be involved in the regulation of
specific gene expression, or in signalling mechanisms.
In current studies we are analysing sugar metabolism
in growing cells to check whether the presence of phos-
phorylated metabolites and the absence of cellodextrins
in the culture medium still occur under conditions
closer to those found physiologically.
Experimental procedures
Bacterial strain and culture conditions
F. succinogenes S85 (ATCC 19169) was cultured anaerobi-
cally for 15 h in a chemically defined medium [18] contain-
ing 3 gÆL
)1
cellobiose, or in a rumen fluid-based medium [9]
with 3 gÆL
)1
of one (or a mixture) of the following sugars:
glucose, cellobiose, maltose, maltotriose, maltotetraose,
maltohexaose, or MD mixtures.
Preparation of cells, and extracellular and cellular
media
Cells were prepared as described previously [10]: cells har-
vested in the late exponential phase were centrifuged
(6000 g, 10 min, 4 °C) and resuspended under a 100% CO
2
atmosphere in a reduced 50 mm potassium phosphate buf-
fer containing 40 mm Na
2
CO
3
,3mm cysteine and 13 mm
(NH
4
)
2
SO
4
, at pH 7.1.
Incubation with soluble sugars
Cell suspensions (6 mgÆmL
)1
of protein) were incubated at
38 °C, in a water bath, in medium containing 32 mm glu-
cose, 16 mm cellobiose, a mixture of 16 mm glucose and
8mm cellobiose, or MDs (maltose, maltotriose or malto-
tetraose, each at 32 mm glucose unit equivalents). At regu-
R. Nouaille et al. Cellulose metabolism in Fibrobacter succinogenes S85
FEBS Journal 272 (2005) 2416–2427 ª 2005 FEBS 2425
lar time-points (10 min) 4 mL of the cell suspension was
removed from the incubation medium, centrifuged
(13 000 g, 10 min, 4 °C), and the supernatant retained as
extracellular medium. The pellet was resuspended in water
and the cells were broken by successive freeze ⁄ thawing
procedures. Cell debris was pelleted by centrifugation
(14 000 g, 15 min) and the supernatant was assimilated to
cellular medium (cytoplasm and periplasm).
We checked that no cell lysis occurred during the incuba-
tions by measuring the activity of a cytoplasmic marker,
l-glutamate dehydrogenase [19], in the extracellular med-
ium and compared it with that of the corresponding cell
extracts.
Incubation with cellulose
F. succinogenes S85 cells (10 mgÆmL
)1
of protein) were pre-
incubated for 60 min at 38 °C in the reduced buffer (50 mm
potassium phosphate, 40 mm Na
2
CO
3
,3mm cysteine,
pH 7.1) containing 13 mm NH
4
+
[6.5 mm (NH
4
)
2
SO
4
], in
the presence of 0.2 g of cellulose (Sigmacell 20, Sigma). The
cell suspension was centrifuged for 4 min at 2000 g. The
pellet constituted the ‘adherent’ cells, which were suspended
in the reduced buffer (3.5 mgÆmL
)1
of protein). At regular
intervals (1, 2 and 3 h), 3 mL of the cell suspension was
removed from the incubation medium, centrifuged
(10 000 g, 10 min, 4 °C), and the supernatant retained as
extracellular medium; the pellet was resuspended in water
and the cells were broken by three successive freeze ⁄ thaw-
ing procedures. Cell debris and cellulose were pelleted by
centrifugation (10 000 g, 10 min) and the supernatant was
assimilated to cellular medium (cytoplasm and periplasm).
NMR spectroscopy
Measurements of NMR spectra were performed at 27 °C
on a 300 MHz or 500 MHz Avance Bruker spectrometer
equipped with 5 mm TXI
1
H,
13
C,
15
N with inverse detec-
tion.
1
H NMR chemical shifts are given relative to internal
sodium 3-(trimethylsilyl)propionate-d
4
(TSP-d
4
; d 0.0). A
sample volume of 3 mL was taken at regular intervals dur-
ing incubation with different carbon sources (glucose, malt-
ose, maltotriose or maltotetraose). After separation of
pellets, the pH of cell-free supernatants was corrected to
7.40 and the supernatants were then freeze-dried twice with
D
2
O. The same procedure was adopted for intracellular
media obtained from pellets. Samples were further dissolved
in a mixture of 470 lL of 99.98% D
2
O, 20 lLof10mm
TSP-d
4
and 10 lLof50mm 1-O-methyl-b-d-xylopyranose.
Basic quantification of H1 signals at d 5.46 and 5.43–5.41
(each representing a mixture of metabolites, species) was per-
formed in the
1
H NMR spectra taking TSP-d
4
as a reference.
The values obtained served as the reference for calculation
of metabolite concentrations based on H1 ⁄ H2 cross-peak
integrals taken in ge-DQF COSY spectra (standard Bruker
program). Because of the identical H1 ⁄ H2 chemical shifts of
free Glc1P and MD1P
a
(the Glc1P part of the MD1P mole-
cule), a very well separated cross-peak signal of MD1P
b
(d
5.43 ⁄ 3.58, owing to the Glc unit next to Glc1P in MD1P)
was used for calculating the free Glc1P concentration.
TLC
TLC was carried out as described previously [10] by using a
mixture of glucose, cellobiose or maltose, maltotriose and
maltotetraose, or phosphorylated sugars (3 gÆL
)1
; Sigma) as
a standard. Samples were spotted onto thin-layer silica gel
plates (Silica gel 60 F
254
; Merck, VWR International SAS,
Strasbourg, France). Sugars were separated by the solvent
mixture composed of propanol ⁄ 1-ethylacetate ⁄ water ⁄
ethanol ⁄ pyridine ⁄ aceticacid(7:3:5:3:2:2;v⁄ v ⁄ v ⁄ v ⁄ v ⁄ v)
and revealed by spraying with ethanol ⁄ H
2
SO
4
⁄ thymol
(95 : 5 : 0.5; v ⁄ v ⁄ v) and heating at 110 °C.
Metabolite assays
Protein concentration was determined by the Bradford
method [20], using BSA as standard. Succinate, acetate and
glucose were assayed by using enzymatic kits (Roche). In
the case of bacterial cultures, acetate and succinate produc-
tion was directly quantified from the
1
H NMR spectra of
culture medium using internal sodium TSP-d
4
as standard.
The same procedure was used to quantify MD
,
MD1P and
Glc1P in supernatant and cell extract samples issued from
the culture of resting cells with glucose.
Chemicals
TSP-d
4
was purchased from Eurisotop (Saint Aubin,
France). Glucose, cellobiose, maltose, maltotriose, malto-
tetraose, Sigmacell 20 cellulose and 1-O-methyl-b-d-
xylopyranose were from Sigma. All enzymes and other
chemicals were purchased from Sigma or Roche.
Acknowledgements
M. Matulova is a visiting professor at the University
Blaise Pascal, Aubie
`
re, France. R. Nouaille is grateful
to Re
´
gion Auvergne, Centre National de la Recherche
Scientifique and Institut National de la Recherche
Agronomique for a PhD grant.
References
1 Lynd LR, Weimer PJ, van Zyl WH & Pretorius IS
(2002) Microbial cellulose utilization: fundamentals and
biotechnology. Microbiol Mol Biol Rev 66, 506–577.
2 Matulova M, Delort A-M, Nouaille R, Gaudet G &
Forano E (2001) Concurrent maltodextrin and cellodex-
Cellulose metabolism in Fibrobacter succinogenes S85 R. Nouaille et al.
2426 FEBS Journal 272 (2005) 2416–2427 ª 2005 FEBS
trin synthesis by Fibrobacter succinogenes S85 as identi-
fied by 2D NMR spectroscopy. Eur J Biochem 268,
3907–3915.
3 Nouaille R, Matulova M, Delort A-M & Forano E
(2004) Production of maltodextrin-1-phosphate by
Fibrobacter succinogenes S85. FEBS Lett 576, 226–230.
4 Cato EP, Moore WE & Bryant MP (1978) Designation
of neotype strains for Bacteroides amylophilus (Hamlin
and Hungate 1956) and Bacteroides succinogenes (Hun-
gate 1950). Int J Syst Bacteriol 28 , 491–495.
5 Bibollet X, Bosc N, Matulova M, Delort A-M, Gaudet
G & Forano E (2000)
13
C and
1
H NMR study of cellu-
lose metabolism by Fibrobacter succinogenes S85. J Bio-
technol 77, 37–47.
6 Mosoni P, Fonty G & Gouet P (1997) Competition
between ruminal cellulolytic bacteria for adhesion to
cellulose. Curr Microbiol 35, 44–47.
7 Boos W & Shuman H (1998) Maltose ⁄ maltodextrin
system of Escherichia coli: transport, metabolism and
regulation. Microbiol Mol Biol Rev 62, 204–229.
8 Wells JE, Russell JB, Shi Y & Weimer PJ (1995) Cello-
dextrin efflux by the cellulolytic ruminal bacterium
Fibrobacter succinogenes and its potential role in the
growth of non-adherent bacteria. Appl Environ Micro-
biol 61, 1757–1762.
9 Matheron C, Delort A-M, Gaudet G & Forano E
(1998) In vivo
13
C NMR study of glucose and cellobiose
metabolism by four strains of the genus Fibrobacter.
Biodegradation 9, 451–461.
10 Matheron C, Delort A-M, Gaudet G & Forano E
(1996) Simultaneous but differential metabolism of glu-
cose and cellobiose in Fibrobacter succinogenes S85
cells studied by in vivo
13
C-NMR. Can J Microbiol 42 ,
1091–1099.
11 Kitaoka M & Hayashi K (2002) Carbohydrate-proces-
sing phosphorolytic enzymes. TIGG 14, 35–50.
12 Reichenbecher M, Lottspeich F & Bronnenmeier K
(1997) Purification and properties of a cellobiose phos-
phorylase (CepA) and a cellodextrin phosphorylase
(CepB) from the cellulolytic thermophile Clostridium
stercorarium. Eur J Biochem 247, 262–267.
13 Van der Zee JR, Postma PW & Hellingwerf KJ (1996)
Quantitative conversion of glucose into glucose-6-phos-
phate by intact Escherichia coli cells. Biotechnol Appl
Biochem 24, 225–230.
14 Scheifinger CC & Wolin MJ (1973) Propionate forma-
tion from cellulose and soluble sugars by combined
cultures of Bacteroides succinogenes and Selenomonas
ruminantium. Appl Microbiol 26, 789–795.
15 Kudo H, Cheng KJ & Costerton JW (1987) Interactions
between Treponema bryantii and cellulolytic bacteria in
the in vitro degradation of straw cellulose. Can J Micro-
biol 33, 244–248.
16 Stewart CS, Flint HR & Bryant MP (1997) The rumen
bacteria. In The Rumen Bacterial Ecosystem (Hobson
PN & Stewart CS, eds), pp. 10–72. Blackie Academic
and Professional, London, UK.
17 Bryant MP & Burkey LA (1953) Numbers and some of
the predominant groups of bacteria in the rumen of
cows fed different rations. J Dairy Sci 36, 218–224.
18 Gaudet G, Forano E, Dauphin G & Delort AM (1992)
Futile cycling of glycogen in Fibrobacter succinogenes as
shown by in situ
1
H-NMR and
13
C-NMR investigation.
Eur J Biochem 207, 155–162.
19 Aghajanian SA, Martin SR & Engel PC (1995) Urea-
induced inactivation and denaturation of clostridial glu-
tamate dehydrogenase: the absence of stable dimeric or
trimeric intermediates. Biochem J 311, 905–910.
20 Bradford MM (1976) A rapid sensitive method for the
quantification of microgram quantities of protein, util-
izing the principle of protein-dye binding. Anal Biochem
72, 248–254.
21 Delort A-M, Gaudet G & Forano E (2002)
23
Na NMR
study of Fibrobacter succinogenes S85: comparison of
three chemical shift reagents and calculation of sodium
concentration using ionophores. Anal Biochem 306,
171–180.
R. Nouaille et al. Cellulose metabolism in Fibrobacter succinogenes S85
FEBS Journal 272 (2005) 2416–2427 ª 2005 FEBS 2427