Báo cáo khoa học: "Combining Coherence Models and Machine Translation Evaluation Metrics for Summarization Evaluation" doc
Bạn đang xem bản rút gọn của tài liệu. Xem và tải ngay bản đầy đủ của tài liệu tại đây (205.37 KB, 9 trang )
Proceedings of the 50th Annual Meeting of the Association for Computational Linguistics, pages 1006–1014,
Jeju, Republic of Korea, 8-14 July 2012.
c
2012 Association for Computational Linguistics
Combining Coherence Models and Machine Translation Evaluation Metrics
for Summarization Evaluation
Ziheng Lin
†
, Chang Liu
‡
, Hwee Tou Ng
‡
and Min-Yen Kan
‡
†
SAP Research, SAP Asia Pte Ltd
30 Pasir Panjang Road, Singapore 117440
‡
Department of Computer Science, National University of Singapore
13 Computing Drive, Singapore 117417
{liuchan1,nght,kanmy}@comp.nus.edu.sg
Abstract
An ideal summarization system should pro-
duce summaries that have high content cov-
erage and linguistic quality. Many state-of-
the-art summarization systems focus on con-
tent coverage by extracting content-dense sen-
tences from source articles. A current research
focus is to process these sentences so that they
read fluently as a whole. The current AE-
SOP task encourages research on evaluating
summaries on content, readability, and over-
all responsiveness. In this work, we adapt
a machine translation metric to measure con-
tent coverage, apply an enhanced discourse
coherence model to evaluate summary read-
ability, and combine both in a trained regres-
sion model to evaluate overall responsiveness.
The results show significantly improved per-
formance over AESOP 2011 submitted met-
rics.
1 Introduction
Research and development on automatic and man-
ual evaluation of summarization systems have been
mainly focused on content coverage (Lin and Hovy,
2003; Nenkova and Passonneau, 2004; Hovy et al.,
2006; Zhou et al., 2006). However, users may still
find it difficult to read such high-content coverage
summaries as they lack fluency. To promote research
on automatic evaluation of summary readability, the
Text Analysis Conference (TAC) (Owczarzak and
Dang, 2011) introduced a new subtask on readability
to its Automatically Evaluating Summaries of Peers
(AESOP) task.
Most of the state-of-the-art summarization sys-
tems (Ng et al., 2011; Zhang et al., 2011; Conroy
et al., 2011) are extraction-based. They extract the
most content-dense sentences from source articles.
If no post-processing is performed to the generated
summaries, the presentation of the extracted sen-
tences may confuse readers. Knott (1996) argued
that when the sentences of a text are randomly or-
dered, the text becomes difficult to understand, as its
discourse structure is disturbed. Lin et al. (2011)
validated this argument by using a trained model
to differentiate an original text from a randomly-
ordered permutation of its sentences by looking at
their discourse structures. This prior work leads us
to believe that we can apply such discourse mod-
els to evaluate the readability of extract-based sum-
maries. We will discuss the application of Lin et
al.’s discourse coherence model to evaluate read-
ability of machine generated summaries. We also
introduce two new feature sources to enhance the
model with hierarchical and Explicit/Non-Explicit
information, and demonstrate that they improve the
original model.
There are parallels between evaluations of ma-
chine translation (MT) and summarization with re-
spect to textual content. For instance, the widely
used ROUGE (Lin and Hovy, 2003) metrics are in-
fluenced by BLEU (Papineni et al., 2002): both
look at surface n-gram overlap for content cover-
age. Motivated by this, we will adapt a state-of-the-
art, linear programming-based MT evaluation met-
ric, TESLA (Liu et al., 2010), to evaluate the content
coverage of summaries.
TAC’s overall responsiveness metric evaluates the
1006
quality of a summary with regard to both its con-
tent and readability. Given this, we combine our
two component coherence and content models into
an SVM-trained regression model as our surrogate
to overall responsiveness. Our experiments show
that the coherence model significantly outperforms
all AESOP 2011 submissions on both initial and up-
date tasks, while the adapted MT evaluation metric
and the combined model significantly outperform all
submissions on the initial task. To the best of our
knowledge, this is the first work that applies a dis-
course coherence model to measure the readability
of summaries in the AESOP task.
2 Related Work
Nenkova and Passonneau (2004) proposed a manual
evaluation method that was based on the idea that
there is no single best model summary for a collec-
tion of documents. Human annotators construct a
pyramid to capture important Summarization Con-
tent Units (SCUs) and their weights, which is used
to evaluate machine generated summaries.
Lin and Hovy (2003) introduced an automatic
summarization evaluation metric, called ROUGE,
which was motivated by the MT evaluation met-
ric, BLEU (Papineni et al., 2002). It automati-
cally determines the content quality of a summary
by comparing it to the model summaries and count-
ing the overlapping n-gram units. Two configura-
tions – ROUGE-2, which counts bigram overlaps,
and ROUGE-SU4, which counts unigram and bi-
gram overlaps in a word window of four – have been
found to correlate well with human evaluations.
Hovy et al. (2006) pointed out that automated
methods such as ROUGE, which match fixed length
n-grams, face two problems of tuning the appropri-
ate fragment lengths and matching them properly.
They introduced an evaluation method that makes
use of small units of content, called Basic Elements
(BEs). Their method automatically segments a text
into BEs, matches similar BEs, and finally scores
them.
Both ROUGE and BE have been implemented
and included in the ROUGE/BE evaluation toolkit
1
,
which has been used as the default evaluation tool
in the summarization track in the Document Un-
1
/>derstanding Conference (DUC) and Text Analysis
Conference (TAC). DUC and TAC also manually
evaluated machine generated summaries by adopt-
ing the Pyramid method. Besides evaluating with
ROUGE/BE and Pyramid, DUC and TAC also asked
human judges to score every candidate summary
with regard to its content, readability, and overall re-
sponsiveness.
DUC and TAC defined linguistic quality to cover
several aspects: grammaticality, non-redundancy,
referential clarity, focus, and structure/coherence.
Recently, Pitler et al. (2010) conducted experiments
on various metrics designed to capture these as-
pects. Their experimental results on DUC 2006 and
2007 show that grammaticality can be measured by
a set of syntactic features, while the last three as-
pects are best evaluated by local coherence. Con-
roy and Dang (2008) combined two manual linguis-
tic scores – grammaticality and focus – with various
ROUGE/BE metrics, and showed this helps better
predict the responsiveness of the summarizers.
Since 2009, TAC introduced the task of Auto-
matically Evaluating Summaries of Peers (AESOP).
AESOP 2009 and 2010 focused on two summary
qualities: content and overall responsiveness. Sum-
mary content is measured by comparing the output
of an automatic metric with the manual Pyramid
score. Overall responsiveness measures a combi-
nation of content and linguistic quality. In AESOP
2011 (Owczarzak and Dang, 2011), automatic met-
rics are also evaluated for their ability to assess sum-
mary readability, i.e., to measure how linguistically
readable a machine generated summary is. Sub-
mitted metrics that perform consistently well on the
three aspects include Giannakopoulos and Karkalet-
sis (2011), Conroy et al. (2011), and de Oliveira
(2011). Giannakopoulos and Karkaletsis (2011) cre-
ated two character-based n-gram graph representa-
tions for both the model and candidate summaries,
and applied graph matching algorithm to assess their
similarity. Conroy et al. (2011) extended the model
in (Conroy and Dang, 2008) to include shallow lin-
guistic features such as term overlap, redundancy,
and term and sentence entropy. de Oliveira (2011)
modeled the similarity between the model and can-
didate summaries as a maximum bipartite matching
problem, where the two summaries are represented
as two sets of nodes and precision and recall are cal-
1007
w=1.0 w=0.8 w=0.2 w=0.1
w=1.0 w=0.8 w=0.1
w=0.2
s=0.5 s=1.0s=0.5 s=1.0
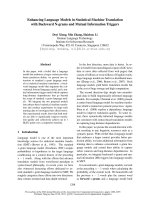
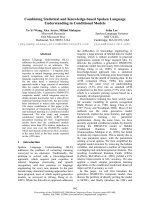
(a) The matching problem
w=1.0 w=0.8 w=0.2 w=0.1
w=1.0 w=0.8 w=0.1
w=0.2
w=1.0 w=0.2w=0.6 w=0.1
(b) The matching solution
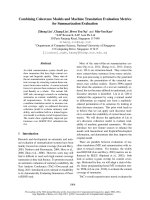
Figure 1: A BNG matching problem. Top and
bottom rows of each figure represent BNG from
the model and candidate summaries, respectively.
Links are similarities. Both n-grams and links are
weighted.
culated from the matched edges. However, none of
the AESOP metrics currently apply deep linguistic
analysis, which includes discourse analysis.
Motivated by the parallels between summariza-
tion and MT evaluation, we will adapt a state-of-
the-art MT evaluation metric to measure summary
content quality. To apply deep linguistic analysis,
we also enhance an existing discourse coherence
model to evaluate summary readability. We focus
on metrics that measure the average quality of ma-
chine summarizers, i.e., metrics that can rank a set
of machine summarizers correctly (human summa-
rizers are not included in the list).
3 TESLA-S: Evaluating Summary
Content
TESLA (Liu et al., 2010) is an MT evaluation
metric which extends BLEU by introducing a lin-
ear programming-based framework for improved
matching. It also makes use of linguistic resources
and considers both precision and recall.
3.1 The Linear Programming Matching
Framework
Figure 1 shows the matching of bags of n-grams
(BNGs) that forms the core of the TESLA metric.
The top row in Figure 1a represents the bag of n-
grams (BNG) from the model summary, and the
bottom row represents the BNG from the candidate
summary. Each n-gram has a weight. The links
between the n-grams represent the similarity score,
which are constrained to be between 0 and 1. Math-
ematically, TESLA takes as input the following:
1. The BNG of the model summary, X, and the
BNG of the candidate summary, Y . The ith en-
try in X is x
i
and has weight x
W
i
(analogously
for y
i
and y
W
i
).
2. A similarity score s(x
i
, y
j
) between all n-
grams x
i
and y
j
.
The goal of the matching process is to align the
two BNGs so as to maximize the overall similar-
ity. The variables of the problem are the allocated
weights for the edges,
w(x
i
, y
j
) ∀i, j
TESLA maximizes
i,j
s(x
i
, y
j
)w(x
i
, y
j
)
subject to
w(x
i
, y
j
) ≥ 0 ∀i, j
j
w(x
i
, y
j
) ≤ x
W
i
∀i
i
w(x
i
, y
j
) ≤ y
W
j
∀j
This real-valued linear programming problem can
be solved efficiently. The overall similarity S is the
value of the objective function. Thus,
Precision =
S
j
y
W
j
Recall =
S
i
x
W
i
The final TESLA score is given by the F-measure:
F =
Precision × Recall
α × Precision + (1 − α) × Recall
In this work, we set α = 0.8, following (Liu et al.,
2010). The score places more importance on recall
than precision. When multiple model summaries are
provided, TESLA matches the candidate BNG with
each of the model BNGs. The maximum score is
taken as the combined score.
1008
3.2 TESLA-S: TESLA for Summarization
We adapted TESLA for the nuances of summariza-
tion. Mimicking ROUGE-SU4, we construct one
matching problem between the unigrams and one
between skip bigrams with a window size of four.
The two F scores are averaged to give the final score.
The similarity score s(x
i
, y
j
) is 1 if the word sur-
face forms of x
i
and y
j
are identical, and 0 other-
wise. TESLA has a more sophisticated similarity
measure that focuses on awarding partial scores for
synonyms and parts of speech (POS) matches. How-
ever, the majority of current state-of-the-art sum-
marization systems are extraction-based systems,
which do not generate new words. Although our
simplistic similarity score may be problematic when
evaluating abstract-based systems, the experimen-
tal results support our choice of the similarity func-
tion. This reflects a major difference between MT
and summarization evaluation: while MT systems
always generate new sentences, most summarization
systems focus on locating existing salient sentences.
Like in TESLA, function words (words in closed
POS categories, such as prepositions and articles)
have their weights reduced by a factor of 0.1, thus
placing more emphasis on the content words. We
found this useful empirically.
3.3 Significance Test
Koehn (2004) introduced a bootstrap resampling
method to compute statistical significance of the dif-
ference between two machine translation systems
with regard to the BLEU score. We adapt this
method to compute the difference between two eval-
uation metrics in summarization:
1. Randomly choose n topics from the n given
topics with replacement.
2. Summarize the topics with the list of machine
summarizers.
3. Evaluate the list of summaries from Step 2 with
the two evaluation metrics under comparison.
4. Determine which metric gives a higher correla-
tion score.
5. Repeat Step 1 – 4 for 1,000 times.
As we have 44 topics in TAC 2011 summarization
track, n = 44. The percentage of times metric a
gives higher correlation than metric b is said to be
the significance level at which a outperforms b.
Initial Update
P S K P S K
R-2 0.9606 0.8943 0.7450 0.9029 0.8024 0.6323
R-SU4 0.9806 0.8935 0.7371 0.8847 0.8382 0.6654
BE 0.9388 0.9030 0.7456 0.9057 0.8385 0.6843
4 0.9672 0.9017 0.7351 0.8249 0.8035 0.6070
6 0.9678 0.8816 0.7229 0.9107 0.8370 0.6606
8 0.9555 0.8686 0.7024 0.8981 0.8251 0.6606
10 0.9501 0.8973 0.7550 0.7680 0.7149 0.5504
11 0.9617 0.8937 0.7450 0.9037 0.8018 0.6291
12 0.9739 0.8972 0.7466 0.8559 0.8249 0.6402
13 0.9648 0.9033 0.7582 0.8842 0.7961 0.6276
24 0.9509 0.8997 0.7535 0.8115 0.8199 0.6386
TESLA-S 0.9807 0.9173 0.7734 0.9072 0.8457 0.6811
Table 1: Content correlation with human judgment
on summarizer level. Top three scores among AE-
SOP metrics are underlined. The TESLA-S score is
bolded when it outperforms all others. ROUGE-2 is
shortened to R-2 and ROUGE-SU4 to R-SU4.
3.4 Experiments
We test TESLA-S on the AESOP 2011 content eval-
uation task, judging the metric fitness by compar-
ing its correlations with human judgments for con-
tent. The results for the initial and update tasks are
reported in Table 1. We show the three baselines
(ROUGE-2, ROUGE-SU4, and BE) and submitted
metrics with correlations among the top three scores,
which are underlined. This setting remains the same
for the rest of the experiments. We use three cor-
relation measures: Pearson’s r, Spearman’s ρ, and
Kendall’s τ, represented by P, S, and K, respectively.
The ROUGE scores are the recall scores, as per con-
vention. On the initial task, TESLA-S outperforms
all metrics on all three correlation measures. On the
update task, TESLA-S ranks second, first, and sec-
ond on Pearson’s r, Spearman’s ρ, and Kendall’s τ,
respectively.
To test how significant the differences are, we per-
form significance testing using Koehn’s resampling
method between TESLA-S and ROUGE-2/ROUGE-
SU4, on which TESLA-S is based. The findings are:
• Initial task: TESLA-S is better than ROUGE-2
at 99% significance level as measured by Pear-
son’s r.
• Update task: TESLA-S is better than ROUGE-
SU4 at 95% significance level as measured by
Pearson’s r.
• All other differences are statistically insignifi-
cant, including all correlations on Spearman’s
1009
ρ and Kendall’s τ.
The last point can be explained by the fact that
Spearman’s ρ and Kendall’s τ are sensitive to only
the system rankings, whereas Pearson’s r is sensitive
to the magnitude of the differences as well, hence
Pearson’s r is in general a more sensitive measure.
4 DICOMER: Evaluating Summary
Readability
Intuitively, a readable text should also be coherent,
and an incoherent text will result in low readabil-
ity. Both readability and coherence indicate how
fluent a text is. We thus hypothesize that a model
that measures how coherent a text is can also mea-
sure its readability. Lin et al. (2011) introduced dis-
course role matrix to represent discourse coherence
of a text. W first illustrate their model with an exam-
ple, and then introduce two new feature sources. We
then apply the models and evaluate summary read-
ability.
4.1 Lin et al.’s Discourse Coherence Model
First, a free text in Figure 2 is parsed by a dis-
course parser to derive its discourse relations, which
are shown in Figure 3. Lin et al. observed that
coherent texts preferentially follow certain relation
patterns. However, simply using such patterns to
measure the coherence of a text can result in fea-
ture sparseness. To solve this problem, they expand
the relation sequence into a discourse role matrix,
as shown in Table 2. The matrix essentially cap-
tures term occurrences in the sentence-to-sentence
relation sequences. This model is motivated by
the entity-based model (Barzilay and Lapata, 2008)
which captures sentence-to-sentence entity transi-
tions. Next, the discourse role transition probabili-
ties of lengths 2 and 3 (e.g., Temp.Arg1→Exp.Arg2
and Comp.Arg1→nil→Temp.Arg1) are calculated
with respect to the matrix. For example, the prob-
ability of Comp.Arg2→Exp.Arg2 is 2/25 = 0.08 in
Table 2.
Lin et al. applied their model on the task of dis-
cerning an original text from a permuted ordering of
its sentences. They modeled it as a pairwise rank-
ing model (i.e., original vs. permuted), and trained a
SVM preference ranking model with discourse role
S
1
Japan normally depends heavily on the High-
land Valley and Cananea mines as well as the
Bougainville mine in Papua New Guinea.
S
2
Recently, Japan has been buying copper elsewhere.
S
3.1
But as Highland Valley and Cananea begin operat-
ing,
S
3.2
they are expected to resume their roles as Japan’s
suppliers.
S
4.1
According to Fred Demler, metals economist for
Drexel Burnham Lambert, New York,
S
4.2
“Highland Valley has already started operating
S
4.3
and Cananea is expected to do so soon.”
Figure 2: A text with four sentences. S
i.j
means the
jth clause in the ith sentence.
S
1
S
2
S
3.1
S
3.2
S
4.1
S
4.2
S
4.3
Implicit
Comparison
Explicit
Comparison
Explicit
Temporal
Implicit
Expansion
Explicit
Expansion
Figure 3: The discourse relations for Figure 2. Ar-
rows are pointing from Arg2 to Arg1.
S#
Terms
copper cananea operat depend .
S
1
nil Comp.Arg1 nil Comp.Arg1
S
2
Comp.Arg2
nil nil nil
Comp.Arg1
S
3
nil
Comp.Arg2 Comp.Arg2
nilTemp.Arg1 Temp.Arg1
Exp.Arg1 Exp.Arg1
S
4
nil Exp.Arg2
Exp.Arg1
nil
Exp.Arg2
Table 2: Discourse role matrix fragment extracted
from Figure 2 and 3. Rows correspond to sen-
tences, columns to stemmed terms, and cells contain
extracted discourse roles. Temporal, Contingency,
Comparison, and Expansion are shortened to Temp,
Cont, Comp, and Exp, respectively.
transitions as features and their probabilities as val-
ues.
4.2 Two New Feature Sources
We observe that there are two kinds of informa-
tion in Figure 3 that are not captured by Lin et al.’s
1010
model. The first one is whether a relation is Ex-
plicit or Non-Explicit (Lin et al. (2010) termed Non-
Explicit to include Implicit, AltLex, EntRel, and
NoRel). Explicit relation and Non-Explicit relation
have different distributions on each discourse rela-
tion (PDTB-Group, 2007). Thus, adding this in-
formation may further improve the model. In ad-
dition to the set of the discourse roles of “Rela-
tion type . Argument tag”, we introduce another
set of “Explicit/Non-Explicit . Relation type . Ar-
gument tag”. The cell C
cananea,S
3
now contains
Comp.Arg2, Temp.Arg1, Exp.Arg1, E.Comp.Arg2,
E.Temp.Arg1, and N.Exp.Arg1 (E for Explicit and
N for Non-Explicit).
The other information that is not in the discourse
role matrix is the discourse hierarchy structure,
i.e., whether one relation is embedded within
another relation. In Figure 3, S
3.1
is Arg1 of
Explicit Temporal, which is Arg2 of the higher
relation Explicit Comparison as well as Arg1 of
another higher relation Implicit Expansion. These
dependencies are important for us to know how
well-structured a summary is. It is represented
by the multiple discourse roles in each cell of the
matrix. For example, the multiple discourse roles in
the cell C
cananea,S
3
capture the three dependencies
just mentioned. We introduce intra-cell bigrams
as a new set of features to the original model: for
a cell with multiple discourse roles, we sort them
by their surface strings and multiply to obtain
the bigrams. For instance, C
cananea,S
3
will pro-
duce bigrams such as Comp.Arg2↔Exp.Arg1
and Comp.Arg2↔Temp.Arg1. When both
the Explicit/Non-Explicit feature source and
the intra-cell feature source are joined to-
gether, it also produces bigram features such
as E.Comp.Arg2↔Temp.Arg1.
4.3 Predicting Readability Scores
Lin et al. (2011) used the SVM
light
(Joachims,
1999) package with the preference ranking config-
uration. To train the model, each source text and
one of its permutations form a training pair, where
the source text is given a rank of 1 and the permuta-
tion is given 0. In testing, the trained model predicts
a real number score for each instance, and the in-
stance with the higher score in a pair is said to be
the source text.
In the TAC summarization track, human judges
scored each model and candidate summary with a
readability score from 1 to 5 (5 means most read-
able). Thus in our setting, instead of a pair of texts,
the training input consists of a list of model and can-
didate summaries from each topic, with their anno-
tated scores as the rankings. Given an unseen test
summary, the trained model predicts a real number
score. This score essentially is the readability rank-
ing of the test summary. Such ranking can be eval-
uated by the ranking-based correlations of Spear-
man’s ρ and Kendall’s τ. As Pearson’s r measures
linear correlation and we do not know whether the
real number score follows a linear function, we take
the logarithm of this score as the readability score
for this instance.
We use the data from AESOP 2009 and 2010 as
the training data, and test our metrics on AESOP
2011 data. To obtain the discourse relations of a
summary, we use the discourse parser
2
developed in
Lin et al. (2010).
4.4 Experiments
Table 3 shows the resulting readability correlations.
The last four rows show the correlation scores for
our coherence model: LIN is the default model
by (Lin et al., 2011), LIN+C is LIN with the
intra-cell feature class, LIN+E is enhanced with
the Explicit/Non-Explicit feature class. We name
the LIN model with both new feature sources (i.e.,
LIN+C+E) DICOMER – a DIscourse COherence
Model for Evaluating Readability.
LIN outperforms all metrics on all correlations on
both tasks. On the initial task, it outperforms the
best scores by 3.62%, 16.20%, and 12.95% on Pear-
son, Spearman, and Kendall, respectively. Similar
gaps (4.27%, 18.52%, and 13.96%) are observed
on the update task. The results are much better
on Spearman and Kendall. This is because LIN is
trained with a ranking model, and both Spearman
and Kendall are ranking-based correlations.
Adding either intra-cell or Explicit/Non-Explicit
features improves all correlation scores, with
Explicit/Non-Explicit giving more pronounced im-
provements. When both new feature sources are in-
2
/>˜
linzihen/
parser/
1011
Initial Update
P S K P S K
R-2 0.7524 0.3975 0.2925 0.6580 0.3732 0.2635
R-SU4 0.7840 0.3953 0.2925 0.6716 0.3627 0.2540
BE 0.7171 0.4091 0.2911 0.5455 0.2445 0.1622
4 0.8194 0.4937 0.3658 0.7423 0.4819 0.3612
6 0.7840 0.4070 0.3036 0.6830 0.4263 0.3141
12 0.7944 0.4973 0.3589 0.6443 0.3991 0.3062
18 0.7914 0.4746 0.3510 0.6698 0.3941 0.2856
23 0.7677 0.4341 0.3162 0.7054 0.4223 0.3014
LIN 0.8556 0.6593 0.4953 0.7850 0.6671 0.5008
LIN+C 0.8612 0.6703 0.4984 0.7879 0.6828 0.5135
LIN+E 0.8619 0.6855 0.5079 0.7928 0.6990 0.5309
DICOMER 0.8666 0.7122 0.5348 0.8100 0.7145 0.5435
Table 3: Readability correlation with human judg-
ment on summarizer level. Top three scores among
AESOP metrics are underlined. Our score is bolded
when it outperforms all AESOP metrics.
Initial Update
vs. P S K P S K
LIN
4
∗ ∗∗ ∗∗ ∗∗ ∗∗ ∗∗
LIN+C ∗∗ ∗∗ ∗∗ ∗∗ ∗∗ ∗∗
LIN+E ∗∗ ∗∗ ∗∗ ∗ ∗∗ ∗∗
DICOMER ∗∗ ∗∗ ∗∗ ∗∗ ∗∗ ∗∗
DICOMER LIN – ∗ ∗ ∗ – –
Table 4: Koehn’s significance test for readability.
∗∗, ∗, and – indicate significance level >=99%,
>=95%, and <95%, respectively.
corporated into the metric, we obtain the best results
for all correlation scores: DICOMER outperforms
LIN by 1.10%, 5.29%, and 3.95% on the initial task,
and 2.50%, 4.74%, and 4.27% on the update task.
Table 3 shows that summarization evaluation
Metric 4 tops all other AESOP metrics, except in
the case of Spearman’s ρ on the initial task. We
compare our four models to this metric. The results
of Koehn’s significance test are reported in Table 4,
which demonstrates that all four models outperform
Metric 4 significantly. In the last row, we see that
when comparing DICOMER to LIN, DICOMER is
significantly better on three correlation measures.
5 CREMER: Evaluating Overall
Responsiveness
With TESLA-S measuring content coverage and DI-
COMER measuring readability, it is feasible to com-
bine them to predict the overall responsiveness of a
summary. There exist many ways to combine two
variables mathematically: we can combine them in
a linear function or polynomial function, or in a way
Initial Update
P S K P S K
R-2 0.9416 0.7897 0.6096 0.9169 0.8401 0.6778
R-SU4 0.9545 0.7902 0.6017 0.9123 0.8758 0.7065
BE 0.9155 0.7683 0.5673 0.8755 0.7964 0.6254
4 0.9498 0.8372 0.6662 0.8706 0.8674 0.7033
6 0.9512 0.7955 0.6112 0.9271 0.8769 0.7160
11 0.9427 0.7873 0.6064 0.9194 0.8432 0.6794
12 0.9469 0.8450 0.6746 0.8728 0.8611 0.6858
18 0.9480 0.8447 0.6715 0.8912 0.8377 0.6683
23 0.9317 0.7952 0.6080 0.9192 0.8664 0.6953
25 0.9512 0.7899 0.6033 0.9033 0.8139 0.6349
CREMER
LF
0.9381 0.8346 0.6635 0.8280 0.6860 0.5173
CREMER
P F
0.9621 0.8567 0.6921 0.8852 0.7863 0.6159
CREMER
RBF
0.9716 0.8836 0.7206 0.9018 0.8285 0.6588
Table 5: Responsiveness correlation with human
judgment on summarizer level. Top three scores
among AESOP metrics are underlined. CREMER
score is bolded when it outperforms all AESOP met-
rics.
similar to how precision and recall are combined
in F measure. We applied a machine learning ap-
proach to train a regression model for measuring
responsiveness. The scores predicted by TESLA-
S and DICOMER are used as two features. We
use SVM
light
with the regression configuration, test-
ing three kernels: linear function, polynomial func-
tion, and radial basis function. We called this model
CREMER – a Combined REgression Model for
Evaluating Responsiveness.
We train the regression model on AESOP 2009
and 2010 data sets, and test it on AESOP 2011. The
DICOMER model that is trained in Section 4 is used
to predict the readability scores on all AESOP 2009,
2010, and 2011 summaries. We apply TESLA-S to
predict content scores on all AESOP 2009, 2010,
and 2011 summaries.
5.1 Experiments
The last three rows in Table 5 show the correlation
scores of our regression model trained with SVM
linear function (LF), polynomial function (PF), and
radial basis function (RBF). PF performs better than
LF, suggesting that content and readability scores
should not be linearly combined. RBF gives bet-
ter performances than both LF and PF, suggesting
that RBF better models the way humans combine
content and readability. On the initial task, the
model trained with RBF outperforms all submitted
metrics. It outperforms the best correlation scores
1012
by 1.71%, 3.86%, and 4.60% on Pearson, Spear-
man, and Kendall, respectively. All three regression
models do not perform as well on the update task.
Koehn’s significance test shows that when trained
with RBF, CREMER outperforms ROUGE-2 and
ROUGE-SU4 on the initial task at a significance
level of 99% for all three correlation measures.
6 Discussion
The intuition behind the combined regression model
is that combining the readability and content scores
will give an overall good responsiveness score. The
function to combine them and their weights can be
obtained by training. While the results showed that
SVM radial basis kernel gave the best performances,
this function may not truly mimic how human evalu-
ates responsiveness. Human judges were told to rate
summaries by their overall qualities. They may take
into account other aspects besides content and read-
ability. Given CREMER did not perform well on the
update task, we hypothesize that human judgment
of update summaries may involve more complicated
rankings or factor in additional input that CREMER
currently does not model. We plan to devise a bet-
ter responsiveness metric in our future work, beyond
using a simple combination.
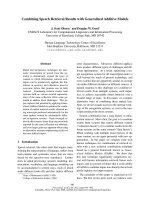
Figure 4 shows a complete picture of Pearson’s r
for all AESOP 2011 metrics and our three met-
rics on both initial and update tasks. We highlight
our metrics with a circle on these curves. On the
initial task, correlation scores for content are con-
sistently higher than those for responsiveness with
small gaps, whereas on the update task, they are al-
most overlapping. On the other hand, correlation
scores for readability are much lower than those for
content and responsiveness, with a gap of about 0.2.
Comparing Figure 4a and 4b, evaluation metrics al-
ways correlate better on the initial task than on the
update task. This suggests that there is much room
for improvement for readability metrics, and metrics
need to consider update information when evaluat-
ing update summarizers.
7 Conclusion
We proposed TESLA-S by adapting an MT eval-
uation metric to measure summary content cover-
age, and introduced DICOMER by applying a dis-
0.4
0.5
0.6
0.7
0.8
0.9
1
Pearson’s r
Content
Responsiveness
Readability
(a) Evaluation metric values on the initial task.
0.3
0.4
0.5
0.6
0.7
0.8
0.9
1
Pearson’s r
Content
Responsiveness
Readability
(b) Evaluation metric values on the update
task.
Figure 4: Pearson’s r for all AESOP 2011 submitted
metrics and our proposed metrics. Our metrics are
circled. Higher r value is better.
course coherence model with newly introduced fea-
tures to evaluate summary readability. We com-
bined these two metrics in the CREMER metric
– an SVM-trained regression model – for auto-
matic summarization overall responsiveness evalu-
ation. Experimental results on AESOP 2011 show
that DICOMER significantly outperforms all sub-
mitted metrics on both initial and update tasks with
large gaps, while TESLA-S and CREMER signifi-
cantly outperform all metrics on the initial task.
3
Acknowledgments
This research is supported by the Singapore Na-
tional Research Foundation under its International
Research Centre @ Singapore Funding Initiative and
administered by the IDM Programme Office.
3
Our metrics are publicly available at http://wing.
comp.nus.edu.sg/
˜
linzihen/summeval/.
1013
References
Regina Barzilay and Mirella Lapata. 2008. Modeling
local coherence: An entity-based approach. Computa-
tional Linguistics, 34:1–34, March.
John M. Conroy and Hoa Trang Dang. 2008. Mind
the gap: Dangers of divorcing evaluations of summary
content from linguistic quality. In Proceedings of the
22nd International Conference on Computational Lin-
guistics (Coling 2008), Manchester, UK, August.
John M. Conroy, Judith D. Schlesinger, Jeff Kubina,
Peter A. Rankel, and Dianne P. O’Leary. 2011.
CLASSY 2011 at TAC: Guided and multi-lingual sum-
maries and evaluation metrics. In Proceedings of the
Text Analysis Conference 2011 (TAC 2011), Gaithers-
burg, Maryland, USA, November.
Paulo C. F. de Oliveira. 2011. CatolicaSC at TAC 2011.
In Proceedings of the Text Analysis Conference (TAC
2011), Gaithersburg, Maryland, USA, November.
George Giannakopoulos and Vangelis Karkaletsis. 2011.
AutoSummENG and MeMoG in evaluating guided
summaries. In Proceedings of the Text Analysis Con-
ference (TAC 2011), Gaithersburg, Maryland, USA,
November.
Eduard Hovy, Chin-Yew Lin, Liang Zhou, and Junichi
Fukumoto. 2006. Automated summarization evalua-
tion with basic elements. In Proceedings of the Fifth
Conference on Language Resources and Evaluation
(LREC 2006).
Thorsten Joachims. 1999. Making large-scale sup-
port vector machine learning practical. In Bernhard
Schlkopf, Christopher J. C. Burges, and Alexander J.
Smola, editors, Advances in Kernel Methods – Support
Vector Learning. MIT Press, Cambridge, MA, USA.
Alistair Knott. 1996. A Data-Driven Methodology for
Motivating a Set of Coherence Relations. Ph.D. the-
sis, Department of Artificial Intelligence, University
of Edinburgh.
Philipp Koehn. 2004. Statistical significance tests for
machine translation evaluation. In Proceedings of the
2004 Conference on Empirical Methods in Natural
Language Processing (EMNLP 2004).
Chin-Yew Lin and Eduard Hovy. 2003. Automatic evalu-
ation of summaries using n-gram co-occurrence statis-
tics. In Proceedings of the 2003 Conference of the
North American Chapter of the Association for Com-
putational Linguistics on Human Language Technol-
ogy (NAACL 2003), Morristown, NJ, USA.
Ziheng Lin, Hwee Tou Ng, and Min-Yen Kan. 2010. A
PDTB-styled end-to-end discourse parser. Technical
Report TRB8/10, School of Computing, National Uni-
versity of Singapore, August.
Ziheng Lin, Hwee Tou Ng, and Min-Yen Kan. 2011. Au-
tomatically evaluating text coherence using discourse
relations. In Proceedings of the 49th Annual Meeting
of the Association for Computational Linguistics: Hu-
man Language Technologies (ACL-HLT 2011), Port-
land, Oregon, USA, June.
Chang Liu, Daniel Dahlmeier, and Hwee Tou Ng.
2010. TESLA: Translation evaluation of sentences
with linear-programming-based analysis. In Proceed-
ings of the Joint Fifth Workshop on Statistical Machine
Translation and MetricsMATR, Uppsala, Sweden. As-
sociation for Computational Linguistics.
Ani Nenkova and Rebecca Passonneau. 2004. Evaluat-
ing content selection in summarization: The pyramid
method. In Proceedings of the 2004 Human Language
Technology Conference / North American Chapter of
the Association for Computational Linguistics Annual
Meeting (HLT-NAACL 2004), Boston, Massachusetts,
USA, May.
Jun Ping Ng, Praveen Bysani, Ziheng Lin, Min-Yen
Kan, and Chew Lim Tan. 2011. SWING: Exploit-
ing category-specific information for guided summa-
rization. In Proceedings of the Text Analysis Confer-
ence 2011 (TAC 2011), Gaithersburg, Maryland, USA,
November.
Karolina Owczarzak and Hoa Trang Dang. 2011.
Overview of the TAC 2011 summarization track:
Guided task and AESOP task. In Proceedings of the
Text Analysis Conference (TAC 2011), Gaithersburg,
Maryland, USA, November.
Kishore Papineni, Salim Roukos, Todd Ward, and Wei-
Jing Zhu. 2002. BLEU: a method for automatic eval-
uation of machine translation. In Proceedings of the
40th Annual Meeting of the Association for Computa-
tional Linguistics (ACL 2002), Stroudsburg, PA, USA.
PDTB-Group, 2007. The Penn Discourse Treebank 2.0
Annotation Manual. The PDTB Research Group.
Emily Pitler, Annie Louis, and Ani Nenkova. 2010.
Automatic evaluation of linguistic quality in multi-
document summarization. In Proceedings of the 48th
Annual Meeting of the Association for Computational
Linguistics (ACL 2010), Stroudsburg, PA, USA.
Renxian Zhang, You Ouyang, and Wenjie Li. 2011.
Guided summarization with aspect recognition. In
Proceedings of the Text Analysis Conference 2011
(TAC 2011), Gaithersburg, Maryland, USA, Novem-
ber.
Liang Zhou, Chin-Yew Lin, Dragos Stefan Munteanu,
and Eduard Hovy. 2006. Paraeval: Using paraphrases
to evaluate summaries automatically. In Proceedings
of the Human Language Technology Conference of the
North American Chapter of the Association for Com-
putational Linguistics (HLT-NAACL 2006), Strouds-
burg, PA, USA.
1014