Getting to know probability distributions
Bạn đang xem bản rút gọn của tài liệu. Xem và tải ngay bản đầy đủ của tài liệu tại đây (2.08 MB, 17 trang )
Follow
564K Followers
·
Editors' Picks
Features
Explore
Grow
Contribute
About
Getting to know probability
distributions
Back-to-basics on data science fundamentals
Cassie Kozyrkov 6 days ago · 6 min read
Test yourself! How many of these core statistical concepts are you able to
explain?
CLT, CDF, Distribution, Estimate, Expected Value, Histogram, Kurtosis,
MAD, Mean, Median, MGF, Mode, Moment, Parameter, Probability,
Create PDF in your applications with the Pdfcrowd HTML to PDF API
PDFCROWD
PDF, Random Variable, Random Variate, Skewness, Standard
Deviation, Tails, Variance
Got some gaps in your knowledge? Read on!
Note: If you see an unfamiliar term below, follow the link for an explanation.
Random variable
A random variable (R.V.) is a mathematical function that turns reality into
numbers. Think of it as a rule to decide what number you should record in
your dataset after a real-world event happens.
A random variable is a rule for simplifying reality.
For example, if we’re interested in the roll of a six-sided die, we might
define X to be the random variable that maps your gooey sensory
experience of a real-world die roll to one of these numbers: {1,2,3,4,5,6}.
Or maybe we’ll only record {0, 1} for odd/even. It all depends on how we
choose to define our R.V.
Create PDF in your applications with the Pdfcrowd HTML to PDF API
PDFCROWD
Image: SOURCE.
(If that’s too technical, just think of a random variable as a way to indicate
an outcome: if X is about die rolls, X=4 is a way to say that we rolled a 4. If
Create PDF in your applications with the Pdfcrowd HTML to PDF API
PDFCROWD
it’s not technical enough, you’ll almost surely love taking a measure theory
class.)
Random Variate
Many students confuse random variables with random variates. If you’re a
casual reader, skip this, but enthusiasts take note: random variates are
outcome values like {1, 2, 3, 4, 5, 6} while random variables are functions
that map reality onto numbers. Little x versus big X in your textbook’s
formulas.
Probability
P(X=4) would be read in English as “The probability that my die lands with
the 4 facing up.” If I’ve got a fair six-sided die, P(X=4)=1/6. But… but…
but… what is probability and where does that 1/6 come from? Glad you
asked! I’ve covered some probability basics for you here, with combinatorics
thrown in as a bonus.
Distribution
Create PDF in your applications with the Pdfcrowd HTML to PDF API
PDFCROWD
A distribution is a way to express the probabilities of the entire set of values
that X can take.
A distribution gives you popularity contest results in
graphical form.
Probability Density Function (PDF)
The best way to summon a distribution is to utter its true name: its
probability density function. What does such a function signify? If we put X
on the x-axis (yup), then the height on the y-axis shows the probability of
each outcome.
Create PDF in your applications with the Pdfcrowd HTML to PDF API
PDFCROWD
A probability density function gives you popularity contest results for your whole population. It’s basically the
population histogram. Horizontal axis: population data values. Vertical axis: relative popularity. To learn more
about this graph and the details that I omitted, head over to here.
As I’ve explained in detail here, a distribution is essentially an imaginary
idealized bar chart (for discrete R.V.s) or histogram (for continuous R.V.s).*
In other words, the distribution is taller for more likely values of X. The
distribution for a fair die has equal height for all outcomes (“discrete
uniform”); not so for a weighted die.
Create PDF in your applications with the Pdfcrowd HTML to PDF API
PDFCROWD
Like distributions, you can think of bar charts and histograms as popularity contests. Or tip jars. That works
too.
Cumulative Density Function (CDF)
This is the integral** of the probability density function. In English? Instead
of showing how likely each value of X is, the function shows the cumulative
probability for everything X and below. If you’re thinking of percentiles,
awesome. The percentile is what’s on the x-axis and the percentage is
what’s on the y-axis.
Probability: Getting a 3 on a six-sided die? 1/6
Cumulative: Getting a 3 or lower? 3/6
The 50th percentile is a 3. The 3 goes on the x-axis, 50% goes on the y-axis.
Choosing Your Distribution
How do you know what distribution is right for your X? Statisticians have
two favorite approaches. They either (1) estimate empirical distributions
from their data — using, you guessed it, histograms! — or they (2) make
theoretical assumptions about which member of a popular distribution
Create PDF in your applications with the Pdfcrowd HTML to PDF API
PDFCROWD
catalog looks most similar to how they believe their data source behaves. (If
you have data, it’s a great idea to check those distribution assumptions with
a hypothesis test.)
The standard approach to choosing a distribution involves plotting a histogram and comparing its shape with
the shapes of theoretical distributions in a catalog, such as the list of distributions on Wikipedia, in your
textbook, or on the sales page for the distribution plushies above. (And now you get to wonder just how much
I’m kidding.) Image: SOURCE.
Create PDF in your applications with the Pdfcrowd HTML to PDF API
PDFCROWD
When we look at our catalog, we notice that the various distributions have
names like “Normal” or “Chi-squared” or “Cauchy”… which gives students
the mistaken impression that these are the only options. They’re not.
They’re just the famous ones. Just like people, distributions might be
famous for all the wrong reasons.
Just like people, distributions might be famous for all
the wrong reasons.
On the plus side, named distributions come with neat PDFs and a bunch of
calculations pre-done for you.
On the minus side, your application might not fit anything in a catalog.
Thank goodness for the empirical option.
Parameters
Here’s the probability density function for a very popular distribution, the
normal distribution (a.k.a. Gaussian or bell-shaped curve):
Create PDF in your applications with the Pdfcrowd HTML to PDF API
PDFCROWD
Let’s be honest — the insights aren’t exactly leaping off the page. That’s why
we tend to prefer asking questions about specific parameters of interest to
us. In statistics, parameters summarize populations or distributions. For
example, if you’re asking whether the distribution peaks at zero, you’re
asking about the location of its mode (a parameter). If you’re asking how fat
the distribution is, you’re asking about its variance (another parameter). In
a moment, I’ll take you on a tour of a few of my favorite parameters.
But before we do that, let me answer this question: instead of computing
summary measures, why don’t we just plot this function and ogle it? We’re
not ready yet.
Create PDF in your applications with the Pdfcrowd HTML to PDF API
PDFCROWD
If you look at the function above, you’ll notice that there are some Greek
letters in there: μ and 𝜎.*** These are special parameters for this
distribution; until we replace them with numbers, we’re not ready to plot
anything. Without them, all we can do is get a vague sense of the abstract
shape of the distribution, like so:
Image: SOURCE.
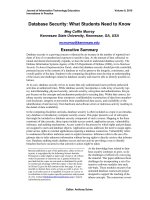
Want axes? Put numbers where the Greek letters are. For example, here’s
what you get with μ = 0 vs 5 vs 10 and 𝜎 = 1:
Create PDF in your applications with the Pdfcrowd HTML to PDF API
PDFCROWD
Create PDF in your applications with the Pdfcrowd HTML to PDF API
PDFCROWD
Pink μ = 0, Blue μ = 5, Green μ = 10
There’s plenty more Greek to enjoy, since other distributions use other
characters for their special quantities. Eventually, you’ll get sick of it and
start using θ₁, θ₂, θ₃, etc. for all of them.
It’s also worth remembering that distributions and their parameters are
theoretical objects involving assumptions about a population you haven’t
got all the info on, whereas a histogram is a more practical object — a
summary of sample data that you do have. You’ll avoid plenty of confusion
if you keep concepts to do with samples and populations separate, so it
might be worth brushing up on them here.
Create PDF in your applications with the Pdfcrowd HTML to PDF API
PDFCROWD
You can find my explanations here.
And now we’re ready for a tour of my favorite parameters, to be continued
in Part 2.
Footnotes
*Technically, a discrete R.V.’s function is called a probability mass function
instead of a probability density function, but I haven’t met anyone who
cares if you call a PMF a PDF.
**If you have a discrete R.V., then it’s the sum instead of the integral.
***Nothing special about that π. It’s just the regular one we celebrate on
March 14th.
Create PDF in your applications with the Pdfcrowd HTML to PDF API
PDFCROWD
Sign up for The Variable
By Towards Data Science
Every Thursday, the Variable delivers the very best of Towards Data Science: from
hands-on tutorials and cutting-edge research to original features you don't want to
miss. Take a look.
Get this newsletter
Your email
By signing up, you will create a Medium account if you don’t already have one. Review our Privacy Policy for more information
about our privacy practices.
1.2K
Data Science
5
Mathematics
Statistics
Data
Editors Pick
More from Towards Data Science
Follow
Your home for data science. A Medium publication sharing concepts, ideas and
codes.
Create PDF in your applications with the Pdfcrowd HTML to PDF API
PDFCROWD
Read more from Towards Data Science
More From Medium
Ten Advanced SQL Concepts You Should Know
for Data Science Interviews
7 Useful Tricks for Python Regex You Should
Know
Terence Shin in Towards Data Science
Christopher Tao in Towards Data Science
15 Habits I Stole from Highly Effective Data
Scientists
The flawless pipes of Python/ Pandas
Dr. Gregor Scheithauer in Towards Data Science
Madison Hunter in Towards Data Science
6 Machine Learning Certificates to Pursue in 2021
Jupyter: Get ready to ditch the IPython kernel
Sara A. Metwalli in Towards Data Science
Dimitris Poulopoulos in Towards Data Science
What Took Me So Long to Land a Data Scientist
Job
Semi-Automated Exploratory Data Analysis (EDA)
in Python
Soner Yıldırım in Towards Data Science
Destin Gong in Towards Data Science
Create PDF in your applications with the Pdfcrowd HTML to PDF API
PDFCROWD
About
Create PDF in your applications with the Pdfcrowd HTML to PDF API
Help
Legal
PDFCROWD