Assessment of geomorphic processes and active tectonics in Con Voi mountain range area (Northern Vietnam) using the hypsometric curve analysis method
Bạn đang xem bản rút gọn của tài liệu. Xem và tải ngay bản đầy đủ của tài liệu tại đây (858.56 KB, 15 trang )
Vietnam Journal of Earth Sciences Vol 38 (2) 202-216
Vietnam Academy of Science and Technology
Vietnam Journal of Earth Sciences
(VAST)
/>
Assessment of geomorphic processes and active tectonics
in Con Voi mountain range area (Northern Vietnam) using
the hypsometric curve analysis method
Ngo Van Liem*1, Nguyen Phuc Dat2, Bui Tien Dieu3,4, Vu Van Phai5, Phan Trong Trinh1,
Hoang Quang Vinh1, Tran Van Phong1
1
Institute of Geological Sciences, Vietnam Academy Science and Technology
Vietnam Institute of Geosciences and Mineral Resources, Ministry of Natural Resources and Environment
3
Geographic Information System Group, Department of Business Administration and Computer Science, University
College of Southeast Norway
4
Faculty of Geomatics and Land Administration, Hanoi University of Mining and Geology
5
Faculty of Geography, VNU University of Sciences
2
Received 25 January 2016. Accepted 7 June 2016
ABSTRACT
The main objective of this study is to assess geomorphic processes and active tectonics in the Day Nui Con Voi
(DNCV) area of Vietnam. For this purpose, a spatial database was collected and constructed, including DEM (Digital
Elevation Model) and a geological map. The hypsometric curve (HC) analysis method and its statistical moments
were adopted to use for the assessment. These methods have been widely used for the assessment of geomorphic
processes and active tectonics in many areas in the world showing promising results. A total of 44 sub-basins of the
Red River and the Chay river were analyzed. The result shows that 3 curve-types such as "straight- shape", "Sshape", and concave were found; with the concave curve being the dominant and widely distributed in the northeast
side and in the south of the southwestern side of the study area. The hypsometric integral (HI) values are rather small
with the largest value is 0.37 and the smallest one is 0.128. Other statistical moments of the hypsometric curve, i.e.
skew (SK), kurtosis (KUR), and the density function (density skew - DSK and density kurtosis-DKUR) show great
values, which increased in the south direction of the area study. Accordingly, recent active tectonics (uplift-lower) in
the study area is generally weak; however, they are also not completely homogeneous and can be distinguished by
different levels. The southwestern side is being lifted higher than the northeastern side. The northern part is being
lifted larger than the southern part. In the region, the uplift activities were increased gradually in the PlioceneQuaternary and could have stopped at certain time in the past. The current geomorphic processes are mainly
headward erosion in the upstream.
Keywords: Geomorphic index; Hypsometric curve; Statistical moments; Active tectonics; Red River fault; Day
Nui Con Voi.
©2016 Vietnam Academy of Science and Technology
1. Introduction*
The Red River shear zone (RRSZ) extends
*
Corresponding author, Email:
202
over a length of 1000 km from Tibet to the
East Vietnam Sea. Along the shear zone, four
narrow massifs of high-grade metamorphic
complexes, the Day Nui Con Voi in Vietnam,
N.V. Liem, et al./Vietnam Journal of Earth Sciences 38 (2016)
Ailao Shan, Diancang Shan and Xuelong
Shan in Yunnan, China are considered as the
"axes" of the RRSZ - important geological
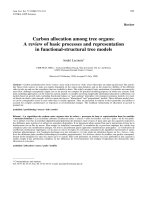
boundaries in Asia. The Day Nui Con Voi
range is in the southeasternmost part of this
shear zone (Figure 1). This area has been received attentions of many geoscientists and
seen as a key to understand the geodynamics
of the RRSZ (Leloup et al., 1995; 2001; Le et
al., 2004). The achieved results have contributed to the explanation and clarification of
many issues in geology, tectonics and
geomorphology. However, some points are
not consistent and disputed (e.g. Tran et al.,
1999; 2002; Le, 2003; Le et al., 2001; Phan et
al., 2004; Wang et al., 2000; Leloup et al.,
2001. Studies of tectonics in this area have not
paid much attention to the role and
significance of geomorphology; especially,
the lack of quantitative analyses of landscapes
using various geomorphic indices.
Geomorphic indices have been found to be
useful in identifying areas experiencing tectonic activity because they facilitate rapid
evaluation of large areas (Strahler, 1952; Bull
and McFadden, 1977; Keller and Pinter, 2002;
Joshi et al., 2013). Furthermore, active faults
and growing folds commonly have topography that is useful in identifying different
geomorphic or structural segments along the
fault and estimating the most active segments
(Azor et al., 2002; Font et al., 2010; Joshi et
al., 2013). Segments along a morphostructure
may be outlined and identified to determine
the relative intensity of tectonic activity along
a fault by utilizing a detailed study of drainage
anomalies coupled with geomorphic indices
(Azor et al., 2002; Keller and Pinter, 2002;
Joshi et al., 2013). Moreover, with the current
development of GIS, the calculation of geomorphic indices has become easier (Troiani
and Della Seta, 2008; Pérez-Peña et al., 2009;
Joshi et al., 2013). So, the geomorphic indices
have been widely used in geomorphology and
active tectonics (e.g., see in the above references).
In Vietnam, despite some initial geomorphic indices also to be used quite successfully in several studies such as Nguyen et al.
1999; Phung, 2011; Phan, 2014; Nguyen,
2015. However, most of the calculations in
these studies were manually carried out based
on topographic maps and satellite images; so
the results often depend on the ability to
estimate, sight and experience of experts who
conducted these studies. Therefore, the analysis and assessment of geomorphic indices
have not been shown clearly roles, the significances, and its relationship to the geomorphological processes and active tectonics.
In this paper, we present quantitative
analyses and assessments of the hypsometric
curve (HC) and its statistical moments in relationship between geomorphic processes and
active tectonics in the DNCV area. The HC
index is one of the geomorphic indices that
has been considered as a powerful tool for
quantifying the topographic features and
differentiate zones deformed by active
tectonics (Keller and Pinter, 2002; Chel et al.,
2003; Pérez-Peña et al., 2009; Pedrera et al.,
2009; Mahmood and Gloaguen, 2012).
However, in Vietnam, this is the first time the
method is adopted for the assessment of the
active tectonics in the Lo River fault zone and
the Tam Dao area (Ngo et al., 2016), but
statistical moments of the hypsometric curve
has not been analyzed and assessed.
2. Tectonic, geologic, and geomorphic
settings
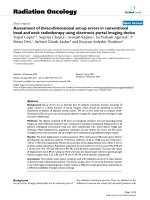
The Day Nui Con Voi (DNCV) mountain
is less than 10 km wide and more than 250 km
long, extending from Lao Cai to Viet Tri, and
appearing as an elongated NW-trending core
of metamorphic rocks (Tran et al., 1998)
(Figure 2). The altitude of the mountain is
peaked at Nui Lai of 1450 m, then descending
to the northwest and southeast. This mountain
is characterized by three main strips, with the
NW-SE direction and separated by the parallel
lines with the Red River. The topography in
this area is asymmetry: slope of the northeastern side is smaller than the southwest side; on
the northeastern side have some narrow strips
extending along the main mountain; the
southwest side is divided into individual
peaks. The center strip of the DNCV is
uplifted (500-1000 m) compared with the two
sides (<500 m) (Le et al., 2004).
203
Vietnam Journal of Earth Sciences Vol 38 (2) 202-216
Hoang Sa
Truong Sa
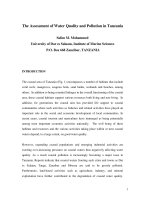
Figure 1. (a). The Red River shear zone in Asia, (b) geological sketch map around the Day Nui Con Voi (Modified
after Tran et al., 1998; 2003)
204
N.V. Liem, et al./Vietnam Journal of Earth Sciences 38 (2016)
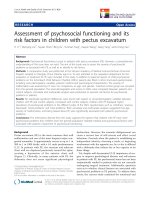
Figure 2. Geological strength level map in the Day Nui Co Voi and surrounding area
As for the Ailao Shan, the DNCV is a
narrow high-grade metamorphic rocks and are
mapped as Proterozoic (Phan et al., 1994;
2012). It is composed chiefly of garnetbiotite-sillimanite gneiss and garnet-biotite
gneiss, and minor two-mica schists with
garnet. The DNCV also includes amphibolite
layers, migmatites, mylonite bands and small
lenses of marble. This rock assemblage suggests that the DNCV was formed with severe
deformation and deep metamorphism of sedimentary rocks (Tran et al., 1998; Phan et al.,
1994; 2012). The rocks within the DNCV are
strongly foliated. The foliation, which is
marked by the preferred orientation of planar
minerals (biotite and amphibole) and by
flattened quartz or feldspar ribbons,
commonly strikes parallel to the local trend of
the gneiss core and dips steeply (~70º) to the
northeast. The lineation is deduced by
elongated quartz and feldspar ribbons, long
tails of feldspar porphyroblasts, stretched
leucocratic veins and preferred orientations of
sillimanite crystal shapes all locally plunge to
the northwest in a range of 5-20º (Tran et al.,
1998). A mylonite band about 200-500 m
wide is well exposed in the center of the
northeastern flank of the shear zone. Foliation
and lineation within the mylonite band are
parallel to those of the host gneisses. Numerous kinematic indicators suggest a left-lateral
shear movement of this mylonite band (Phan
et al., 1995; Tran et al., 1998). The foliation of
gneisses is then cut by two sets of steep
conjugate faults, N10ºE striking dextral and
more numerous N110ºE striking sinistral,
205
Vietnam Journal of Earth Sciences Vol 38 (2) 202-216
indicating N60ºE shortening. It shows that a
successive deformation with ENE shortening
(Tran et al., 1998).
From Vietnam-China border, at Lao Cai,
the Red River valley fault splays into two
roughly parallel strands, the Chay River and
Red River faults, which bound the DNCV to
the north and south, respectively. Currently,
both fault-strands appear to slip mostly rightlateral slip, with variable components of
normal slip (Allen et at., 1984; Phan et al.,
1994, 2004, 2012). Narrow straight ‘grabens’,
which are traced along the Red River and
Chay River faults, are filled with Late Miocene sediments containing abundant pebbles
of gneisses and mylonites, being interpreted
as a synorogenic formation resulting fromthe
reversal of fault movements from left-lateral
to right-lateral about 5 m.y. ago (Leloup et al.,
1994). On the SW and NE sides of the DNCV
also exist some small faults run nearly parallel
with the Red River and Chay River faults,
respectively (Le et al., 2004).
3. Data and methods
To determine the hypsometric curve and its
statistical moments for the study area, we used
Digital Elevation Model (DEM) with 30 m
resolution which is provided by the United
States Geological Survey (USGS). The DEM
is analyzed by ArcGIS software; it is useful
tools to ensure accuracy, quick and less
expensive in the calculation of morphology
parameters. The calculation in this study is
carried out automatically using the extension
tools of ArcGIS 10.1 software (Pérez-Peña et
al., 2009). Geological map of the study area
was constructed using the digital Geological
and Mineral Resources maps at the scale of
1:200,000 (The Department of Geology and
Minerals of Vietnam). We used the active
faults from the Phan et al. (2004, 2012), Ngo
et al. (2006, 2011), and Le et al. (2004).
3.1. Hypsometric curve and hypsometric
integral
The hypsometric curve describes the distribution of elevations across an area of land
with different scales from one drainage basin
to the entire planet. The curve is created by
plotting the proportion of total basin height
(h/H = relative height) against the proportion
of total basin area (a/A = relative area)
(Strahler, 1952; Keller and Pinter, 2002)
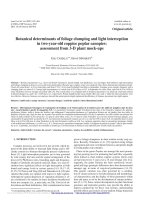
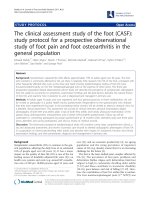
(Figure 3). The shape of the hypsometric
curve is related with the stage of geomorphic
development of the basin. Convex
hypsometric curves are typical of a youthful
stage; S-shaped curves are related to a
maturity stage, and concave curves are
indicative of a peneplain stage (Strahler,
1957; Gardner et al., 1990; Delcaillau et al.,
1998; Keller and Pinter., 2002; Pérez-Peña et
al., 2009) (Figure 3).
Figure 3. Basic hypsometric curves and its geomorphological development cycles (Modified after Strahler, 1952;
Pérez-Peña et al., 2009; Mahmood and Gloaguen, 2012)
206
N.V. Liem, et al./Vietnam Journal of Earth Sciences 38 (2016)
A simple way to characterize the shape of
the hypsometric curve for a given drainage
basin is to calculate its hypsometric integral
(HI). The integral is defined as the area under
the hypsometric curve and can be calculated
(Keller and Pinter, 2002):
HI = (Hmean - Hmin) / (Hmax - Hmin)
(1)
where HI is hypsometric integral, Hmax is
maximum elevation, Hmin is minimum elevation, and Hmean is mean elevation.
The parameters in the formula (1) can be
identified by analyzing the DEM with the GIS
software. The HI index has been used, as well
as the hypsometric curve, to infer the stage of
development of a basin. The values of the HI
always vary from 0 to 1. Values near 1 indicate a state of youth and are typical of convex
curve. However, in the mature stage of the basin, it has a lot of S-shape and concave shape
but the HI values often similar. Meanwhile, to
distinguish or assessment correlate between
the basins, we often base on the statistical
indices are given below.
3.2. Statistical moments of the hypsometric
curve
In addition to analyzing hypsometric integral (HI) index, we also calculate and analyze
other statistic moments of hypsometric curve
(HC): skewness of the hypsometric curve
(hypsometric skewness, SK), kurtosis of the
hypsometric curve (hypsometric kurtosis,
KUR), skewness of the hypsometric density
function (density skewness, DSK), and kurtosis of the hypsometric density function (density skewness, DKUR).
Harlin (1978) developed a technique that
treated the hypsometric curve as a cumulative
probability distribu-tion and used its statistic
moments to describe it quantitatively. It consists of the hypsometric curve by a continuous
polynomial function with the form (Harlin,
1978) (Figure 3).
f(x) = a0 + a1x+ a2x2+… + anxn
and HI can be defined:
HI = ∬
(2)
(3)
where R is the region under the hypsometric
curve, x is relative area, and y is relative
height.
Skewness of the hypsometric curve is
defined by:
(4)
SK = µ 3/(µ 21/2)3
where µ 3 and µ 2 are the third-order and
second-order moment about x,
µ3 =
∬( −
)
(5)
µ2 =
∬( −
)
(6)
where μ 1 is the fist-order moment or x mean
or x centroid,
µ1 = ∬
(7)
Kurtosis of the hypsometric curve is
defined by:
KUR =
(
/ )
(8)
where µ 4 is fourth-order moment about x,
µ4 =
∬( −
)
(9)
Density skewness (DSK) and density
kurtosis (DKUR) are defined similarly except
that now y is the first derivative of the
hypsometric curve, i.e., the density function of
the hypsometric curve (replacing y with y’).
These definitions are chosen so that they are
consistent with Harlin’s original work (Harlin,
1978).
In statistics, skewness and kurtosis describe the shape of a distribution relative to
the normal distribution and are dimensionless.
Skewness characterizes the degree of asymmetry of a distribution around its mean. A
positive value of skewness (SK>0) signifies a
distribution with an asymmetric tail extending
out toward a more positive x (skewed to the
right); a negative value (SK<0) signifies a
distribution whose tail extends out toward a
more negative x (skewed to the left); and the
skew is zero (SK=0), when the variable
distribution is symmetrical. Kurtosis measures
the relative peakedness or flatness of a
distribution, relative to a normal distribution.
Larger kurtosis (KUR>3) indicates a "sharper"
207
Vietnam Journal of Earth Sciences Vol 38 (2) 202-216
peak than normal distribution (the same Luo,
2000 and Pérez-Peña et al., 2009, under the
definition used in this paper, the kurtosis of a
normal distribution is 3); smaller kurtosis
indicates "flatter" peak than normal distribution.
These statistics are applied to the distribution function of the hypsometric curve order
to explain the erosion and slope basins and
has been tested by Harlin., (1978); Luo.,
(1998, 2000); Pérez-Peña et al., (2009).
Accordingly, the hypsometric skewness represents the amount of headward erosion in the
upper reach of a basin (Figure 4); density
skewness indicates slope change; a large value
of kurtosis signifies erosion on both upper and
lower reaches of a basin, and density kurtosis
delineates midbasin slope.
Figure 4. Schematic diagram showing the relationship
between the shape of the hypsometric curve and its
integral, skewness, and density skewness (Luo, 2000)
These statistical moments can be used to
describe and characterize the shape of the
hypsometric curve and, hence, to quantify
changes in the morphology of the drainage basins. In many cases, these parameters are very
useful for the hypsometric analysis, especially
in basins with similar hypsometric integrals
but different shapes (Pérez-Peña et al., 2009).
4. Results
In the DNCV area, the hypsometric curve
analysis method and its statistical moments
are used for assessment at 44 sub-basins of the
208
Red river and the Chay river. In which, 30
sub-basins are located in the Red River (from
the basin 1 to 30) and 14 sub-basins are
located in the Chay River (from the basin 31
to 44) (Figure 5). The results are showed on
Table 1, Figures 5 and 6.
In the study area, the hypsometric curve
can be grouped into 3 curves: "straightshape", "S- shape", and concave curves (Figs.
6a, 6b and 6c,d, respectively) and no convex
curve. Accordingly, concave curve has the
largest proportion (26/44 basins), followed by
the S-shape (10/44 basins) and final are
straight-shape (8/44 basins). Consistent with
them, the HI indices are also very small, the
largest value is the basin No.13 (HI = 0.37)
and the smallest is the basin No.28 (HI =
0.128). In which, the basins with "straightshape" have the HI values are greater than 0.3;
the "S-shape" have HI values are greater than
0.25 and the concave curves with largest HI
value is 0.28 (Table 1).
The results shown in Table 1 show that the
skew values are from 0.45 to 1.3 and these
values do not change much in the basins with
straight-shape of the hypsometric curve (the
skew values range from 0.55 to 0.83) and the
"S-shape" of the hypsometric curve (0.45
considerable variability in the basins with
concave shape of hypsometric curve (the skew
values range from 0.46 to 1.3). In the basins
with straight-shape and s-shape of hypsometric curve, the density skew values range from
0.33 to 0.96, and the basins have concave
curve, this values range from ~ 0.78 to 1.58.
The kurtosis values range from ~2.0 to 4.1; in
there, the basins have the hypsometric curve
with the “straight” and “S” shape, the kurtosis
values are less than 3.0 (the kurtosis of a normal distribution is 3.0). The density kurtosis
values range from 1.75 to 4.87. As the skew
values, the density kurtosis values are not
change much in the hypsometric curve basins
with the “straight” and “S” shape, and quite
change in the concave shape basins. The
variation values of the main statistical moments indices in the DNCV are showed on
Figure 7.
N.V. Liem, et al./Vietnam Journal of Earth Sciences 38 (2016)
Figure 5. Schematic distribution of the hypsometric curve in the DNCV area
5. Discussion
The hypsometric curve and its statistical
moments influenced by active tectonics, are
also affected by geological and regional climatic characteristics (Moglen and Bras, 1995;
Willgoose and Hancock, 1998; Huang and
Niemann, 2006; Pedrera et al., 2009). Because
the study area is located almost in the center
of the DNCV with a narrow range, so the
climate is basically not much different.
According to the geological map (1:200,000)
of the Department of Geology and Minerals of
Vietnam, the DNCV area has identical geol-
ogy and is composed chiefly of high-grade
metamorphic rocks (Figure 2). So, anomalies
(if any) of geomorphic indices in this area are
mainly a reflection of the recent tectonic
activity.
Regarding to the difference of the number
basins in the northeast side (14/44) and the
southwest side (30/44) of the DNCV area, because in the southeastern part of this area has
the Thac Ba hydropower dam, so the basins
should flow directly into the lake having been
changed base erosion level by the volume of
water. Therefore, we did not use these basins
in the calculations. On the other hand, due to
209
Vietnam Journal of Earth Sciences Vol 38 (2) 202-216
relief features of the DNCV with slopes in the
southwestern side (in the Red River basin) is
greater than the northeastern side (in the Chay
River basin). Therefore, area of the basins in
the southwestern side usually smaller than the
northeastern side and opposite side, the
number of basins in the northeastern side is
less than in the southwestern side. The steeper
and higher of the southwestern side than the
northeastern side reflected lift active of the
DNCV in the southwestern side is higher than
the northeastern side. This will be clarified by
analyze the hypsometric curve and its statistical moments as below.
Figure 6. Hypsometric curves of the sub-basins in the DNCV area; (A) - “Straight-shape” group; (B)- “S-shape”
group; (C) and (D)- concave curves
As the results presented above, in the study
area, the hypsometric curve has revealed 3
curves such as "straight- shape", "S- shape",
and concave curves, but no convex curve. In
there, the hypsometric curve is almost concave curve (26/44 basins) and fit it, the HI
values mainly small; maximum is 0.37
(Figure 5 and Table 1). Accordingly, the basin
in this study area is mainly in the oldest stage,
210
meaning that the basin has reached the
equilibrium in the longitudinal profiles of the
river (or stream). In these basins, the
dominant geomorphological processes usually
are lateral erosion, vertical erosion (if any)
also occurs in the upstream area. Another
way, the active tectonics (uplift-lower) in
these basins is basically weak. However, there
still exists the hypsometric curve as "straight-
N.V. Liem, et al./Vietnam Journal of Earth Sciences 38 (2016)
shape" and "S-shape" are distributed in some
parts of the study area and focused mainly in
the northern part to the center of the
southwestern side of the DNCV. Whereas, in
the northeastern side of the DNCV, the
hypsometric curve mainly is concave curve
(Figure 5 and 6a,b). Tectonic activity in the
study area is not fully uniform. Accordingly,
uplift active in the southwestern side (Red
River basin) basically is greater than that in
the northeastern side (Chay River basin). In
which, some of the northern segment uplifted
is greater than southern segment (Figure 5).
This result is consistent with Le et al. (2001,
2004). In the northeastern side, where the
Chay River fault cuts across at the foot of the
slope, almost of basins with hypsometric
curve are concave curve, except the basin 32
and 33. This is consistent with previous
studies that Chay River fault is right-lateral
slip (Nguyen, 2002; Phan et al., 2004, 2012;
Ngo et al., 2006, 2011).
Table 1. The statistical moments of the hypsometric curve in the DNCV area (HI - Hypsometric integral, SK - Skew;
KUR - Kurtosis, DSK - Density skew and DKUR - Density kurtosis
No
1
2
3
4
5
6
7
8
9
10
11
12
13
14
15
16
17
18
19
20
21
22
HI
0.335
0.294
0.294
0.269
0.272
0.309
0.250
0.284
0.305
0.311
0.329
0.320
0.370
0.333
0.270
0.329
0.347
0.304
0.259
0.282
0.213
0.239
SK
0.526
0.451
0.452
0.487
0.609
0.595
0.579
0.788
0.598
0.643
0.667
0.642
0.605
0.706
0.848
0.717
0.773
0.833
0.994
1.126
1.302
1.106
KUR
2.141
2.016
2.003
2.055
2.164
2.221
2.200
2.607
2.236
2.285
2.482
2.386
2.375
2.562
2.792
2.523
2.667
2.877
3.176
3.756
4.040
3.679
DSK
0.666
0.614
0.736
0.658
0.964
0.612
0.555
0.867
0.662
0.752
0.444
0.517
0.339
0.525
0.873
0.649
0.714
0.688
1.082
1.003
1.575
1.106
DKUR
2.002
1.758
1.956
1.829
2.370
1.804
1.724
2.410
1.916
2.039
1.864
1.848
1.759
2.010
2.539
2.070
2.292
2.366
3.150
3.402
4.805
3.567
According to Al Hamdouni et al. (2008),
the hypsometric curve often has convex curve
when HI index greater than 0.5; intermediate
form between the concave and convex shape
(S-shape) or "straight-shape" when the HI
value in the range of 0.4 to 0.5 and the HIvalue less than 0.4, the hypsometric curve has
a concave shape. In the study area, as the
Table 1, Figure 5 and Figures 6a, b, the HI
No
23
24
25
26
27
28
29
30
31
32
33
34
35
36
37
38
39
40
41
42
43
44
HI
0.188
0.255
0.214
0.190
0.169
0.128
0.156
0.137
0.205
0.344
0.290
0.254
0.220
0.227
0.261
0.252
0.214
0.185
0.240
0.257
0.199
0.191
SK
1.174
0.816
0.953
1.169
0.848
1.183
1.019
0.626
0.983
0.550
0.463
0.752
0.860
1.033
0.825
0.727
0.885
1.137
0.933
0.889
1.306
1.064
KUR
3.626
2.726
2.900
3.341
2.560
3.328
2.766
2.138
2.974
2.232
1.999
2.498
2.570
3.112
2.673
2.456
2.812
3.381
3.032
3.000
4.100
3.101
DSK
1.402
0.839
1.189
1.550
1.070
1.499
1.346
0.904
1.218
0.327
0.495
0.841
1.063
1.324
0.970
0.780
0.976
1.415
0.970
0.820
1.563
1.453
DKUR
4.109
2.485
3.158
4.203
2.653
3.987
3.282
2.147
3.249
1.591
1.525
2.277
2.644
3.638
2.661
2.155
2.689
3.916
2.916
2.665
4.875
3.925
values of the hypsometric curve with straightshape and S-shape are less than 0.4 and
smallest is 0.25. Thus, when using and
analyzing the HI index in different areas, need
to combine with its hypsometric curve.
Because in many cases, the basins with
similar hypsometric integrals but different
shapes (Pérez-Peña et al., 2009). In that cases,
these other statistical moments are necessary
211
Vietnam Journal of Earth Sciences Vol 38 (2) 202-216
to consider for the hypsometric analysis
(Figure 7a, b).
(a)
(b)
Figure 7. a) The variation of the statistical moments of the hypsometric curve (the basins in the southwestern side of
the DNCV); b) The variation of the statistical moments of the hypsometric curve (the basins in the northeastern side
of the DNCV)
In the study area, according to the results
in Table 1, Figure 7 (a, b) and in the direction
from northwest to southeast, unless the HI
index (downward trend), basically, other statistical moments of the hypsometric curve are
likely to increase in both sub-basin systems of
the Red River and Chay River. As the results
of skew, the values range from 0.45 to 1.3
(SK>0), this mean the basins in the study with
the geomorphological processes almost are
represent the amount of headward erosion in
212
the upper reach of the basin (Harlin, 1978;
Luo, 2000; Pérez-Peña et al., 2009). This
trend is basically increased in the direction
from northwest to southeast to the basin of the
study area. Consistent with SK index, the
DSK index also reflects a larger slope in the
upper reach of the basin and also showed
upward trend from northwest basins to the
southeast basins. In addition, a larger value of
kurtosis (almost is the concave shape in the
southern of the DNCV in both the northeast
N.V. Liem, et al./Vietnam Journal of Earth Sciences 38 (2016)
and southwest sides; Table 1 and Figure 7)
signifies erosion on both upper and lower
reaches of a basin (Harlin, 1978; Luo, 2000).
These results also showed, in the basins which
have large KUR values then so are DKUR
values (Table 1 and Figure 7). This mean that,
this basin also has large slope in the middle
part of the basin (Harlin, 1978; Luo, 2000;
Pérez-Peña et al., 2009). What makes this area
contain these features (erosion process in the
both of the upstream and downstream area,
and addition large slope in the middle part)?
According to Le (2001, 2004) and Ngo
(2011), the regional topography has stepped
clearly. This step by the heterogeneously
raising activities and the active fault branches
(of the Red River and the Song Chay Faults)
on both the northeast and southwest sides of
the DNCV area (Le, 2001, 2004; Ngo, 2011).
According to Pérez-Peña et al. (2009), the
value increases of the KUR and DKUR indexes (when the same hypsometric curve and
hypsometric integral index) often show
upward trend of recent tectonic activity. However, in the study area, the higher anomalies
of the KUR and DKUR indexes still lie in the
basins with the hypsometric curve showing
concave shape (Table 1, Figure 5 - Figure 7).
Thus, if only individual basins with curve
concave shape are considered, basins with
larger KUR and DKUR values will show
stronger tectonic activity. If all basins of the
study area are considered, the higher anomalies KUR and DKUR indexes at the basins
with concave curve shape possibly suggest the
following remarks: According to basic hypsometric curve model and geomorphological
development cycles shown by the changes of
the hypsometric curves (Figure 3), the hypsometric curves with concave curve shape are
the oldest stage of geomorphological cycles,
and it is the final stage of the cycle to stabilize
the tectonic cycle to pass on to a new tectonic
activity cycle. This means, the tectonic active
in the study area possibly is the last period of
stabilization tectonic cycle and the beginning
of a new tectonic activity cycle. If so, the
above assumption is appropriated in anticipation of Allen (1984) to repeat the cycle of
large earthquakes along the Red River Fault
Zone is about 1800 years, while in the region
of Yunnan, China had strong earthquake
occurred 8.1 to 8.3 on the Richter scale and
occurred approximately 1000 to 2000 years ago.
In summary, the hypsometric curves in the
study area are mainly concave shapes; some
curves are intermediate form between the concave and convex shape (in "straight" and "S"
shape). HI index is basically small and tends
to decrease to the southeast. The skew and
kurtosis and their density function are basically large and increasing trend to the southeast. An overview, the recent tectonic activity
(uplift - lower) in the study area is generally
weak. In which, the southwestern side is being
lifted higher than the north-eastern side. The
northern part is being lifted larger than the
southern part. In the region and surrounding
area, the strong uplift activities and increased
gradually in the Pliocene-Quaternary (modeled after Le et al., 2004) could have stopped
at certain time in the past. The current geomorphic processes are mainly headward
erosion in the upstream. These results will be
clarified in the next study when there is a
combination of many different geomorphic
indices.
6. Conclusions
The hypsometric curves and its statistical
moments are useful tools to assess the geomorphological processes and recent tectonic
activity of the region as well as the comparison between different zones.
The Day Nui Con Voi area has revealed 3
curves such as "straight- shape", "S- shape",
and concave curves. The concave curve is the
most common widely distributed in the
northeast side and the southern part of the
southwestern side of the DNCV area. The
hypsometric integral (HI) values are rather
213
Vietnam Journal of Earth Sciences Vol 38 (2) 202-216
small, the largest value is 0.37 whereas the
smallest one is 0.128. Other statistical moments of the hypsometric curve i.e. skew
(SK), kurtosis (KUR), and the density
function (density skew - DSK and density
kurtosis-DKUR) have great values and increase in the south direction of the area study.
The recent active tectonic activities (upliftlower) of the study area are generally weak.
However, they are also not completely
homogeneous and can be distinguished by
different levels. The southwestern side is
being lifted higher than the north-eastern side.
The northern part is being lifted larger than
the southern part. In the region, the uplift
activities were increased gradually in the
Pliocene-Quaternary and could have stopped
at certain time in the past. The current
geomorphic processes are mainly headward
erosion in the upstream.
Delcaillau, B., Laville, E., Amhrar, M., Namous, M., Dugué,
O., Pedoja, K., 2010. Quaternary evolution of the
Marrakech High Atlas and morphotectonic evidence of
activity
along
the
Tizi
N’Test
Fault,
Morocco.
Geomorphology 118, 262-279.
El Hamdouni, R., Irigaray, C., Fernández, T., Chacón, J.,
Keller, E.A., 2008. Assessment of relative active tectonics,
southwest border of the Sierra Nevada (southern Spain).
Geomorphology 96, 150-173.
Font, M., Amorese, D., Lagarde, J.L., 2010. DEM and GIS
analysis of the stream gradient index to evaluate effects of
tectonics: the Normandy intraplate area (NW France).
Geomorphology 119, 172-180.
Gardner, T.W., Sasowsky, K.C., Day, R.L., 1990. Automated
extraction of geomorphometric properties from digital
elevation
models.
Zeischrift
für
Geomorphologie
Supplemental Band 80, 57-68.
Harlin, J.M., 1978. Statistical moments of the hypsometric
curve and its density function. Mathematical Geology 10,
59-72.
Acknowledgments
The study is a part of the research project
VAST 05.02/14-15 funded by the Vietnam
Academy of Science and Technology
(VAST). Authors would like to thank.
References
Howard, A.D., 1990. Role of hypsometry and planform in basin
hydrologic response. Hydrological Processes 4, 373-385.
Huang, X.J., Niemann, J.D., 2006. Modelling the potential
impacts of groundwater hydrology on long-term drainage
basin evolution. Earth Surface Processes and Landforms
31, 1802-1823.
Joshi,
P.N,.
Maurya,
D.M.,
Chamyal,
L.S.,
2013.
Allen, C.R., Gillepie, A.R., Han, Y., Sieh, K.E., Zhu, C., 1984.
Morphotectonic segmentation and spatial variability of
Red River and associated faults, Yunnan province, China:
neotectonic activity along the Narmada-Son Fault, Western
Quaternary geology, slip rates, and seismic hazard,
India: Remote sensing and GIS analysis. Geomorphology
Geological Society of America Bulletin, 686-700, 21 fig.
180-181 (2013) 292-306.
Azor, A., Keller, E.A., Yeats, R.S., 2002. Geomorphic
Keller, E.A., Pinter, N., 2002. Active Tectonics. Earthquakes,
indicators of active fold growth: South Mountain-Oak
Uplift and Landscape. Prentice Hall, New Jersey, 362.
Ridge anticline, Ventura basin, southern California.
Le Duc An, 2003. About the exhumation of metamorphic rocks
Geological Society of America Bulletin 114, 745-753.
Chen, Y.C., Sung, Q., Cheng, K.Y., 2003. Along-strike
variations of morphotectonic features in the Western
Foothills of Taiwan: tectonic implications based on stream
gradient and hypsometric analysis. Geomorphology 56,
109-137.
Delcaillau, B., Deffontaines, B., Floissac, L., Angelier, J.,
Deramond, J., Souquet, P., Chu, H.T., Lee, J.F., 1998.
Morphotectonic evidence from lateral propagation of an
active frontal fold; Pakuashan anticline, foothills of
Taiwan. Geomorphology 24, 263-290.
214
of Con Voi range. Journal of Sciences of the Earth,No.1,
93-95 (In Vietnamese with English abstract).
Le Duc An, Dao Dinh Bac, Uong Dinh Khanh, Vo Thinh, Tran
Hang Nga, Ngo Tuan Anh, Nguyen Thi Le Ha, 2004.
Geomorphology of Red River Fault Zone and natural
hazard.P 459-532. Science and Technics Publishing House,
Hanoi (In Vietnamese with English abstract).
Le Duc An, Lai, Huy Anh, Vo Thinh, Ngo Tuan Anh, Do Minh
Tuan, Tran Hang Nga, 2001. Steps of relief of Convoi
Mountain characteristics. Journal of Sciences of the Earth,
23(2), 97-104. (In Vietnamese with English abstract).
N.V. Liem, et al./Vietnam Journal of Earth Sciences 38 (2016)
Leloup, P.H., Arnaud, N., Lacassin, R., Kienast, J.R., Harrison,
River Fault zone in Lao Cai-Yen Bai area, Journal of
T.M., Trinh, P.T., Replumaz, A., Tapponnier, P., 2001.
Sciences of the Earth, Vol. 28, (2), 110-120 (In Vietnamese
New constraints on the structure, thermochronology, and
with English abstract).
timing of the Ailao Shan-Red River shear zone, SE Asia,
Ngo Van Liem, Phan Trong Trinh, Nguyen Van Huong,
Journal of Geophysical Research, B, v. 106, 6683-6732.
Nguyen Cong Quan, Tran Van Phong, Nguyen Phuc Dat,
Leloup, P.H., Chen Wenji, Harrison, T.M., Tapponnier, P.,
2016. Analyze the correlation between the geomorphic
1994. Timing of shear sense inversion along the Red River
indices and recent tectonic active of the Lo River fault zone
fault zone. Int. Workshop on Seismotectonics and Seismic
in southwest of Tam Dao range. Vietnam Journal of Earth
Hazard in South East Asia, Hanoi.
Sciences. Vol. 38, No. 1, 1-13 (In Vietnamese with English
Leloup, P.H., Lacasin, Tapponnier, P., Scharer, U., Dalai, Z.,
Xaohan, L., Zhangshan, Shaocheng, J., Trinh, P.T., 1995.
The Ailao Shan -
Red Rive shear zone (Yunnan,
China), Tertiary transform boundary of
abstract).
Nguyen Quoc Cuong., Zuchiewicz, W., Tokarski. A. K., 1999.
Morphotectonic evidence for right-lateral normal slip in the
Indochina.
Red River Fault Zone: insights from the study on Tam Dao
Leloup, P.H., Lacassin, R., Tapponnier, P., Harrison, T.M.,
Nguyen Xuan Nam, 2015. Quaternary Geology characteristics,
2001. Comment on “Onset timing of left-lateral movement
present-day tectonic geomorphology of the Da river valley
along the Ailao Shan±Red River Shear Zone: 40Ar/39Ar
from HoaBinh to Viet Tri and correlation with geological
dating constraint from the Nam Dinh Area, northeastern
hazards. Doctorate Thesis. Hanoi University of Mining and
Vietnam” by Wang et al., 2000. Journal of Asian Earth
Geology (In Vietnamese with English abstract).
Tectonophysics, v. 251, pp. 3-84.
Sciences 18, 281-292. Journal of Asian Earth Sciences 20,
95-99.
Lifton, N. A., Chase, C.G., 1992. Tectonic, climatic and
fault scarp (Viet Nam), J. Geology, Seri B, 13-14, 57-59.
Ohmori, H., 1993. Changes in the hypsometric curve through
mountain building resulting from concurrent tectonics and
denudation. Geomorphology 8, 263-277.
lithologic influences on landscape fractal dimension and
Pedrera, A., Pérez-Peña, J.V., Galindo-Zaldívar, J., Azón,
hypsometry: implications for landscape evolution in the
J.M., Azor, A., 2009. Testing the sensitivity of geomorphic
San Gabriel Mountains, California. Geomorphology 5,
indices in areas of low-rate active folding (eastern Betic
77-114.
Luo, W., 1998. Hypsometric analysis with a geographic
Cordillera, Spain). Geomorphology 105, 218-231.
Pérez-Pa, J.V., Azón, J.M., Azor, A., 2009. CalHypso: An
information system. Computers & Geosciences, Vol. 245,
ArcGIS extension to calculate hypsometric curves and their
No. 8, 815-821.
statistical moments. Applications to drainage basin analysis
Luo, W., 2000. Quantifying groundwater- sapping landforms
with a hypsometric technique. Journal of Geophysical
Research, Vol. 105, No. El, Pages 1685-1694, January 25.
in SE Spain. Computers & Geosciences 35, 1214-1223.
Phan Trong Trinh, Hoang Quang Vinh, Leloup Philippe
Hervé, Giuliani, G., Vincent Garnier., Tapponnier, P.,
Mahmood, S. A., and Gloaguen, R., 2012. Appraisal of active
2004. Cenozoic deformation, thermodynamic evolution,
tectonics in Hindu Kush: Insights from DEM derived
slip mechanism of Red River shear zone and ruby
geomorphic indices and drainage analysis. Geoscience
formation. Science and Technics Publishing House, Hanoi.
Frontiers 3(4), 407-428.
P5-72 (In Vietnamese with English abstract).
Moglen, G.E., Bras, R.L., 1995. The effect of spatial
Phan Trong Trinh, Ngo Van Liem, Nguyen Van Huong, Hoang
heterogeneities on geomorphic expression in a model of
Quang Vinh, Bui Van Thom, Bui Thi Thao, Mai Thanh
basin evolution. Water Resources Research 31, 2613-2623.
Tan, Nguyen Hoang, 2012. Late Quaternary tectonics and
Ngo Van Liem, 2011. Characteristics of landform evolution in
seismotectonics along the Red River fault zone, North
relation to recent geodynamics along the Red River Fault
Zone, Doctorate thesis, Institute of Geological Sciences,
Hanoi (In Vietnamese with English abstract).
Vietnam. Earth-Science Reviews 114, 224-235.
Phan Van Quynh, Vo Nang Lac, and Tran Ngoc Nam, 1995.
Some features of late Paleozoic-Cenozoic deformation
Ngo Van Liem, Phan Trong Trinh, Hoang Quang Vinh, 2006.
tectonics on the territory of Vietnam and neighboring areas.
The active faults and the maximum earthquakes of the Red
In: Geology, Mineral Resources and Petroleum of Vietnam.
215
Vietnam Journal of Earth Sciences Vol 38 (2) 202-216
Geological Survey of Vietnam, Hanoi, 171-183 (in
Vietnamese with an English abstract).
Tran Ngoc Nam, 2002. Exhumation mechanisms of the Day
Nui Con Voi. Journal of Sciences of the Earth, No.3, 286-
Phung Thi Thu Hang, 2011. Study and comparison recent
288 (In Vietnamese with English abstract).
active tectonics between the Red River and the Dien Bien -
Tran Ngoc Nam, Mitsuhiro Toriumi, TetsumaruItaya, 1998.
Lai Chau Fault Zones base on geomorphic indices. Master
P-T-t paths and post-metamorphic exhumation of the Day
thesis. VNU University of Science, Hanoi.
Nui Con Voi shear zone in Vietnam. Tectonophysics 290,
Shahzad, F., and Gloaguen, R., 2011. TecDEM: AMATLAB
299-318.
based tool box for tectonic geomorphology, Part 1:
Tran Ngoc Nam., Toriumi, M., Sano, Y., Terada, K., Ta, T.T.,,
Drainage network preprocessing and stream profile
2003. 2.9, 2.36, and 1.96 Ga zircons in orthogneiss south of
analysis. Computers & Geosciences 37, 250-260.
the Red River shear zone in Viet Nam: evidence from
Strahler, A.N., 1952. Hypsometric (area-altitude) analysis of
erosional topography. Geological Society of America
SHRIMP U-Pb dating and tectonothermal implications.
Journal of Asian Earth Sciences 21, 743-753.
Becker, Marina Neuman, 2003. Activity of Red River fault
Trinh Thi Thuy, 2014. Assessment of modern tectonic activity
of the Son La fault zones on the basis of tectonic
geomorphology. Master thesis. The University of Science Vietnam National University, Hanoi (In Vietnamese with
English abstract).
Wang, P.L., Lo, C.H., Chung, S.L., Lee T.Y., Lan, C.Y.,
Thang, T.V., 2000. Onset timing of left-lateral movement
along the Ailao Shan±Red River Shear Zone: 40Ar/39Ar
dating constraint from the Nam Dinh Area, northeastern
Vietnam. Journal of Asian Earth Sciences. Volume 18,
Issue 3, 1 June 2000, 281-292.
zone at Tam Dao-Ba Vi derived from GPS data (1994-
Willgoose, G., 1994. A physical explanation for an observed
1996-1998-2000). Journal of Sciences of the Earth,
area-slope-elevation relationship for catchments with
25(4)PC, 511-515 (In Vietnamese with English abstract).
declining relief. Water Resources Research 30, 151-159.
Bulletin 63, 1117-1142.
Strahler, A.N., 1957. Quantitative analysis of watershed
geomorphology.
Transactions
of
the
American
Geophysical Union 38, 913-920.
Tran Dinh To, 2002. The characterize of Neotectonics of Red
River-Chay River Fault Zone. Doctorate Thesis, Institute of
Geological Sciences, Hanoi, (In Vietnamese with English
abstract).
Tran Dinh To, Duong Chi Cong, Vy Quoc Hai, Matthias
Tran Dinh To, Nguyen Trong Yem, 2001.Amplitude and rate of
Willgoose, G., Hancock, G., 1998. Revisiting the hypsometric
slip of the Red River Zone in late Cenozoic. Journal of
curve as an indicator of form and process in transport-
Sciences of the Earth, 23(4), 334-353. (In Vietnamese with
limited catchment. Earth Surface Processes and Landforms
English abstract).
23, 611-623.
Tran Ngoc Nam, 1999. Red River Fault zone - focus of the
Zuchiewicz, W., Nguyen Quoc Cuong, Jerzy Zasadni, Nguyen
scientific debate. Part II: P-T-t paths and post-metamorphic
Trong Yem, 2013. Late Cenozoic tectonics of the Red
exhumation, Journal of Sciences of the Earth, No.3,
River Fault Zone, Vietnam, in the light of geomorphic
161-167 (In Vietnamese with English abstract).
studies. Journal of Geodynamics 69, 11-30.
216