ENVIRONMENTAL POLLUTION AND PRODUCT CHARGES IN ARMENIA: Assessment of Reform Progress and Directions for Further Improvement pptx
Bạn đang xem bản rút gọn của tài liệu. Xem và tải ngay bản đầy đủ của tài liệu tại đây (256.81 KB, 46 trang )
ENVIRONMENTAL POLLUTION AND PRODUCT
CHARGES IN ARMENIA
:
Assessment of Reform Progress and Directions for
Further Improvement
OECD
ORGANISATION FOR ECONOMIC CO-OPERATION AND DEVELOPMENT
2
ORGANISATION FOR ECONOMIC CO-OPERATION AND DEVELOPMENT
The OECD is a unique forum where the governments of 30 democracies work together to address the economic, social
and environmental challenges of globalisation. The OECD is also at the forefront of efforts to understand and to help
governments respond to new developments and concerns, such as corporate governance, the information economy, and the
challenges of an ageing population. The Organisation provides a setting where governments can compare policy experiences,
seek answers to common problems, identify good practice, and work to co-ordinate domestic and international policies.
The OECD Member countries are: Australia, Austria, Belgium, Canada, the Czech Republic, Denmark, Finland, France,
Germany, Greece, Hungary, Iceland, Ireland, Italy, Japan, Korea, Luxembourg, Mexico, the Netherlands, New
Zealand, Norway, Poland, Portugal, the Slovak Republic, Spain, Sweden, Switzerland, Turkey, the United
Kingdom, and the United States. The Commission of the European Communities takes part in the work of
the OECD.
OECD Publishing disseminates widely the results of the statistics gathered by the Organisation and its research on
economic, social, and environmental issues, as well as the conventions, guidelines, and standards agreed by its
Members.
This work is published on the responsibility of the Secretary-General of the OECD. The opinions expressed and
arguments employed herein do not necessarily reflect the official views of the Organisation or of the governments of its
Member countries.
© OECD (2004)
No reproduction, copy, transmission or translation of this publication may be made without written permission. Applications should be sent
to OECD Publishing: or by fax (+33-1) 45 24 13 91. Permission to photocopy a portion of this work should be addressed to
the Centre Français d’exploitation du droit de Copie, 20 rue des Grands-Augustins, 75006 Paris, France
().
3
ACKNOWLEDGEMENTS
This report was prepared by Ms. Simone Schucht, environmental economics consultant, and Mr.
Eugene Mazur of the OECD Environment Directorate within the framework of the EAP Task Force
Secretariat’s environmental policy programme, with financial support from the Government of the
Netherlands.
The authors are especially grateful to Mr. Harutyunyan of the Ministry of Nature Protection of the
Republic of Armenia for organising the fact finding mission in Armenia in April 2004 and the stakeholder
workshop on 28 September 2004, for facilitating cooperation with various Armenian government agencies,
and for providing the authors with valuable information and comments. Further thanks go to Ms.
Aleksandryan, Mr. Narimanyan, Mr. Gabrielyan, Mr. Khamalyan, Mr. Mkrtumyan, Mr. Poghosyan, Mr.
Galstyan, Mr. Karayan, and Mr. Manukyan (see the list of interview partners) for having taken the time to
discuss the Armenian system of environmental charges with the project team.
4
TABLE OF CONTENTS
ACRONYMS 6
1. GENERAL INTRODUCTION 7
2. BACKGROUND 8
3. THE CURRENT SYSTEM OF POLLUTION AND PRODUCT CHARGES 9
3.1 Legal Background 9
3.2 Institutional Framework 10
3.3 Pollution Charges 11
3.3.1 Air Pollution Charges 11
3.3.2 Water Pollution Charges 13
3.3.3 Waste Charges 14
3.4 Environmentally Harmful Product Charges 15
3.5 Generation, Collection and Use of Pollution and Product Charge Revenues 16
3.5.1 Generation and Collection of Revenues 16
3.5.2. Revenues from Air Pollution Charges 19
3.5.3. Revenues from Water Pollution Charges 20
3.5.4. Revenues from Waste Charges 22
3.5.5. Revenues from Product Charges 22
3.5.6. State Environmental Expenditure 23
3.5.7. Data on Selected Industrial Enterprises 25
4. EVALUATION OF THE POST-1998 SYSTEM OF ECONOMIC INSTRUMENTS 27
4.1. Environmental Effectiveness 27
4.1.1. Insufficiently High Charge Rates and Counterproductive Charge Base 27
4.1.2. Ineffective Assessment of Charge Payments 30
4.1.3. Limited Enforcement of Charge Payments 30
4.2. Capacity to Raise Revenue for Environmental Measures 30
4.2.1. Poor Revenue Raising Capacity of the Environmental Charges 30
4.2.2. Weak Link between Charge Revenues and Financing Environmental Measures31
4.3. Cost Aspects 32
4.3.1. Affordability of Charge Payments to Industry 32
4.3.2. Administrative Costs 32
4.4. Legal and Institutional Issues 33
4.4.1. Legal Concerns 33
4.4.2. Institutional Problems 34
5. ARMENIA’S PROGRESS IN IMPLEMENTING INTERNATIONAL
RECOMMENDATIONS AND OPTIONS FOR FURTHER REFORM 36
5.1. Summary of International Recommendations and Their Implementation in Armenia .36
5.1.1. Reduction of the Number of Chargeable Pollutants 36
5.1.2. Coverage of Mobile Sources 38
5.1.3. Increasing Pollution Charge Rates 38
5.1.4. Increasing Collection Rates 38
5
5.2.
Opportunities and Constraints for Further Improvement 39
6. LESSONS LEARNED FROM THE REFORM PROCESS IN ARMENIA 41
REFERENCES 42
INTERVIEW PARTNERS 44
ANNEX 1. CONTRIBUTION OF SELECTED LARGE ARMENIAN ENTERPRISES TO
OVERALL EMISSIONS AND DUE REVENUES IN 2002 45
6
ACRONYMS
AMD Armenian dram (throughout this text the average exchange rate over the year 2002 of 575.03
AMD = 1 USD is used)
EAP TF Environmental Action Programme Task Force
EECCA Eastern Europe, Caucasus and Central Asia
ELV Emission (Effluent) Limit Value
EU European Union
MFE Armenian Ministry of Finance and Economy
MNP Armenian Ministry of Nature Protection
OECD Organisation for Economic Cooperation and Development
RA Republic of Armenia
SINP State Inspectorate for Nature Protection
STS State Tax Service
USAID United States Agency for International Development
USD US Dollar
7
1. GENERAL INTRODUCTION
Economic instruments have been playing an increasingly important role in the environmental policies
of OECD countries over the last decade. OECD countries generally use environmental taxes for a limited
number of pollutants, while focusing more on taxes for environmentally harmful products. In the countries
of Eastern Europe, Caucasus and Central Asia (EECCA)
1
, the economic instruments for natural resource
use were introduced in the 1980s, and a system for pollution charges on an experimental basis in selected
regions in 1990. After the break-up of the Soviet Union in 1991, economic instruments for environmental
protection and natural resource management were introduced in all EECCA countries. A prevalent feature
of the use of economic instruments in these countries is that they are closely integrated with systems of
pollutant emission or natural resource use limits, where enterprise-specific emission limits are laid down in
environmental permits. Generally, the standard pollution charge applies for emissions within the defined
limits while emissions above the limits are charged at higher non-compliance rates. In contrast to OECD
countries, EECCA countries have traditionally levied environmental charges on a large number of
pollutants, but hardly any on environmentally harmful products. The effectiveness of the pollution charges
in the EECCA has been predominantly low due to the lack of focus on principal pollutants, low charge
rates, insufficient monitoring of pollutant discharges, and lenient enforcement.
Armenia was the first country in the EECCA region to introduce charges on environmentally harmful
products and to simplify the pollution charge system in a reform of 1998. The objective of this report is to
analyse the experience of the reform of the system of economic instruments for environmental protection in
Armenia and to make recommendations for further improvement. It focuses on pollution and product
charges
2
. It does not cover user charges for water, wastewater, and waste management services or natural
resource use charges. Unless otherwise specified in the report, the information provided was collected
during a fact-finding mission in Armenia and is based on interviews with Armenia’s environmental,
economic and financial government agencies, and on official documents and data provided by these
stakeholders. The mission took place in April 2004 and was funded by the EAP Task Force Secretariat,
which is hosted at the OECD Environment Directorate.
The structure of the report is the following: After a brief discussion in Section 2
of the background of,
and rationale for, the reform in Armenia, Section 3
describes the current system of pollution and product
charges. It covers the legal background of the current system of economic instruments of environmental
policy, outlines institutional responsibilities, gives details of the application of the pollution and product
charges and discusses revenue collection issues. Section 4
contains an evaluation of improvements in the
system compared to the pre-1999 period as well as of its effectiveness and efficiency in attaining its explicit
and implicit objectives. Several legal and institutional shortcomings are also discussed. Section 5
assesses
the reform of the Armenian system of environmental economic instruments against international
recommendations and discusses opportunities and constraints for further improvement. Section 6
concludes
with a discussion of lessons learned from the Armenian experience and their relevance for other EECCA
countries.
1
The EECCA region covers Armenia, Azerbaijan, Belarus, Georgia, Kazakhstan, Kyrgyzstan, Moldova, Russian
Federation, Tajikistan, Turkmenistan, Ukraine, and Uzbekistan.
2
Note that in line with the Armenian denomination the term ‘charges’ is used with respect to payments levied on
pollutants and harmful products. These ‘charges’ are nevertheless unrequited payments and should hence
not be interpreted in the sense of the national accounts’ definition of charges (and fees) as payment in
exchange for services.
8
2. BACKGROUND
The introduction of economic instruments for environmental protection in the Republic of Armenia
(RA) dates back to 1986, when the country was still part of the Soviet Union. In that year, “The Provisional
Methods for Estimating the Damage Caused to the National Economy by Environmental Pollution” were
adopted, aimed at determining the damage to the national economy from violations of the environmental
legislation of the Soviet Union and the Union republics thereof (EAP TFS/DANCEE, 2000). With
Resolution No. 448 of the Government of the RA of 8 September 1993, a comprehensive set of rates for
payments for environmental pollution was introduced and the Polluter/User Pays Principle officially
enacted.
3
Since then, environmental charges have been in place for air pollution (including transport-related
pollution), water pollution, industrial waste generation, along with natural resource charges. In 1997, the
applicable payment rates were increased.
The effectiveness and revenue-raising capacity of the system of environmental charges in place prior
to 1999 was widely regarded as low (Harutyunyan, 1999). The changes that have been introduced since
1998 were designed to address this problem by simplifying the system (through limiting the number of
chargeable parameters to those that are monitored and generate significant revenues), raising the charge
rates, and introducing product charges.
The system was re-authorised by Law No. 270 of 30.12.1998 “On Environmental and Natural
Resource Payments”. The law declared the raising of revenues for environmental protection measures as
the main objective of environmental charges. This law introduced, among other things, charges on a set of
(initially) 20 product categories considered to be environmentally damaging (see Table 6), making Armenia
the first EECCA country to have introduced product charges on a large scale. Another major feature of this
reform was a reduction in the number of water pollutants that are subject to charges from 27 to 19. Various
charge rates were also increased. This reform was also important from a legal point of view: before 1998,
environmental charges were only based on a government regulation which lacked sufficient legal status.
With the revision in 1998, environmental charges for the first time were regulated by a law. In April 2000,
the list of air pollutants from stationary sources that are subject to pollution charges was reduced from 51
(in 1998) to 10, and charge rates for selected pollutants were increased further. The 2000 rates are still in
effect at the time of the writing of this report.
3
The Polluter Pays Principle states that those who cause pollution should offset its effects by compensating for the
damage incurred, or by taking precautionary measures to avoid creating pollution. It is generally interpreted
in the way that the polluter should bear the costs of pollution prevention and control measures. Contrary to a
widespread perception in EECCA countries, not only economic instruments (such as taxes, charges or
tradable permits) but all environmental policy instruments that make polluters reduce their negative
environmental impacts and pay for these reductions are in line with the Polluter Pays Principle.
9
3. THE CURRENT SYSTEM OF POLLUTION AND PRODUCT CHARGES
3.1 Legal Background
The current system of environmental pollution and product charges in Armenia is based on the Law of
the Republic of Armenia “On Environmental and Natural Resource Payments” (Law No. 270) which
entered into force on 1 January 1999. The Law was complemented by two government decrees on rates of
the environmental charges, also effective as of 01.01.1999.
Article 4 of Law No. 270 stipulates that environmental payments include:
a) payments for discharges of pollutants into the environment (air and water);
b) payments for placement of production and consumption waste in the environment; and
c) payments for environmentally harmful products.
Air pollution charges are imposed on both stationary and mobile sources. Charges on water pollution
are levied on direct discharges into water bodies and, since recently, on industrial discharges into the sewer.
The waste charges are imposed on on-site storage and landfill disposal of industrial waste.
According to the law “On Environmental and Natural Resource Payments,” all pollution charges
discussed in this report are obligatory payments to the state budget with a purpose of receiving revenues for
carrying out environmental measures (Article 2). Therefore, pollution and product charges are primarily
considered as revenue-raising instruments. However, apart from one exception
4
, there has so far been no
earmarking of environmental charge revenues for environmental projects, and, unlike in many other
EECCA countries, there is no system of environmental funds in Armenia. There is no reference to an
incentive objective of pollution and product charges in the law.
The rates for environmental charges are set by law. For pollution charges, exceedances of limit values
for air emissions and water discharges laid down in firm-specific permits are subject to a 3-fold increase of
payment rates.
The law also lays down the basic rules for penalties for violations. Late payments are subject to
penalties of 0.2% of the due amount per day. If the payment delay is more than 2 months, a fine is imposed
of 5% of the due payment amount for every following 15 days. Underreporting is penalized by a fine equal
to 50% of the underreported amount, repeated underreporting by a 100% fine.
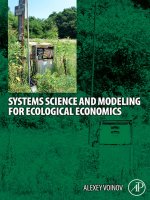
The law provides for no systematic correction of pollution charges for inflation, and the occasional
changes in the charge rates were not intended to make such corrections. Figure 1 shows that the inflation
rate in Armenia has decreased significantly over recent years. Unlike pollution charges, product charges are
fixed on an ad valorem basis as a percentage of the market prices (excluding taxes), thus assuring automatic
adjustment to inflation.
4
The Law ‘On targeted use of environmental payments by companies’ of 15 May 2001 stipulates that the revenues of
the environmental charges from 8 companies (2 cement and 6 metallurgical/mining companies) should be
redirected to the local communities in which these companies are located (see section 3.5).
10
Figure 1: Inflation Rate
5
, 1996-2002
14
8.7
18.7
1.1
3.1
-0.8
0.6
-5
0
5
10
15
20
1996 1997 1998 1999 2000 2001 2002
year
percentage change to previ ous year
Source:
EAP TSF/DANCEE, 2000; Statistical Yearbook of Armenia, 2003
.
3.2 Institutional Framework
Three government agencies are primarily involved in administering the system of economic
instruments for environmental protection in RA. The Ministry of Nature Protection (MNP) plays the
principal role: it designs economic instruments, introduces new types of these instruments and controls
(through regional and central state inspectorates) actual volumes of pollution and natural resources use. The
Ministry of Finance and Economy (MFE) proposes the charge rates (for promulgation in the law) and
allocates the charge revenues collected, for the most part, by the State Tax Service (STS).
Certain roles are also played by the Ministry of the Interior and the State Customs Committee. The
pollution charges levied on vehicles registered in Armenia are collected at the time of vehicle inspections
by the road police. Revenues from pollution charges on transit transport are collected by the Customs
Committee
6
. The Customs Committee also collects charges on imported environmentally harmful products,
while the STS collects charges imposed on such products when they are produced domestically.
Responsibilities for control and enforcement of pollution and product charge payments are split
between the MNP and the STS. As enterprises assess and report their environmental charge payments due,
the State Inspectorate for Nature Protection (SINP), which is part of the MNP, is in charge of controlling
the pollution volumes reported, and the STS controls the payments. Enterprises present quarterly reports on
the volumes of discharges and waste generation to the regional environmental inspectorate for approval (the
data are then compiled by the MNP and shared with the Council for Statistics), and then submit a copy of
the report to a local tax office within 5 days and pay the charges to a budget account. Where the
inspectorate detects firms’ underreporting, it establishes a protocol which has to be sent to the tax office,
which then has to collect the past charges due. Where enterprises are fined for environmental violations, the
imposed penalties should also be paid to the budget.
5
Percentage change in consumer prices; change to previous year.
6
An exception are agricultural vehicles for which the collection of charges is under the responsibility of the Ministry
of Agriculture.
11
When enterprises do not pay the due environmental charges, the STS may go to court after 180 days of
non-payment, although it is not obliged to do so. Where a case is taken to court, the latter may either allow
the enterprise more time to settle its debt or declare the firm bankrupt and seize its assets to satisfy the debt
(STS, 2004).
7
Interviews with the responsible state authorities in Armenia suggest that, in practice, cases
are not frequently taken to court (SINP, 2004).
3.3 Pollution Charges
Pollution charges in Armenia are levied on air pollution from stationary and mobile sources, water
pollution, and “placement” (i.e., storage and disposal) of waste.
3.3.1 Air Pollution Charges
Since 2000, ten air pollutants emitted by stationary sources have been subject to environmental
charges: particulate matter (inorganic dust), carbon monoxide, nitrogen oxides, sulphur dioxide, chlorine,
chloroprene, chromium oxide, formaldehyde, toluene and xylol. This list was considerably shortened
compared to the 51 air pollutants that were subject to charges in 1993-1999. According to the interviews
with MNP officials, the choice of substances to be kept as the charge base was guided by their revenue
generation and environmental impact. To some extent, the choice was also driven by the available
monitoring technology: toluene and xylol (both solvents) are examples of substances kept on the list
because they are actually monitored (MNP, 2004).
The current charge rates for air pollutants from stationary sources were set in April 2000, when a new
rate calculation method was used, based on the toxicity of air emissions of individual pollutants. Under this
approach, the rate for one ‘reference pollutant’ is multiplied by a coefficient reversely proportionate to a
respective ambient air quality standard (maximal allowable ambient concentration), implying that the
stricter the ambient standard, the higher the resulting charge rate (MNP, 2004). As can be seen in Table 1,
not all charge rates were increased between 1998 and 2000. While, for example, the charge rate for
chromium oxide was increased by a factor of 316, the charge rate for chloroprene remained the same, and
those for particulate matter and SO
2
were even decreased by roughly two thirds. For emissions above the
specified ELVs, the 3-fold rate is applied.
7
It is worth mentioning that the STS has weaker power to enforce environmental charges than regular taxes, which
fall under the Tax Code. For regular taxes, the STS can attach a firm’s account once its tax debt exceeds 1
million AMD. Any incoming funds on the account are then directly transferred to the budget until the debt
is satisfied.
12
Table 1. Charge rates for air emissions from stationary sources
Rate per tonne, AMD Rates ratio Rate per tonne,
USD
Pollutant
1998 2000 2000/1998 2000
Particulate matter 1800 600 0.33 1.04
CO 30 80 2.67 0.14
NOx 2250 7400 3.29 12.87
SO2 1800 600 0.33 1.04
Toluene (C6H5CH3) 150 500 3.33 0.87
Chlorine (Cl2) 3000 6000 2.00 10.43
Chloroprene (C4H5Cl) 45000 45000 1.00 78.26
Chromium oxide (CrO3) 60000 18957000 315.90 32 966.98
Xylol (C6H4(CH3)2) 450 1500 3.33 2.61
Formaldehyde (HCNO) 30000 23400 0.78 40.69
Source: Harutyunyan, 1999; data provided by the MNP; 1 USD = 575.03 AMD
The charges on mobile sources take two different forms:
• Charges per type of motor vehicle for vehicles registered in Armenia are payable once a year, by
juridical and physical persons owning the vehicle. The payment is a precondition for receiving
the vehicle’s technical inspection certificate.
• Transit vehicle charges per category of motor vehicles and their load carrying capacity for
vehicles not registered in Armenia are payable by juridical and physical persons at each entry
into the country.
Table 2 presents the charge rates on Armenian-registered motor vehicles. The charges essentially
depend on the horsepower of the specific vehicle. According to EAP TFS/DANCEE (2000), in 1999, the
rates varied between 1350 AMD (2.4 USD) for small cars and 36000 AMD (62.6 USD) for large trucks.
Table 2. Charges per Type of Motor Vehicle (for vehicles registered in Armenia)
Horsepower (M) Vehicle charge in AMD
< 50 М 10 x М
50 М – 80 М 20 x М
81 М – 100 М 30 x М
101 М – 150 М 40 x М
150 М – 200 М 50 x M
201 М – 250 М 60 x М
251 М – 300 М 70 x М
> 300 M 100 x М
Source: data provided by the MNP
13
Transit charges for vehicles not registered in Armenia are differentiated for passenger and freight
transport and according to broad categories of the vehicles’ cargo carrying capacity (see Table 3). As a
reason for charging transit transport, MNP representatives quoted the fact that many transit vehicles take
fuel in Iran where it is cheaper than in Armenia, while emitting pollution in Armenia (MNP, 2004).
Table 3. Transit Vehicle Charges (for vehicles not registered in Armenia)
Vehicle categories Charge rate in AMD
Passenger
Passenger cars 2500
Buses with less than 12 seats 5000
Buses with 12 seats and more 10000
Cargo
Cargo capacity less than 8 tonnes 5000
Cargo capacity from 8 to 20 tonnes
10000
Cargo capacity 20 tonnes and more 15000
Source: data provided by the MNP
In 1993-1999, Armenia had motor fuel charges (only paid by companies), differentiated between
leaded and unleaded petrol and diesel. These charges were replaced by the charge per type of motor vehicle
and product charge on petrol and diesel (the latter was abolished in 2000 in favour of an increased excise
tax on motor fuels). While there were plans to differentiate the excise tax on leaded and unleaded petrol in
order to introduce an incentive for substitution, this idea was dropped when the import of leaded petrol was
banned as of 1 January 2000.
3.3.2 Water Pollution Charges
Currently, charges are imposed on 19 water pollutants (before 1999, 27 water pollutants were
charged). The choice of these 19 parameters is explained by the available laboratory capacity: in Armenia,
analysis and monitoring is currently possible only for these parameters. According to the interview with
the Water Resource Management Agency, these parameters are typical for Armenia and are believed to
cover 80% to 90% of all water pollutants in the country (MNP, 2004).
According to the interviews with various departments of the MNP, the revision of charge rates at the
end of 1998 and the following years lacked a clear rationale (MNP, 2004). In 1999, for example, the BOD
rate was increased 6-fold, and the rate for suspended solids increased from 680 to 5310 AMD. In 2000, the
charge rates were significantly reduced for some substances (e.g., phosphorus) and considerably increased
for others (e.g., heavy metals and cyanides). For the majority of pollutants, however, the rates have
remained the same since 1999.
14
Table 4 Pollution Charge Rates (per tonne)
Substance 1999 in
AMD
04/2000 in
AMD
2000 in
USD
2000/1999 in
%
suspended solids 5 310 5 300 9.22 100
ammonium nitrate 5 120 5 100 8.87 100
acetone 301 000 301 000 523.45 100
biochemical oxygen demand 18 416 18 400 32.00 100
oil products 204 600 204 600 355.81 100
copper 1 023 900 1 023 900 1 780.60 100
sulphates 100 100 0.17 100
zinc 1 023 300 1 023 000 1 779.04 100
chlorides 30 30 0.05 100
chromium 20 460 153 400 266.77 750
total phosphorus 10 023 000 40 000 69.56 0.4
fluorine 13 640 511 500 889.52 3 750
pesticides, herbicides, insecticides 18 150 18 200 31.65 100
acetic acid 16 918 16 900 29.39 100
sulphuric acid 16 918 16 900 29.39 100
detergents 102 300 102 300 177.90 100
salts of heavy metals 174 511 500 889.52 293 966
cyanides 174 511 500 889.52 293 966
phenols 10 023 000 1 023 900 1 780.60 10
Source: Harutyunyan, 1999; data provided by the MNP; 1 USD = 575.03 AMD
Theoretically, all users have to pay the pollution charges levied on water effluents, including the water
and wastewater utilities (Vodokanals). However, this would imply a double payment for the same
discharges by industry into the sewerage system and by the Vodokanals into water bodies. This double
payment has so far remained theoretical because the Vodokanals have been exempt from pollution charges
(see Section 3.5.1).
3.3.3 Waste Charges
Waste charges are imposed on juridical and physical persons for the ‘placement’ of industrial and
municipal waste in the environment. The translation of the Russian term ‘placement’ covers both the
storage of waste and its disposal in landfills. There actually does not exist any other form of waste
management in Armenia, there is no recycling or waste separation. The 459 existing open landfills are not
differentiated into landfill classes, nor do they conform to any environmental and hygiene standards (there
is, for example, no protection against leaching). They are essentially waste dumps in which waste is
frequently burned in open air, but at low temperatures, which results in significant air pollution (MNP,
2004).
15
Five classes of waste are distinguished, four of which refer to hazardous waste (class 1 being the most
hazardous and class 4 the least hazardous waste) and one to non-hazardous waste
8
. Waste charges are
differentiated by class of hazardousness. While industrial enterprises have to pay for the waste they
generate, which they either store on-site or dispose of in landfills, households do not pay pollution charges
for their municipal waste which goes to landfills (they pay user fees for waste collection).
Mining/metallurgical companies are exempt from paying charges on non-hazardous industrial waste
9
. On
the other hand, the government has imposed waste charges on landfills under the pretext that they dispose
of waste (MNP, 2004).
The current charge rates were set in April 2000 (see Table 5). They were doubled compared to the
1999 levels to adjust for inflation.
Table 5. Charge Rates for Disposal of Industrial and Municipal Waste
Waste categories 1998 rates in
AMD
04/2000 rates
in AMD
2000 rates in
USD
Class I: extremely hazardous 18 000 36 000 62.61
Class II: highly hazardous 9 000 18 000 31.30
Class III: moderately hazardous 1 800 3 600 6.26
Class IV: least hazardous 600 1 200 2.09
Non-hazardous (non-toxic industrial waste and
municipal solid waste)
300 600 1.04
Source: UNECE, 2000; data provided by the MNP; 1 USD = 575.03 AMD
Normative documents related to waste policy have so far taken the form of government decisions.
There are no waste-related permits and no limits for waste generation, so the charges are currently based
exclusively on good-faith reporting by industry. A law on waste is expected to be adopted by the
Parliament before the end of 2004. The introduction of waste permits for enterprises is planned for 2005
(MNP, 2004).
3.4 Environmentally Harmful Product Charges
The law of 1998 introduced, from 1 January 1999, charges on environmentally harmful domestic and
imported products (transit goods are exempt from them). The product charges, designed as revenue raising
and not as incentive instruments, currently cover 22 product categories (see Table 6), but the exact list of
product categories subject to charges and their rates have varied since 1999.
8
Note that in some statistics municipal solid waste is recorded under a sixth category, but in any case the charge rate
is the same as for the 5
th
waste class.
9
This exemption was first inscribed in the Government Resolution NOO-3 of 31 December 1998 (which had the
status of a law), and then in the law “On Rates of Environmental Charges” of April 2000.
16
Table 6. Environmental Product Charges (% of value)
Product 01.01.1999-
01.06.1999
From
15.06.1999
From
01.08.1999
As of
04/2000
Asbestos-containing materials, vehicle breaks 1.0 3.0 3.0 3.0
Lead containing materials, paint 1.0 3.0 3.0 3.0
Luminescent bulbs, mercury amalgams 1.0 3.0 3.0 3.0
Typographic production substances; zinc bleaches
1.0 3.0 3.0 3.0
Gasoline 0.75 2.0 44.0 -
Diesel 0.75 2.0 25.0 -
Asphalt 0.75 2.0 2.0 2.0
Hydrocarbon lubricants 0.75 2.0 2.0 2.0
Mineral oils 0.75 2.0 2.0 2.0
Welding electrodes 0.5 1.5 1.5 1.5
Naphthalene (solid) 0.5 1.5 1.5 1.5
Lead and lithium car batteries 0.5 1.5 1.5 1.5
Transformer oil, electrolytic condensers 0.5 1.5 1.5 1.5
Tyres 0.25 0.8 0.8 0.8
Cine and photo films 0.25 0.8 0.8 0.8
Glass fibre 0.25 0.8 0.8 0.8
Unclean empty vessels (oil tank trucks, fuel cans) 0.25 0.8 0.8 0.8
Detergents 0.15 0.5 0.5 0.5
Freon-containing equipment and products 0.15 0.5 0.5 0.5
Plastic and polyethylene packaging and bags 0.15 0.5 0.5 0.5
Oil & oil products, except gasoline - - - 2.0
Anti-freezers - - - 2.0
Break fluids - - - 2.0
Hydraulic fluids - - - 2.0
Source: Harutyunyan, 1999; data provided by the MNP
As Table 6 shows, petrol and diesel, formerly subject to high product charge rates, were removed
from the list in 2000. The excise taxes on motor fuels were simultaneously increased to provide the same
revenue level. In fact, the MFE has always regarded the product charges on petrol and diesel as purely
fiscal instruments.
3.5 Generation, Collection and Use of Pollution and Product Charge Revenues
3.5.1 Generation and Collection of Revenues
Table 7 gives a comprehensive view on the actual revenue of all environment-related charges and
their evolution between 1998 and 2003. Revenues from natural resource use charges, which are not further
discussed in this report, are presented alongside pollution and product charges. While Table 7 focuses on
actual revenues, Table 8, for charges on waste and water pollution and on air pollution from stationary
sources, compares the actual with the due amounts, showing collection rates for 1999-2003.
17
Table 7 shows that before the reform of the environmental charge system in Armenia in the late 1998,
the natural resource charges yielded higher revenues than the pollution charges. Now, the pollution and
product charges are clearly the dominant source of environment-related budget revenue. Most important in
terms of revenue generation are charges on mobile air emission sources and environmentally harmful
products. Overall, revenues from environmental charges have grown over the recent years. The improving
economic situation contributes to increasing revenues. The slump in revenues in 2001 compared to 2000 is
possibly due to the suppression of the diesel and petrol charges, for which not only collection rates were
high, but also the related revenues.
Table 8 draws the attention to significant differences between charge payments due and actually
collected in each given year, as well as to substantial fluctuations of charges due, revenues actually
collected, and collection rates over the period. While part of the fluctuations may be explained by a few
cases of environmental (and natural resource) charges being written off where state companies were
privatised and by further exemptions discussed below, others raise questions about the accuracy of the
data. It is worth noting that even payments due may be incorrect, as most environmental charge payments
are determined by enterprises’ self-assessment and reporting. Overall, the collection rates of pollution
charges remain low. This becomes obvious considering aggregated due and actual charge payments as
reported in Table 8 over the period 1999-2003 (see Table 9). Collection rates are low for charges on air
pollution from stationary sources, water pollution and waste ‘placement’. They are, however, higher for
product charges and, to some extent, also for pollution charges on mobile sources, as discussed later on in
this report.
One reason for the fluctuations in the collection rates and, particularly, for the fact that these rates
sometimes exceed 100% is that enterprises frequently have charge debts outstanding for a period of time.
In the statistics, charge payments are accounted for when the payment occurs, and not in the year they were
actually due (accounting of actual payments on a cash basis as opposed to an accrual basis). The due
payment in the reference year then grows also because of penalties, while the revenue actually collected
remains low. The writing off of charge liabilities can also affect the statistics. According to the State Tax
Service, over the last four years penalties were written off in two or three cases (STS, 2004). The tax office
can only do so in accordance with the law and does not have any discretion in that matter. Along with the
inability to pay, there are also cases of deliberate delinquency (firms refusing to pay).
The quality of statistics is further affected by problems of incorrect reporting. To give one example,
companies sometimes pay their air and water charges, or pollution and natural resource charges, not
separately but together and also declare them only under one of the two categories concerned. While this
does not pose a problem for the STS, which keeps a common account for all environmental charges, it
implies that the totals are more reliable than the disaggregated data. Finally, data are sometimes distorted
by the fact that regional SINP offices do not submit correct numbers for the estimated charges to the
central inspectorate or submit them too late (STS, 2004; SINP, 2004).
Information on the breakdown between environmental charges paid at the base rates and those paid at
3-fold non-compliance rates is rather sporadic. As a rough estimate, SINP stated that about 5-7% of the
total revenue consisted of exceedance payments. In individual cases, however, the share may be higher.
18
Table 7. Actual Revenues from Environmental and Natural Resource Charges and Their Share in the Environment-Related Budget Revenue
Type of Charge 1998 1999 2000 2001 2002 2003
Revenue
(million
AMD)
% in total
budget
revenue
Revenue
(million
AMD)
% in total
budget
revenue
Revenue
(million
AMD)
% in total
budget
revenue
Revenue
(million
AMD)
% in total
budget
revenue
Revenue
(million
AMD)
% in total
budget
revenue
Revenue
(million
AMD)
% in total
budget
revenue
I. Natural resource charges, total 302.0 49.7 527.2 7.9 596.1 14.5 823.3
36.1 1 046.0 26.8 1 177.9 21.0
1. Water use 5.2 0.9 129.4 1.9 93.6 2.3 413.2 18.1 50.2 1.3 60.3 1.1
2. Mining 296.8 48.8 355.8 5.3 389.9 9.5 322.2 14.1 907.9 23.2 1 005.8 17.9
3. Use of biological resources 0.0 0.0 42.0 0.6 112.6 2.7
87.9 3.9 87.9 2.2 111.8 2.0
II. Environmental charges, total 275.2 45.3 6 147.4 92.1 3 520.1 85.5 1 458.3
63.9 2 863.1 73.2 4 427.5 79.0
1. Air emission charges 273.5 45.0 734.2 11.0 817.6 19.9 853.9 37.4 2 257.7 57.8 2 614.8 46.6
1.1 Stationary sources 2.4 0.4 10.4 0.2 39.7 1.0 10.7 0.5 82.0 2.1 43.7 0.8
1.2 Mobile sources 271.1 44.6 723.8 10.8 777.9 18.9 843.2 37.0 2 175.7 55.7 2 571.1 45.9
2. Wastewater effluent charges 1.3 0.2 173.8 2.6 29.8 0.7 44.3 1.9 37.0 0.9 1 192.1 21.3
3. Waste "placement" charges 0.4 0.1 3.3 0.0 5.3 0.1 4.5 0.2 22.3 0.6 58.3 1.0
4. Environmentally harmful products 0.0 0.0 5 236.1 78.4 2 667.4 64.8 555.6
24.4 546.1 14.0 562.3 10.0
III. Other charges 30.8 5.1 0.0 0.0
0.0
0.0 0.0 0.0 0.0 0.0 0.0 0.0
TOTAL 608.0 100.0 6 674.6 100.0 4 116.2 100.0 2 281.6
100.0
3 909.1 100.0 5 605.4 100.0
Source: Data provided by the MNP
Table 8. Revenues of Pollution Charges Due and Actually Collected in Million AMD and Collection Rates
1999 2000 2001 2002 2003
Charge
Due Actual % actual
in due
Due Actual % actual
in due
Due Actual % actual
in due
Due Actual % actual
in due
Due Actual % actual
in due
Air 72.6 10.4 14.3 157.6 39.7 25.2 74.7 10.7 14.3 43.4 82.0 189.1 49.7 43.7 87.9
Water 266.5 173.8 65.2 65.2 29.8 45.7 84.7 44.3 52.3 596.9 37.0 6.2 648.4 1 192.1 183.9
Waste 10.3 3.3 32.0 52.1 5.3 10.2 48.7 4.5 9.2 10.0 22.3 223.8 9.8 58.3 594.9
Total 349.4 187.5 53.7 274.9 74.8 27.2 208.1 59.5 28.6 650.3 141.3 21.7 707.9 1 294.1 182.8
Note: Revenues from air pollution charges refer to stationary sources only – Source: data provided by the MN
19
Table 9. Revenues of Pollution Charges Due and Actually Collected in Million AMD and Collection Rates
(cumulative over 1999-2003)
Charges due Charges collected % actual in due
Air 398 187 46.9
Water 1 662 1 477 88.9
Waste 131 94 71.6
Total 2 191 1 757 80.2
Source: data provided by the MNP; own calculations
3.5.2. Revenues from Air Pollution Charges
The high importance for air pollution charges in overall revenues from environmental charges (see
Table 7) is mainly due to the charges on mobile sources, and, more specifically, to transit charges. While
no time series data are available on the collection rates of air charges on mobile sources, these can be
considered as comparatively high. Charges on transit transport are collected by the customs and, according
to the interviews with the MNP, collection rates are almost 100%. The vehicle charges collected by the
road police from Armenian vehicle owners are also high. The road police is said to collect a bit less than
100% of charges theoretically due because some vehicle owners simply do not have their inspections done,
by this also avoiding the environmental charge payment. All in all, transport charge revenues collected by
the customs are approximately four times higher than those collected by the road police, because the transit
charge rates are higher. However, the fact that air pollution charge revenues from mobile sources are much
higher than from stationary sources is not only due to differences in collection rates: traffic-related
emissions are much higher than those from stationary sources. In 2002, for example, traffic-related air
emissions made up 87% of all air emissions (MNP, 2004).
For stationary sources, the decrease in revenues in 2001 as compared to 2000 may be explained by the
suppression of air pollution charges for 39 substances in 2000 (although those substances did not provide
much revenue, and the revenue fell further in 2002). There are no significant exemptions to charges on air
pollution from stationary or mobile sources.
Two factors may impinge upon the correctness of the reported data. Firstly, it is the charge object
itself which determines its charge payment due, so there is scope for underreporting. Secondly, payments
due are frequently determined based on estimated emissions and the estimation methods are likely to be
flawed (e.g., many obsolete technology-based emission factors are used).
Data on emission volumes and calculated revenues per pollutant for stationary air emission sources in
2002 are presented in Table 10. The revenues were calculated by multiplying the emission volumes per
pollutant by the respective charge rate. The fact that the overall revenue is lower than the due charge
payments reported in Table 8 might be because of penalties and non-compliance payments not being
included in the calculation. When interpreting Table 10, not too much importance should be given to the
overall amount of revenues. These data, rather, give valuable information on the importance of specific
pollutants in Armenia and on the relative usefulness of the respective pollution charges to generate
revenue.
According to Table 10, three pollutants accounted for 93% of the 2002 revenue from charges on air
pollution from stationary sources: particulate matter, nitrogen oxides and sulphur dioxide. The only other
pollutant that is also emitted in large amounts is carbon monoxide (the significance of emissions should, of
course, be determined based on the pollutant’s toxicity and health impact). However, due to the lower
charge rate, it contributes only to about 3% to the revenue.
20
Table 10. Revenues from Charges on Air Pollution from Stationary Sources, 2002
Substance Rate,
thousand
AMD
Volume of
emissions,
tonnes
Calculated
revenue due,
thousand AMD
Share in the
total revenue,
%
Total revenue due for air
emissions from stationary sources
34 854.8 100.000
Particulate matter 0.6 13 499.95 8 100.0 23.239
Carbon monoxide (CO) 0.1 12 283.80 982.7 2.819
Nitrogen oxides (NOx) 7.4 2 703.78 20 008.0 57.404
Sulphur dioxide (SO2) 0.6 7 243.00 4 345.8 12.468
Chlorine (Cl2) 6.0 0.83 5.0 0.014
Chloroprene (C4H5Cl) 45.0 28.70 1 291.5 3.705
Chromium oxides 18 957.0 0.01 103.4 0.297
Formaldehyde (HCNO) 23.4 0.05 1.1 0.003
Toluene (C6H5CH3) 0.5 13.80 6.9 0.020
Xylol (C6H4(CH3)2) 1.5 7.00 10.5 0.030
Source: Data provided by the MNP
3.5.3. Revenues from Water Pollution Charges
Cumulated over the period from 1999 to 2003, collection rates for charges on water pollution have
been higher than for air pollution and waste charges (see Table 9). Nevertheless, they were subject to large
fluctuations as well, with a slump in 2002 and a disproportional collection rate in 2003. Overall, the
evolution of revenues over the period is difficult to explain. In particular, it is impossible to analyse the
impact of adjustments in charge rates over time.
Exemptions from payment obligations apply primarily to the Vodokanals. There are three water and
wastewater utilities in Armenia: Yerevan Vodokanal responsible for the Yerevan municipality,
ArmVodokanal responsible for areas outside Yerevan, and a small Vodokanal of the City of Armavir.
While the former two are 100% state-owned, the latter is 51% owned by the state and 49% by the
municipality. All three companies were exempt from pollution charges between 1999 and 2001 because
they were supposedly improving their wastewater management. They were forgiven a pollution charge
amount of approximately 1.1 billion AMD (corresponding to approximately 2.5 years worth of water
pollution charges) in December 2003 as part of a swap with subsidies they receive from the state to keep
the water fees for households low.
10
Furthermore, the Vodokanals have their debt for the payments of
water pollution charges due between 1 January 2003 and 31 December 2005 suspended until 1 January
2006. The suspended amount of charges should normally be paid in the period of 2006 to 2009. But the
Vodokanals are hoping to be granted an extension of the exemption in 2006 (State Committee for Water
Management, 2004). Provided the exemption is not extended, annual charge payments over these four
years will amount to approximately 600 million AMD (1/4 of the charge debt of previous years and the
current pollution charges of approximately 300 million AMD)
11
for the Yerevan Vodokanal. For the
ArmVodokanal, water pollution charges are approximately 50% lower.
10
This was made possible by a specific law on Vodokanals setting the conditions of their financial rehabilitation
programmes. This law also establishes the low rates Vodokanals are paying for water use.
11
There are no penalties as the payment was officially suspended.
21
Industry had to pay pollution charges for wastewater discharges into the sewer for the first time in
2003. Before that, industry only paid user fees to the Vodokanals for discharges to the sewer and pollution
charges for discharges to open waters. Potential underreporting is also a problem with respect to water
pollution charges.
Table 11 presents the 2002 data on effluent volumes and calculated revenues per pollutant. As in
Table 10 above, revenues were calculated by multiplying the discharged volumes per pollutant by the
respective charge rate. The fact that the overall revenue is higher than the due charge payments reported in
Table 8 might be explained by the exemptions granted to the Vodokanals until the end of 2005. (Penalties
and non-compliance payments, again, are not included in the calculation.) The same limits of
interpretability of the data that were pointed out for Table 10 also apply here. Table 11 highlights that in
the case of water pollution charges, 93% of the revenues in 2002 came from two parameters, biochemical
oxygen demand (BOD) and suspended solids. BOD on its own accounted for 84% of the calculated
revenues. Sulphates and chlorides had large discharge volumes, while highly toxic discharges of heavy
metals (including copper) contributed a significant percentage of the revenues.
Table 11. Revenues from Charges on Wastewater Effluents, 2002
Substance Rates,
thousand
AMD
Volume of
effluents,
tonnes
Calculated
revenue due,
thousand AMD
Share in the total
revenue, %
Total revenue due for
wastewater discharges
891 913.20 100.00
Suspended solids 5.30 14 587.00 77 313.20 8.70
Ammonium nitrate 5.10 645.70 3 293.10 0.40
Acetone 301.00 0.00 0.00 0.00
BOD 18.40 40 788.00 750 493.70 84.10
Oil products 204.60 34.87 7 133.60 0.80
Copper 1 023.90 27.47 28 126.50 3.20
Sulphates 0.10 25 168.00 2 516.80 0.30
Zinc 1 023.90 0.87 890.80 0.10
Chlorides 0.03 23 392.00 701.80 0.10
Chromium 153.40 0.04 6.30 0.00
Total phosphorus 40.00 38.71 1 548.40 0.20
Fluorine 511.50 0.09 43.70 0.01
Pesticides 18.20 0.00 0.00 0.00
Acetic acid 16.90 0.03 0.50 0.00
Sulphuric acid 16.90 0.04 0.60 0.00
Detergents 102.30 20.43 2 090.00 0.20
Salts of heavy metals 511.50 34.71 17 754.20 2.00
Cyanides 511.50 0.00 0.00 0.00
Phenols 1 023.90 0.00 0.00 0.00
Source: Data provided by the MNP
22
3.5.4. Revenues from Waste Charges
Revenues due from waste charges as well as their collection rates fluctuate significantly (see Table 8
above). The fluctuations may be due to the self-assessment of waste charge payments by industry.
Companies report both the waste amounts they produce and the classes their waste belongs to. Simple
multiplication of the waste amounts reported per waste class by the respective charge rates yields the
amount of waste charges due. Possibilities for false reporting here are double: companies may understate
the amount of waste generated and also report falsely on the hazardousness class their waste belongs to.
The revenue data in Table 12 were calculated in the same way as in Tables 10 and 11 and the same
remarks apply here. Apparently, the 2002 revenues were almost entirely based on non-hazardous industrial
and municipal solid waste. On the one hand, this can be explained by Armenia currently producing hardly
any waste falling under the two most hazardous categories.
12
On the other hand, it may be due to
underreporting of waste amounts and false waste class reporting.
Table 12. Revenues from Charges on Waste, 2002
Waste category Rate,
thousand
AMD
Volume of waste
generation,
tonnes
Calculated
revenue due,
thousand AMD
Share in
the total
revenue, %
Total revenue due for waste
'placement'
22 212.6 100.00
Class I: extremely hazardous 36.0 5.5 197.7 0.89
Class II: highly hazardous 18.0 0.0 0.0 0.00
Class III: moderately
hazardous
3.6 108.1 389.3 1.75
Class IV: least hazardous 1.2 3.6 4.3 0.02
Non-hazardous (non-toxic
industrial waste and municipal
solid waste)
0.6 36 035.4 21 621.2 97.34
Source: Data provided by the MNP
3.5.5. Revenues from Product Charges
Revenues from the product charges are recorded in Table 7. They accounted for the major part of
environmental charge revenues between 1999 and 2000. After the repeal of the petrol and diesel charges in
2000, the product charge revenues dropped to 11% of their 1999 level, and to about 21% of their 2000
level. The stability of the actual revenues from these charges over the last three reported years suggests that
charge collection poses only minor problems for the product charges. This is easily explained by the fact
that the majority of products subject to environmental charges are imported and payments are collected at
the border by the Customs Service. Indeed, MNP representatives claim that the share of domestic products
in the overall product charge revenues for 2003 was only about 1% (MNP, 2004).
13
For imported products
subject to environmental charges, underreporting is not an issue. For locally produced products, it is the
12
The waste from Armenia’s one nuclear power plant does not count under the listed waste classes, as these only
refer to waste being landfilled and because waste from nuclear power generation is not under the
jurisdiction of the MNP but under that of the Ministry for Energy.
13
No time series are available on the development of both production and consumption of environmentally harmful
products subject to environmental charges.
23
State Tax Service that collects the charge payments based on production statements by companies. There is
no information about possible underreporting.
3.5.6. State Environmental Expenditure
Table 13 presents the state environmental expenditure for the years 1998 to 2003, disaggregated into
investment and current expenditure and into different environmental domains. State expenditure for natural
resource management is also included. As can be seen, the share of current environmental expenditure in
the GDP has constantly increased from 0.05% in 1998 to 0.09% in 2003. In an international comparison,
the share of the overall state environmental expenditure in the GDP in Armenia remains low: 0.25% in
2003 compared to 0.8% in Poland and 0.5% in Hungary and the Czech Republic in 2000 (Eurostat, 2002).
Table 13. State Environmental Expenditure in Armenia (million AMD)
1998 1999 2000 2001 2002 2003
GDP 955400 987100 1031300 1175500 1321900 1434900
State environmental expenditure 1505.2 2783.6 3387.6 2176.9 2301.5 3627.6
in percentage of the GDP (%) 0.16 0.28 0.33 0.19 0.17 0.25
Current state environmental
expenditure
510.8 498.8 570.8 564.4 930.6 1233.5
in percentage of the GDP (%) 0.05 0.05 0.06 0.05 0.07 0.09
National and regional environmental investments
Total 994.4 2284.8 2816.8 1612.5 1370.9 2394.1
Air (total) 0 0 0 0 0.0 0
Water resource protection 690.3 1544.2 2354.6 1337.9 1295.4 2379.3
Waste management 304.1 740.6 462.2 274.6 75.5 7.6
Nature protection 0 0 0 0 0 7.2
National-level (state) current environmental expenditure
Total 293.8 428.7 462.1 440.2 809.6 1109.5
Air (total) 0.0 0.0 0.0 0.0 0.0 0
Water resource protection n.a. 185.0 229.0 150.7 324.3 599.4
Waste management 120.0 12.0 48.1 13.1 15.7 15.7
Nature protection 62.8 118.0 68.1 144.4 189.4 182.7
Environmental education and
information
4.5 5.1 6.8 6.5 7.3 8.8
Monitoring and information
systems
11.6 12.3 14.6 16.1 18.7 11.8
Administrative expenditure 94.9 96.3 95.5 109.4 254.2 291.1
National-level (state) current expenditure for natural resource management
Total 217.0 70.1 108.7 124.2 121.0 124.0
Forest protection and rational use 200.0 64.5 108.7 115.0 114.0 114.0
Fishery resource protection 17.0 5.6 0.0 9.2 7.0 10.0
Note: 2003 data are preliminary estimates. - Data do not include loans. Source: Data provided by the
MNP.
As can also be seen from Table 13, in Armenia, the highest part of the state environmental
expenditure goes to the water domain and administrative expenditure. Expenditure for the waste domain
has significantly declined over the years. The MNP-provided data show that subsidies to the Vodokanals
for investments in wastewater collection and treatment and to cover these companies’ operational losses
constitute a major share of the state environmental expenditure (MNP, 2004).
24
Comparing the actually collected revenues from environmental and natural resource use charges with
the total state environmental and natural resource management expenditure in Table 14 shows that the
share of the revenues allocated back to the environment varies significantly over the years. On average
over 1998-2003, 68% of the environment-related revenues have been allocated back to this sector.
Table 14. Total Environmental and Natural Resource Use-Related Revenues and Expenditure
Year Environmental and
natural resource charge
revenues, million AMD
Total state environmental
and natural resource
management expenditure,
million AMD
Share of state
environmental and natural
resource management
expenditure in revenues, %
1998 608 1 505 248
1999 6 675 2 784 42
2000 4 116 3 388 82
2001 2 282 2 177 95
2002 3 909 2 302 59
2003 5 605 3 628 65
Source: Data provided by the MNP; own calculations.
When only considering environmental charge revenues and the state environmental expenditure
(Table 15), the share of revenues that were allocated back to the environment is higher. It amounts to 80%
on average over the same 6 years.
Table 15. Total Environmental Revenues and State Environmental Expenditure
Year Total environmental
revenues, million AMD
Total state environmental
expenditure, million AMD
Share of state environmental
expenditure in revenues, %
1998 275 1 288 468.10
1999 6 147 2 714 44.14
2000 3 520 3 279 93.15
2001 1 458 2 053 140.76
2002 2 863 2 181 76.16
2003 4 428 3 504 79.13
Source: Data provided by the MNP; own calculations.
The fact that state environmental expenditure, on average, remains below the revenues collected
points to the advantage an environmental fund could provide: the use of all environmental revenues for
environmental expenditure could, in theory, be assured. Nevertheless, the MFE, during an interview,
expressed its conviction that there was no need for a specific environmental budget line, as environmental
funding would not necessarily be at the amount of the environmental revenues (MFE, 2004). Indeed,
facing a permanent national budget deficit, the government considers financing of environmental
programmes as one of its last priorities.
14
14
With respect to funding, the MFE acknowledges that it currently gives priority to social issues, such as education or
pensions (MFE, 2004).
25
Finally, it should be mentioned that there are attempts to directly recycle environmental revenues for
local environmental projects. This only direct revenue recycling scheme is set out in the Law “On targeted
use of environmental payments by companies” of 15 May 2001. This law requires that the revenues from
pollution charges from 8 companies (6 mining/metallurgical companies and 2 cement companies) be
redirected to the local communities (i.e., the lowest administrative level) in which these companies are
located. Under this law, the local communities become eligible for funds when they submit project
proposals to the Ministries of Nature Protection and Health, by which the proposals have to be approved.
After that, the regional (marz) governor has to send the proposal to the MFE which would then allocate a
certain amount of the environmental revenues from the budget back to the project. Almost all local
communities concerned have recently submitted project proposals for the first time for funding in 2005,
ranging from rehabilitation of a wastewater treatment plant to improvement of municipal solid waste
collection to upgrading public healthcare services (MNP, 2004).
3.5.7. Data on Selected Industrial Enterprises
Environment-related data by industrial sector is currently not available from Armenia’s general
statistics because the State Council for Statistics is about to transpose its previous industry classification to
the NACE classification (Nomenclature statistique des activités économiques dans la Communauté
européenne – Statistical Classification of Economic Activities in the European Community). In Armenia,
2004 will be the first year of reporting under NACE. When it became clear in 1996 that the industry
classification would be adjusted to the NACE classification, Armenia ceased publishing data disaggregated
to the level of individual sectors altogether and has since only published cumulative data on the
environment, i.e., aggregated at the national level (State Council for Statistics, 2004). This is also
explained by a lack in demand for more detailed data, at least from the MFE, which is only interested in
overall revenue data.
The following analysis, therefore, relies on data for a set of large enterprises which was provided by
the State Inspectorate. It appears that a small number of enterprises is responsible for a major part of
pollution from stationary sources. As far as air pollution is concerned, 930 enterprises are covered by air
emission permits.
15
These enterprises are believed to cover about 98% of all air emissions (MNP, 2004).
But the 9 biggest stationary industrial sources (2 cement plants, 5 mining/metallurgy plants, and 2 thermal
power plants) on their own presumably account for 70% of the air emissions from all stationary sources
(SNIP, 2004).
The inspectorate provided emission data on 9 individual enterprises:
• Five non-ferrous metallurgical enterprises:
− Kapani metallurgical processing enterprise,
− Agarak copper/molybdenum metallurgical processing enterprise,
− Armenia Copper Ltd. copper mining/processing enterprise,
− Zangezur copper/molybdenum factory,
− Ararat Gold Ltd. gold processing enterprise,
• Makur Erkat (Yerevan) iron processing company,
15
All enterprises that have a permit have to pay charges.