Plant physiology - Chapter 17 Phytochrome and Light Control of Plant Development pptx
Bạn đang xem bản rút gọn của tài liệu. Xem và tải ngay bản đầy đủ của tài liệu tại đây (858.57 KB, 29 trang )
Phytochrome and Light Control
of Plant Development
17
Chapter
HAVE YOU EVER LIFTED UP A BOARD that has been lying on a lawn
for a few weeks and noticed that the grass growing underneath was
much paler and spindlier than the surrounding grass? The reason this
happens is that the board is opaque, keeping the underlying grass in
darkness. Seedlings grown in the dark have a pale, unusually tall and
spindly appearance. This form of growth, known as
etiolated growth,
is dramatically different from the stockier, green appearance of seedlings
grown in the light (Figure 17.1).
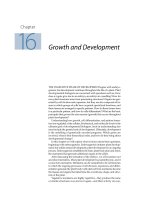
Given the key role of photosynthesis in plant metabolism, one might
be tempted to attribute much of this contrast to differences in the avail-
ability of light-derived metabolic energy. However, it takes very little
light or time to initiate the transformation from the etiolated to the green
state. So in the change from dark to light growth, light acts as a devel-
opmental trigger rather than a direct energy source.
If you were to remove the board and expose the pale patch of grass
to light, it would appear almost the same shade of green as the sur-
rounding grass within a week or so. Although not visible to the naked
eye, these changes actually start almost immediately after exposure to
light. For example, within hours of applying a single flash of relatively
dim light to a dark-grown bean seedling in the laboratory, one can mea-
sure several developmental changes: a decrease in the rate of stem elon-
gation, the beginning of apical-hook straightening, and the initiation of
the synthesis of pigments that are characteristic of green plants.
Light has acted as a signal to induce a change in the form of the
seedling, from one that facilitates growth beneath the soil, to one that is
more adaptive to growth above ground. In the absence of light, the
seedling uses primarily stored seed reserves for etiolated growth. How-
ever, seed plants, including grasses, don’t store enough energy to sus-
tain growth indefinitely. They require light energy not only to fuel pho-
tosynthesis, but to initiate the developmental switch from dark to light
growth.
Photosynthesis cannot be the driving force of this transformation
because chlorophyll is not present during this time. Full de-etiolation
does require some photosynthesis, but the initial rapid
changes are induced by a distinctly different light response,
called
photomorphogenesis (from Latin, meaning literally
“light form begins”).
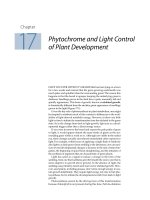
Among the different pigments that can promote photo-
morphogenic responses in plants, the most important are those
that absorb red and blue light. The blue-light photoreceptors
will be discussed in relation to guard cells and phototropism
in Chapter 18. The focus of this chapter is
phytochrome, a pro-
tein pigment that absorbs red and far-red light most strongly,
but that also absorbs blue light
. As we will see in this chapter
and in Chapter 24, phytochrome plays a key role in light-reg-
ulated vegetative and reproductive development.
We begin with the discovery of phytochrome and the
phenomenon of red/far-red photoreversibility. Next we will
discuss the biochemical and photochemical properties of
phytochrome, and the conformational changes induced by
light. Different types of phytochromes are encoded by dif-
ferent members of a multigene family, and different phy-
tochromes regulate distinct processes in the plant. These dif-
ferent phytochrome responses can be classified according
to the amount of light and light quality required to produce
the effect. Finally, we will examine what is known about the
mechanism of phytochrome action at the cellular and mol-
ecular levels, including signal transduction pathways and
gene regulation.
THE PHOTOCHEMICAL AND
BIOCHEMICAL PROPERTIES OF
PHYTOCHROME
Phytochrome, a blue protein pigment with a molecular
mass of about 125 kDa (kilodaltons), was not identified as
a unique chemical species until 1959, mainly because of
technical difficulties in isolating and purifying the protein.
However, many of the biological properties of phytochrome
had been established earlier in studies of whole plants.
The first clues regarding the role of phytochrome in
plant development came from studies that began in the
1930s on red light–induced morphogenic responses, espe-
cially seed germination. The list of such responses is now
enormous and includes one or more responses at almost
every stage in the life history of a wide range of different
green plants (Table 17.1).
A key breakthrough in the history of phytochrome was
the discovery that the effects of
red light (650–680 nm) on
morphogenesis could be reversed by a subsequent irradi-
ation with light of longer wavelengths (710–740 nm), called
far-red light. This phenomenon was first demonstrated in
germinating seeds, but was also observed in relation to stem
and leaf growth, as well as floral induction (see Chapter 24).
The initial observation was that the germination of lettuce
seeds is stimulated by red light and inhibited by far-red
light. But the real breakthrough was made many years later
when lettuce seeds were exposed to alternating treatments
of red and far-red light. Nearly 100% of the seeds that
received red light as the final treatment germinated; in seeds
that received far-red light as the final treatment, however,
germination was strongly inhibited (Figure 17.2) (Flint 1936).
Two interpretations of these results were possible. One
is that there are two pigments, a red light–absorbing pig-
ment and a far-red light–absorbing pigment, and the two
pigments act antagonistically in the regulation of seed ger-
mination. Alternatively, there might be a single pigment
that can exist in two interconvertible forms: a red
376 Chapter 17
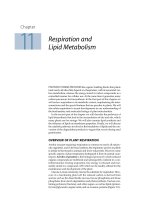
FIGURE 17.1 Corn (Zea mays) (A and B) and bean (Phaseolus
vulgaris
) (C and D) seedlings grown either in the light (A
and C) or the dark (B and D). Symptoms of etiolation in
corn, a monocot, include the absence of greening, reduction
in leaf size, failure of leaves to unroll, and elongation of the
coleoptile and mesocotyl. In bean, a dicot, etiolation symp-
toms include absence of greening, reduced leaf size,
hypocotyl elongation, and maintenance of the apical hook.
(Photos © M. B. Wilkins.)
(C) Light-grown bean (D) Dark-grown bean
(A) Light-grown corn (B) Dark-grown corn
light–absorbing form and a far-red light–absorbing form
(Borthwick et al. 1952).
The model chosen—the one-pigment model—was the
more radical of the two because there was no precedent for
such a photoreversible pigment. Several years later phy-
tochrome was demonstrated in plant extracts for the first
time, and its unique photoreversible properties were exhib-
ited in vitro, confirming the prediction (Butler et al. 1959).
In this section we will consider three broad topics:
1. Photoreversibility and its relationship to phytochrome
responses
2. The structure of phytochrome, its synthesis and
assembly, and the conformational changes associated
with the interconversions of the two main forms of
phytochrome: Pr and Pfr
3. The phytochrome gene family, the members of which
have different functions in photomorphogenesis
Phytochrome Can Interconvert between
Pr and Pfr Forms
In dark-grown or etiolated plants, phytochrome is present
in a red light–absorbing form, referred to as
Pr because it
Phytochrome and Light Control of Plant Development 377
TABLE 17.1
Typical photoreversible responses induced by phytochrome in a variety of higher and lower plants
Group Genus Stage of development Effect of red light
Angiosperms Lactuca (lettuce) Seed Promotes germination
Avena (oat) Seedling (etiolated) Promotes de-etiolation (e.g., leaf unrolling)
Sinapis (mustard) Seedling Promotes formation of leaf primordia, development of primary
leaves, and production of anthocyanin
Pisum (pea) Adult Inhibits internode elongation
Xanthium (cocklebur) Adult Inhibits flowering (photoperiodic response)
Gymnosperms
Pinus (pine) Seedling Enhances rate of chlorophyll accumulation
Pteridophytes
Onoclea (sensitive fern) Young gametophyte Promotes growth
Bryophytes
Polytrichum (moss) Germling Promotes replication of plastids
Chlorophytes Mougeotia (alga) Mature gametophyte Promotes orientation of chloroplasts to directional dim light
Dark Red Red Far-red
Red Far-red Red Red Far-red Far-redRed
FIGURE 17.2 Lettuce seed germination is a typical photore-
versible response controlled by phytochrome. Red light
promotes lettuce seed germination, but this effect is
reversed by far-red light. Imbibed (water-moistened) seeds
were given alternating treatments of red followed by far-
red light. The effect of the light treatment depended on the
last treatment given. (Photos © M. B. Wilkins.)
is synthesized in this form. Pr, which to the human eye is
blue, is converted by red light to a far-red light–absorbing
form called
Pfr, which is blue-green. Pfr, in turn, can be
converted back to Pr by far-red light.
Known as
photoreversibility, this conversion/recon-
version property is the most distinctive property of phy-
tochrome, and it may be expressed in abbreviated form as
follows:
The interconversion of the Pr and Pfr forms can be mea-
sured in vivo or in vitro. In fact, most of the spectral prop-
erties of carefully purified phytochrome measured in vitro
are the same as those observed in vivo.
When Pr molecules are exposed to red light, most of
them absorb it and are converted to Pfr, but some of the Pfr
also absorbs the red light and is converted back to Pr
because both Pr and Pfr absorb red light (Figure 17.3). Thus
the proportion of phytochrome in the Pfr form after satu-
rating irradiation by red light is only about 85%. Similarly,
the very small amount of far-red light absorbed by Pr
makes it impossible to convert Pfr entirely to Pr by broad-
spectrum far-red light. Instead, an equilibrium of 97% Pr
and 3% Pfr is achieved. This equilibrium is termed the
pho-
tostationary state
.
In addition to absorbing red light, both forms of phy-
tochrome absorb light in the blue region of the spectrum
(see Figure 17.3). Therefore, phytochrome effects can be
elicited also by blue light, which can convert Pr to Pfr and
vice versa. Blue-light responses can also result from the
action of one or more specific blue-light photoreceptors (see
Chapter 18). Whether phytochrome is involved in a
response to blue light is often determined by a test of the
ability of far-red light to reverse the response, since only
phytochrome-induced responses are reversed by far-red
light. Another way to discriminate between photoreceptors
is to study mutants that are deficient in one of the pho-
toreceptors.
Short-lived phytochrome intermediates. The photo-
conversions of Pr to Pfr, and of Pfr to Pr, are not one-step
processes. By irradiating phytochrome with very brief
flashes of light, we can observe absorption changes that
occur in less than a millisecond.
Of course, sunlight includes a mixture of all visible
wavelengths. Under such white-light conditions, both Pr
and Pfr are excited, and phytochrome cycles continuously
between the two. In this situation the intermediate forms
of phytochrome accumulate and make up a significant frac-
tion of the total phytochrome. Such intermediates could
even play a role in initiating or amplifying phytochrome
responses under natural sunlight, but this question has yet
to be resolved.
Pfr Is the Physiologically Active Form of
Phytochrome
Because phytochrome responses are induced by red light,
they could in theory result either from the appearance of
Pfr or from the disappearance of Pr. In most cases studied,
a quantitative relationship holds between the magnitude
of the physiological response and the amount of Pfr gen-
erated by light, but no such relationship holds between the
physiological response and the loss of Pr.
Evidence such as this has led to the conclusion that Pfr
is the physiologically active form of phytochrome. In cases
in which it has been shown that a phytochrome response
is not quantitatively related to the absolute amount of Pfr,
it has been proposed that the ratio between Pfr and Pr, or
between Pfr and the total amount of phytochrome, deter-
mines the magnitude of the response.
The conclusion that Pfr is the physiologically active
form of phytochrome is supported by studies with mutants
of
Arabidopsis that are unable to synthesize phytochrome.
In wild-type seedlings, hypocotyl elongation is strongly
inhibited by white light, and phytochrome is one of the
photoreceptors involved in this response. When grown
under continuous white light, mutant seedlings with long
hypocotyls were discovered and were termed
hy mutants.
Different
hy mutants are designated by numbers: hy1, hy2,
and so on. Because white light is a mixture of wavelengths
(including red, far red, and blue), some, but not all, of the
hy mutants have been shown to be deficient for one or
more functional phytochrome(s).
Pr Pfr
Red light
Far-red light
378 Chapter 17
400300 500 600 700 800
Wavelength (nm)
730
Pfr
Pr
666
Red Far red
Ultra-
violet
Visible spectrum
Infrared
0.6
0.8
0.4
0.2
Absorbance
FIGURE 17.3 Absorption spectra of purified oat phy-
tochrome in the Pr (green line) and Pfr (blue line) forms
overlap. (After Vierstra and Quail 1983.)
The phenotypes of phytochrome-deficient mutants have
been useful in identifying the physiologically active form
of phytochrome. If the phytochrome-induced response to
white light (hypocotyl growth inhibition) is caused by the
absence of Pr, such phytochrome-deficient mutants (which
have neither Pr nor Pfr) should have short hypocotyls in
both darkness and white light. Instead, the opposite occurs;
that is, they have long hypocotyls in both darkness and
white light. It is the absence of Pfr that prevents the
seedlings from responding to white light. In other words,
Pfr brings about the physiological response.
Phytochrome Is a Dimer Composed of
Two Polypeptides
Native phytochrome is a soluble protein with a molecular
mass of about 250 kDa. It occurs as a dimer made up of two
equivalent subunits. Each subunit consists of two compo-
nents: a light-absorbing pigment molecule called the
chro-
mophore
, and a polypeptide chain called the apoprotein.
The apoprotein monomer has a molecular mass of about
125 kDa. Together, the apoprotein and its chromophore
make up the
holoprotein. In higher plants the chromophore
of phytochrome is a linear tetrapyrrole termed
phytochro-
mobilin
. There is only one chromophore per monomer of
apoprotein, and it is attached to the protein through a
thioether linkage to a cysteine residue (Figure 17.4).
Researchers have visualized the Pr form of phytochrome
using electron microscopy and X-ray scattering, and the
model shown in Figure 17.5 has been proposed (Nakasako
et al. 1990). The polypeptide folds into two major domains
separated by a “hinge” region. The larger N-terminal
domain is approximately 70 kDa and bears the chro-
mophore; the smaller C-terminal domain is approximately
55 kDa and contains the site where the two monomers asso-
ciate with each other to form the dimer (see
Web Topic 17.1).
Phytochromobilin Is Synthesized in Plastids
The phytochrome apoprotein alone cannot absorb red or
far-red light. Light can be absorbed only when the
polypeptide is covalently linked with phytochromobilin to
form the holoprotein. Phytochromobilin is synthesized
inside plastids and is derived from 5-aminolevulinic acid
via a pathway that branches from the chlorophyll biosyn-
thetic pathway (see
Web Topic 7.11). It is thought to leak
out of the plastid into the cytosol by a passive process.
Assembly of the phytochrome apoprotein with its chro-
mophore is
autocatalytic; that is, it occurs spontaneously
when purified phytochrome polypeptide is mixed with
purified chromophore in the test tube, with no additional
proteins or cofactors (Li and Lagarias 1992). The resultant
holoprotein has spectral properties similar to those
observed for the holoprotein purified from plants, and it
exhibits red/far-red reversibility (Li and Lagarias 1992).
Mutant plants that lack the ability to synthesize the
chromophore are defective in processes that require the
action of phytochrome, even though the apoprotein
polypeptides are present. For example, several of the
hy
mutants noted earlier, in which white light fails to suppress
hypocotyl elongation, have defects in chromophore biosyn-
thesis. In
hy1 and hy2 mutant plants, phytochrome apopro-
tein levels are normal, but there is little or no spectrally
Phytochrome and Light Control of Plant Development 379
N
H
+
N
H
H
15
15
N
H
C
D
O
R
R
N
S
5
10
H
A
B
O
Pro
His
Ser
Cys
His
Leu
Gln
Pro
His
Ser
Cys
His
Leu
Gln
N
H
+
N
H
N
H
H
C
D
O
R
R
N
S
5
H
A
B
O
10
Thioether
linkage
Chromophore: phytochromobilin
Red light
converts
cis to trans
Pr
Pfr
Polypeptide
Cis isomer
Trans isomer
FIGURE 17.4 Structure of the Pr and Pfr forms of the chro-
mophore (phytochromobilin) and the peptide region bound
to the chromophore through a thioether linkage. The chro-
mophore undergoes a
cis–trans isomerization at carbon 15 in
response to red and far-red light. (After Andel et al. 1997.)
IIB
IIA
Chromophore-binding
domains
IB
IA
FIGURE 17.5 Structure of the phytochrome dimer. The
monomers are labeled I and II. Each monomer consists of a
chromophore-binding domain (A) and a smaller nonchro-
mophore domain (B). The molecule as a whole has an ellip-
soidal rather than globular shape. (After Tokutomi et al.
1989.)
active holoprotein. When a chromophore precursor is sup-
plied to these seedlings, normal growth is restored.
The same type of mutation has been observed in other
species. For example, the
yellow-green mutant of tomato has
properties similar to those of
hy mutants, suggesting that it
is also a chromophore mutant.
Both Chromophore and Protein Undergo
Conformational Changes
Because the chromophore absorbs the light, conformational
changes in the protein are initiated by changes in the chro-
mophore. Upon absorption of light, the Pr chromophore
undergoes a
cis–trans isomerization of the double bond
between carbons 15 and 16 and rotation of the C14–C15
single bond (see Figure 17.4) (Andel et al. 1997). During the
conversion of Pr to Pfr, the protein moiety of the phy-
tochrome holoprotein also undergoes a subtle conforma-
tional change.
Several lines of evidence suggest that the light-induced
change in the conformation of the polypeptide occurs both
in the N-terminal chromophore-binding domain and in the
C-terminal region of the protein.
Two Types of Phytochromes Have Been Identified
Phytochrome is most abundant in etiolated seedlings; thus
most biochemical studies have been carried out on phy-
tochrome purified from nongreen tissues. Very little phy-
tochrome is extractable from green tissues, and a portion
of the phytochrome that can be extracted differs in molec-
ular mass from the abundant form of phytochrome found
in etiolated plants.
Research has shown that there are two different classes
of phytochrome with distinct properties. These have been
termed Type I and Type II phytochromes (Furuya 1993).
Type I is about nine times more abundant than Type II in
dark-grown pea seedlings; in light-grown pea seedlings the
amounts of the two types are about equal. More recently,
the two types have been shown to be distinct proteins.
The cloning of genes that encode different phytochrome
polypeptides has clarified the distinct nature of the phy-
tochromes present in etiolated and green seedlings. Even
in etiolated seedlings, phytochrome is a mixture of related
proteins encoded by different genes.
Phytochrome Is Encoded by a Multigene Family
The cloning of phytochrome genes made it possible to
carry out a detailed comparison of the amino acid
sequences of the related proteins. It also allowed the study
of their expression patterns, at both the mRNA and the pro-
tein levels.
The first phytochrome sequences cloned were from
monocots. These studies and subsequent research indicated
that phytochromes are soluble proteins—a finding that is
consistent with previous purification studies. A comple-
mentary-DNA clone encoding phytochrome from the dicot
zucchini (
Cucurbita pepo) was used to identify five struc-
turally related phytochrome genes in
Arabidopsis (Sharrock
and Quail 1989). This phytochrome gene family is named
PHY, and its five individual members are PHYA, PHYB,
PHYC, PHYD, and PHYE.
The apoprotein by itself (without the chromophore) is
designated PHY; the holoprotein (with the chromophore)
is designated phy. By convention, phytochrome sequences
from other higher plants are named according to their
homology with the
Arabidopsis PHY genes. Monocots
appear to have representatives of only the
PHYA through
PHYC families, while dicots have others derived by gene
duplication (Mathews and Sharrock 1997).
Some of the
hy mutants have turned out to be selectively
deficient in specific phytochromes. For example,
hy3 is defi-
cient in phyB, and
hy1 and hy2 are deficient in chro-
mophore. These and other
phy mutants have been useful in
determining the physiological functions of the different
phytochromes (as discussed later in this chapter).
PHY Genes Encode Two Types of Phytochrome
On the basis of their expression patterns, the products of
members of the
PHY gene family can be classified as either
Type I or Type II phytochromes.
PHYA is the only gene that
encodes a Type I phytochrome. This conclusion is based on
the expression pattern of the
PHYA promoter, as well as on
the accumulation of its mRNA and polypeptide in response
to light. Additional studies of plants that contain mutated
forms of the
PHYA gene (termed phyA alleles) have con-
firmed this conclusion and have given some clues about
the role of this phytochrome in whole plants.
The
PHYA gene is transcriptionally active in dark-grown
seedlings, but its expression is strongly inhibited in the
light in monocots. In dark-grown oat, treatment with red
light reduces phytochrome synthesis because the Pfr form
of phytochrome inhibits the expression of its own gene. In
addition, the
PHYA mRNA is unstable, so once etiolated
oat seedlings are transferred to the light,
PHYA mRNA
rapidly disappears. The inhibitory effect of light on
PHYA
transcription is less dramatic in dicots, and in Arabidopsis
red light has no measurable effect on PHYA.
The amount of phyA in the cell is also regulated by pro-
tein destruction. The Pfr form of the protein encoded by the
PHYA gene, called PfrA, is unstable. There is evidence that
PfrA may become marked or tagged for destruction by the
ubiquitin system (Vierstra 1994). As discussed in Chapter
14 on the web site,
ubiquitin is a small polypeptide that
binds covalently to proteins and serves as a recognition site
for a large proteolytic complex, the
proteasome.
Therefore, oats and other monocots rapidly lose most of
their Type I phytochrome (phyA) in the light as a result of
a combination of factors: inhibition of transcription, mRNA
degradation, and proteolysis:
380 Chapter 17
In dicots, phyA levels also decline in the light as a result of
proteolysis, but not as dramatically.
The remaining
PHY genes (PHYB through PHYE)
encode the Type II phytochromes. Although detected in
green plants, these phytochromes are also present in etio-
lated plants. The reason is that the expression of their
mRNAs is not significantly changed by light, and the
encoded phyB through phyE proteins are more stable in
the Pfr form than is PfrA.
LOCALIZATION OF PHYTOCHROME IN
TISSUES AND CELLS
Valuable insights into the function of a protein can be
gained from a determination of where it is located. It is not
surprising, therefore, that much effort has been devoted to
the localization of phytochrome in organs and tissues, and
within individual cells.
Phytochrome Can Be Detected in Tissues
Spectrophotometrically
The unique photoreversible properties of phytochrome can
be used to quantify the pigment in whole plants through
the use of a spectrophotometer. Because its color is masked
by chlorophyll, phytochrome is difficult to detect in green
tissue. In dark-grown plants, where there is no chlorophyll,
phytochrome has been detected in many angiosperm tis-
sues—both monocot and dicot—as well as in gym-
nosperms, ferns, mosses, and algae.
In etiolated seedlings the highest phytochrome levels
are usually found in meristematic regions or in regions that
were recently meristematic, such as the bud and first node
of pea (Figure 17.6), or the tip and node regions of the
coleoptile in oat. However, differences in expression pat-
terns between monocots and dicots and between Type I
and Type II phytochromes are apparent when other, more
sensitive methods are used.
Phytochrome Is Differentially Expressed In
Different Tissues
The cloning of individual PHY genes has enabled researchers
to determine the patterns of expression of individual phy-
tochromes in specific tissues by several methods. The
sequences can be used directly to probe mRNAs isolated
from different tissues or to analyze transcriptional activity by
means of a reporter gene, which visually reveals sites of gene
expression. In the latter approach, the promoter of a
PHYA or
PHYB gene is joined to the coding portion of a reporter gene,
such as the gene for the enzyme
β-glucuronidase, which is
PHYB–E
mRNA Pr Pfr Response
Red
Far red
–
PHYA
mRNA
Degradation
Pr Pfr Response
Red
Far red
Ubiquitin +
Ubiquitin
ATP
Degradation
Phytochrome and Light Control of Plant Development 381
0
2
12
22
20
10
0
20
10
0
Epicotyl
First node
Cotyledon
Root
Concentration of phytochrome
Distance (mm)
FIGURE 17.6 Phytochrome is
most heavily concentrated in
the regions where dramatic
developmental changes are
occurring: the apical meristems
of the epicotyl and root. Shown
here is the distribution of phy-
tochrome in an etiolated pea
seedling, as measured spec-
trophotometrically. (From
Kendrick and Frankland 1983.)
called GUS (recall that the promoter is the sequence upstream
of the gene that is required for transcription).
The advantage of using the
GUS sequence is that it
encodes an enzyme that, even in very small amounts, con-
verts a colorless substrate to a colored precipitate when the
substrate is supplied to the plant. Thus, cells in which the
PHYA promoter is active will be stained blue, and other
cells will be colorless. The hybrid, or fused, gene is then
placed back into the plant through use of the Ti plasmid of
Agrobacterium tumefaciens as a vector (see Web Topic 21.5).
When this method was used to examine the transcrip-
tion of two different
PHYA genes in tobacco, dark-grown
seedlings were found to contain the highest amount of
stain in the apical hook and the root tips, in keeping with
earlier immunological studies (Adam et al. 1994). The pat-
tern of staining in light-grown seedlings was similar but,
as might be expected, was of much lower intensity. Similar
studies with
Arabidopsis PHYA–GUS and PHYB–GUS
fusions placed back in Arabidopsis confirmed the PHYA
results for tobacco and indicated that PHYB–GUS is
expressed at much lower levels than
PHYA–GUS in all tis-
sues (Somers and Quail 1995).
A recent study comparing the expression patterns of
PHYB–GUS, PHYD–GUS, and PHYE–GUS fusions in Ara-
bidopsis
has revealed that although these Type II promoters
are less active than the Type I promoters, they do show dis-
tinct expression patterns (Goosey et al. 1997). Thus the gen-
eral picture emerging from these studies is that the phy-
tochromes are expressed in distinct but overlapping
patterns.
In summary, phytochromes are most abundant in
young, undifferentiated tissues, in the cells where the
mRNAs are most abundant and the promoters are most
active. The strong correlation between phytochrome abun-
dance and cells that have the potential for dynamic devel-
opmental changes is consistent with the important role of
phytochromes in controlling such developmental changes.
However, note that the studies discussed here do not
address whether the phytochromes are photoactive as
apoproteins or holoproteins.
Because the expression patterns of individual phy-
tochromes overlap, it is not surprising that they function
cooperatively, although they probably also use distinct sig-
nal transduction pathways. Support for this idea also
comes from the study of phytochrome mutants, which we
will discuss later in this chapter.
CHARACTERISTICS OF PHYTOCHROME-
INDUCED WHOLE-PLANT RESPONSES
The variety of different phytochrome responses in intact
plants is extensive, in terms of both the kinds of responses
(see Table 17.1) and the quantity of light needed to induce
the responses. A survey of this variety will show how
diversely the effects of a single photoevent—the absorption
of light by Pr—are manifested throughout the plant. For
ease of discussion, phytochrome-induced responses may
be logically grouped into two types:
1. Rapid biochemical events
2. Slower morphological changes, including movements
and growth
Some of the early biochemical reactions affect later
developmental responses. The nature of these early bio-
chemical events, which comprise signal transduction path-
ways, will be treated in detail later in the chapter. Here we
will focus on the effects of phytochrome on whole-plant
responses. As we will see, such responses can be classified
into various types, depending on the amount and duration
of light required, and on their action spectra.
Phytochrome Responses Vary in Lag Time and
Escape Time
Morphological responses to the photoactivation of phy-
tochrome may be observed visually after a
lag time—the
time between a stimulation and an observed response. The
lag time may be as brief as a few minutes or as long as sev-
eral weeks. The more rapid of these responses are usually
reversible movements of organelles (see
Web Topic 17.2)
or reversible volume changes (swelling, shrinking) in cells,
but even some growth responses are remarkably fast.
Red-light inhibition of the stem elongation rate of light-
grown pigweed (
Chenopodium album) is observed within 8
minutes after its relative level of Pfr is increased. Kinetic
studies using
Arabidopsis have confirmed this observation
and further shown that phyA acts within minutes after
exposure to red light (Parks and Spalding 1999). In these
studies the primary contribution of phyA was found to be
over by 3 hours, at which time phyA protein was no longer
detectable through the use of antibodies, and the contribu-
tion of phyB increased (Morgan and Smith 1978). Longer
lag times of several weeks are observed for the induction
of flowering (see Chapter 24).
Information about the lag time for a phytochrome
response helps researchers evaluate the kinds of biochem-
ical events that could precede and cause the induction of
that response. The shorter the lag time, the more limited the
range of biochemical events that could have been involved.
Variety in phytochrome responses can also be seen in
the phenomenon called
escape from photoreversibility.
Red light–induced events are reversible by far-red light for
only a limited period of time, after which the response is
said to have “escaped” from reversal control by light.
A model to explain this phenomenon assumes that phy-
tochrome-controlled morphological responses are the result
of a step-by-step sequence of linked biochemical reactions
in the responding cells. Each of these sequences has a point
of no return beyond which it proceeds irrevocably to the
response. The escape time for different responses ranges
from less than a minute to, remarkably, hours.
382 Chapter 17
Phytochrome Responses Can Be Distinguished by
the Amount of Light Required
In addition to being distinguished by lag times and escape
times, phytochrome responses can be distinguished by the
amount of light required to induce them. The amount of
light is referred to as the
fluence,
1
which is defined as the
number of photons impinging on a unit surface area (see
Chapter 9 and
Web Topic 9.1). The most commonly used
units for fluence are moles of quanta per square meter (mol
m
–2
). In addition to the fluence, some phytochrome
responses are sensitive to the
irradiance,
2
or fluence rate, of
light. The units of irradiance in terms of photons are moles
of quanta per square meter per second (mol m
–2
s
–1
).
Each phytochrome response has a characteristic range
of light fluences over which the magnitude of the response
is proportional to the fluence. As Figure 17.7 shows, these
responses fall into three major categories based on the
amount of light required: very-low-fluence responses
(VLFRs), low-fluence responses (LFRs), and high-irradi-
ance responses (HIRs).
Very-Low-Fluence Responses Are
Nonphotoreversible
Some phytochrome responses can be initiated by fluences
as low as 0.0001
µmol m
–2
(one-tenth of the amount of
light emitted from a firefly in a single flash), and they sat-
urate (i.e., reach a maximum) at about 0.05
µmol m
–2
. For
example, in dark-grown oat seedlings, red light can stim-
ulate the growth of the coleoptile and inhibit the growth
of the mesocotyl (the elongated axis between the coleop-
tile and the root) at such low fluences.
Arabidopsis seeds
can be induced to germinate with red light in the range of
0.001 to 0.1
µmol m
–2
. These remarkable effects of vanish-
ingly low levels of illumination are called
very-low-flu-
ence responses
(VLFRs).
The minute amount of light needed to induce VLFRs
converts less than 0.02% of the total phytochrome to Pfr.
Because the far-red light that would normally reverse a
red-light effect converts 97% of the Pfr to Pr (as discussed
earlier), about 3% of the phytochrome remains as Pfr—sig-
nificantly more than is needed to induce VLFRs (Mandoli
and Briggs 1984). Thus, far-red light cannot reverse VLFRs.
The VLFR action spectrum matches the absorption spec-
trum of Pr, supporting the view that Pfr is the active form
for these responses (Shinomura et al. 1996).
Ecological implications of the VLFR in seed germina-
tion are discussed in
Web Essay 17.1
Low-Fluence Responses Are Photoreversible
Another set of phytochrome responses cannot be initiated
until the fluence reaches 1.0
µmol m
–2
, and they are satu-
rated at 1000
µmol m
–2
. These responses are referred to as
low-fluence responses (LFRs), and they include most of
the red/far-red photoreversible responses, such as the pro-
motion of lettuce seed germination and the regulation of
leaf movements, that are mentioned in Table 17.1. The LFR
action spectrum for
Arabidopsis seed germination is shown
in Figure 17.8. LFR spectra include a main peak for stim-
ulation in the red region (660 nm), and a major peak for
inhibition in the far-red region (720 nm).
Both VLFRs and LFRs can be induced by brief pulses of
light, provided that the total amount of light energy adds
up to the required fluence. The total fluence is a function of
two factors: the fluence rate (mol m
–2
s
–1
) and the irradia-
tion time. Thus a brief pulse of red light will induce a
response, provided that the light is sufficiently bright, and
conversely, very dim light will work if the irradiation time
is long enough. This reciprocal relationship between fluence
rate and time is known as the
law of reciprocity, which was
first formulated by R. W. Bunsen and H. E. Roscoe in 1850.
VLFRs and LFRs both obey the law of reciprocity.
High-Irradiance Responses Are Proportional to the
Irradiance and the Duration
Phytochrome responses of the third type are termed high-
irradiance responses
(HIRs), several of which are listed in
Phytochrome and Light Control of Plant Development 383
1
For definitions of fluence, irradiance, and other terms
involved in light measurement, see
Web Topic 9.1.
2
Irradiance is sometimes loosely equated with light inten-
sity. The term
intensity, however, refers to light emitted by
the source, whereas
irradiance refers to light that is incident
on the object.
–8 –6 –4 –202468
Log fluence (µmol m
–2
)
Relative response
VLFR:
Reciprocity applies,
not FR-reversible
LFR:
Reciprocity applies,
FR-reversible
HIR: Fluence rate
dependent, long
irradiation required,
and not photo-
reversible, reciprocity
does not apply
I
1
I
2
I
3
FIGURE 17.7 Three types of phytochrome responses, based
on their sensitivities to fluence. The relative magnitudes of
representative responses are plotted against increasing flu-
ences of red light. Short light pulses activate VLFRs and
LFRs. Because HIRs are also proportional to the irradiance,
the effects of three different irradiances given continuously
are illustrated (I
1
> I
2
> I
3
). (From Briggs et al. 1984.)
Table 17.2. HIRs require prolonged or continuous exposure
to light of relatively high irradiance, and the response is
proportional to the irradiance within a certain range.
The reason that these responses are called high-irradiance
responses rather than high-fluence responses is that they are
proportional to irradiance (loosely speaking, the brightness
of the light) rather than to fluence. HIRs saturate at much
higher fluences than LFRs—at least 100 times higher—and
are not photoreversible. Because neither continuous expo-
sure to dim light nor transient exposure to bright light can
induce HIRs, HIRs do not obey the law of reciprocity.
Many of the photoreversible LFRs listed in Table 17.1,
particularly those involved in de-etiolation, also qualify as
HIRs. For example, at low fluences the action spectrum for
anthocyanin production in seedlings of white mustard
(
Sinapis alba) shows a single peak in the red region of the
spectrum, the effect is reversible with far-red light, and the
response obeys the law of reciprocity. However, if the dark-
grown seedlings are instead exposed to high-irradiance
light for several hours, the action spectrum now includes
peaks in the far-red and blue regions (see the next section),
the effect is no longer photoreversible, and the response
becomes proportional to the irradiance. Thus the same
effect can be either an LFR or an HIR, depending on its his-
tory of exposure to light.
The HIR Action Spectrum of Etiolated Seedlings
Has Peaks in the Far-Red, Blue, and UV-A Regions
HIRs, such as the inhibition of stem or hypocotyl growth,
have usually been studied in dark-grown, etiolated
seedlings. The HIR action spectrum for the inhibition of
hypocotyl elongation in dark-grown lettuce seedlings is
shown in Figure 17.9. For HIRs the main peak of activity is
in the far-red region between the absorption maxima of Pr
and Pfr, and there are peaks in the blue and UV-A regions
as well
. Because the absence of a peak in the red region is
unusual for a phytochrome-mediated response, at first
researchers believed that another pigment might be
involved.
A large body of evidence now supports the view that
phytochrome is one of the photoreceptors involved in HIRs
(see
Web Topic 17.3). However, it has long been suspected
that the peaks in the UV-A and blue regions are due to a
separate photoreceptor that absorbs UV-A and blue light.
As a test of this hypothesis, the HIR action spectrum for
the inhibition of hypocotyl elongation was determined in
dark-grown
hy2 mutants of Arabidopsis, which have little or
no phytochrome holoprotein. As expected, the wild-type
seedlings exhibited peaks in the UV-A, blue, and far-red
regions of the spectrum. In contrast, the
hy2 mutant failed
to respond to either far-red or red light.
Although the phytochrome-deficient
hy2
mutant exhibited no peak in the far-red
region, it showed a normal response to
UV-A and blue light (Goto et al. 1993).
These results demonstrate that phy-
tochrome is not involved in the HIR to
either UV-Aor blue light, and that a sep-
arate blue/UV-A photoreceptor is
responsible for the response to these
384 Chapter 17
100
40
60
80
20
0
400350 450 500 550 600 650 700 750 800
Wavelength (nm)
Relative quantum effectiveness
Stimulation Inhibition
Ultra-
violet
Visible spectrum
FIGURE 17.8 LFR action spectra
for the photoreversible stimula-
tion and inhibition of seed ger-
mination in
Arabidopsis. (After
Shropshire et al. 1961.)
TABLE 17.2
Some plant photomorphogenic responses induced by high irradiances
Synthesis of anthocyanin in various dicot seedings and in apple skin segments
Inhibition of hypocotyl elongation in mustard, lettuce, and petunia seedlings
Induction of flowering in henbane (
Hyoscyamus)
Plumular hook opening in lettuce
Enlargement of cotyledons in mustard
Production of ethylene in sorghum
wavelengths. More recent studies indicate that the blue-
light photoreceptors CRY1 and CRY2 are involved in blue-
light inhibition of hypocotyl elongation.
The HIR Action Spectrum of Green Plants Has a
Major Red Peak
During studies of the HIR of etiolated seedlings, it was
observed that the response to continuous far-red light
declines rapidly as the seedlings begin to green. For exam-
ple, the action spectrum for the inhibition of hypocotyl
growth of light-grown green
Sinapis alba (white mustard)
seedlings is shown in Figure 17.10. In general, HIR action
spectra for light-grown plants exhibit a single major peak
in the red, similar to the action spectra of LFRs (see Figure
17.8), except that the effect is nonphotoreversible.
The loss of responsiveness to continuous far-red light is
strongly correlated with the depletion of the light-labile
pool of Type I phytochrome, which consists mostly of
phyA. This finding suggests that the HIR of etiolated
seedlings to far-red light is mediated by phyA, whereas
the HIR of green seedlings to red light is mediated by the
Type II phytochrome phyB and pos-
sibly others.
ECOLOGICAL FUNCTIONS:
SHADE AVOIDANCE
Thus far we have discussed phy-
tochrome-regulated responses as
studied in the laboratory. However,
phytochrome plays important eco-
logical roles for plants growing in the
environment. In the discussion that
follows we will learn how plants
sense and respond to shading by
other plants, and how phytochrome
is involved in regulating various
daily rhythms. We will also examine
the specialized functions of the dif-
ferent phytochrome gene family
members in these processes.
Phytochrome Enables Plants
to Adapt to Changing Light
Conditions
The presence of a red/far-red re-
versible pigment in all green plants,
from algae to dicots, suggests that
these wavelengths of light provide
information that helps plants adjust to
their environment. What environmen-
tal conditions change the relative lev-
els of these two wavelengths of light in natural radiation?
The ratio of red light (R) to far-red light (FR) varies
remarkably in different environments. This ratio can be
defined as follows:
Phytochrome and Light Control of Plant Development 385
1.2
1.0
0.8
0.6
0.4
0.2
320 400 500 600 700 nm 800
Wavelength (nm)
Relative quantum effectiveness
Active in inhibiting
hypocotyl elongation
UV-A Blue
658 nm
768 nm
Far-red peak
of activity
Hypocotyl
Far red
Ultra-
violet
Visible spectrum
FIGURE 17.9 HIR action spectrum for the inhibition of hypocotyl elongation of
dark-grown lettuce seedlings. The peaks of activity for the inhibition of
hypocotyl elongation occur in the UV-A, blue, and far-red regions of the spec-
trum. (After Hartmann 1967.)
60
80
100
40
20
0
400 500 600 700 800
Wavelength (nm)
Relative quantum effectiveness
Hypocotyl
Visible spectrum
FIGURE 17.10 HIR action spectra for the inhibition of hypocotyl elongation of light-
grown white mustard (Sinapis alba) seedlings. (After Beggs et al. 1980.)
Table 17.3 compares both the total light intensity in photons
(400–800 nm) and the R/FR values in eight natural envi-
ronments. Both parameters vary greatly in different envi-
ronments.
Compared with direct daylight, there is relatively more
far-red light during sunset, under 5 mm of soil, or under
the canopy of other plants (as on the floor of a forest). The
canopy phenomenon results from the fact that green leaves
absorb red light because of their high chlorophyll content
but are relatively transparent to far-red light.
The R:FR ratio and shading. An important function of
phytochrome is that it enables plants to sense shading by
other plants. Plants that increase stem extension in response
to shading are said to exhibit a
shade avoidance response.
As shading increases, the R:FR ratio decreases. The greater
proportion of far-red light converts more Pfr to Pr, and the
ratio of Pfr to total phytochrome (Pfr/Ptotal) decreases.
When simulated natural radiation was used to vary the far-
red content, it was found that for so-called sun plants
(plants that normally grow in an open-field habitat), the
higher the far-red content (i.e., the lower the Pfr:Ptotal ratio),
the higher the rate of stem extension (Figure 17.11).
In other words, simulated canopy shading (high levels
of far-red light) induced these plants to allocate more of
their resources to growing taller. This correlation did not
hold for “shade plants,” which normally grow in a shaded
environment. Shade plants showed little or no reduction in
their stem extension rate as they were exposed to higher
R/FR values (see Figure 17.11). Thus there appears to be
a systematic relationship between phytochrome-controlled
growth and species habitat. Such results are taken as an
indication of the involvement of phytochrome in shade
perception.
For a “sun plant” or “shade-avoiding plant” there is a
clear adaptive value in allocating its resources toward more
rapid extension growth when it is shaded by another plant.
In this way it can enhance its chances of
growing above the canopy and acquiring
a greater share of unfiltered, photosyn-
thetically active light. The price for favor-
ing internode elongation is usually
reduced leaf area and reduced branching,
but at least in the short run this adapta-
tion to canopy shade seems to work.
The R:FR ratio and seed germination.
Light quality also plays a role in regulat-
ing the germination of some seeds. As
discussed earlier, phytochrome was dis-
covered in studies of light-dependent let-
tuce seed germination.
In general, large-seeded species, with
ample food reserves to sustain prolonged
seedling growth in darkness (e.g., under-
ground), do not require light for germi-
nation. However, a light requirement is
R/FR =
Photon fluence rate
in 10 nm band centered on 660 nm
Photon fluence rate
in 10 nm band centered on 730 nm
386 Chapter 17
TABLE 17.3
Ecologically important light parameters
Photon flux density
(µmol m
–2
s
–1
) R/FR
a
Daylight 1900 1.19
Sunset 26.5 0.96
Moonlight 0.005 0.94
Ivy canopy 17.7 0.13
Lakes, at a depth of 1 m
Black Loch 680 17.2
Loch Leven 300 3.1
Loch Borralie 1200 1.2
Soil, at a depth of 5 mm 8.6 0.88
Source: Smith 1982, p. 493.
Note: The light intensity factor (400–800 nm) is given as the photon flux density, and phy-
tochrome-active light is given as the R:FR ratio.
a
Absolute values taken from spectroradiometer scans; the values should be taken to indi-
cate the relationships between the various natural conditions and not as actual environ-
mental means.
0.08
0.10
0.06
0.04
0.02
0.0 0.2 0.4 0.6 0.8
Pfr/P
total
Logarithm of the stem elongation rate
Shade plants
Sun plants
FIGURE 17.11 Role of phytochrome in shade perception in
sun plants (solid line) versus shade plants (dashed line).
(After Morgan and Smith 1979.)
often observed in the small seeds of herbaceous and grass-
land species, many of which remain dormant, even while
hydrated, if they are buried below the depth to which light
penetrates. Even when such seeds are on or near the soil
surface, their level of shading by the vegetation canopy
(i.e., the R:FR ratio they receive) is likely to affect their ger-
mination. For example, it is well documented that far-red
enrichment imparted by a leaf canopy inhibits germination
in a range of small-seeded species.
For the small seeds of the tropical species trumpet tree
(
Cecropia obtusifolia) and Veracruz pepper (Piper auritum)
planted on the floor of a deeply shaded forest, this inhibi-
tion can be reversed if a light filter is placed immediately
above the seeds that permits the red component of the
canopy-shaded light to pass through while blocking the
far-red component. Although the canopy transmits very lit-
tle red light, the level is enough to stimulate the seeds to
germinate, probably because most of the inhibitory far-red
light is excluded by the filter and the R:FR ratio is very
high. These seeds would also be more likely to germinate
in spaces receiving sunlight through gaps in the canopy
than in densely shaded spaces. The sunlight would help
ensure that the seedlings became photosynthetically self-
sustaining before their seed food reserves were exhausted.
As will be discussed later in the chapter, recent studies
on light-dependent lettuce seeds have shown that red
light–induced germination is the result of an increase in the
level of the biologically active form of the hormone gib-
berellin. Thus, phytochrome may promote seed germina-
tion through its effects on gibberellin biosynthesis (see
Chapter 20).
ECOLOGICAL FUNCTIONS:
CIRCADIAN RHYTHMS
Various metabolic processes in
plants, such as oxygen evolution and
respiration, cycle alternately through
high-activity and low-activity phases
with a regular periodicity of about 24
hours. These rhythmic changes are
referred to as
circadian rhythms
(from the Latin circa diem, meaning
“approximately a day”). The
period
of a rhythm is the time that elapses
between successive peaks or troughs
in the cycle, and because the rhythm
persists in the absence of external
controlling factors, it is considered to
be
endogenous.
The endogenous nature of circa-
dian rhythms suggests that they are
governed by an internal pacemaker,
called an
oscillator. The endoge-
nous oscillator is coupled to a vari-
ety of physiological processes. An important feature of the
oscillator is that it is unaffected by temperature, which
enables the clock to function normally under a wide variety
of seasonal and climatic conditions. The clock is said to
exhibit
temperature compensation.
Light is a strong modulator of rhythms in both plants
and animals. Although circadian rhythms that persist
under controlled laboratory conditions usually have peri-
ods one or more hours longer or shorter than 24 hours, in
nature their periods tend to be uniformly closer to 24 hours
because of the synchronizing effects of light at daybreak,
referred to as
entrainment. Both red and blue light are
effective in entrainment. The red-light effect is photore-
versible by far-red light, indicative of phytochrome; the
blue-light effect is mediated by blue-light photoreceptor(s).
Phytochrome Regulates the Sleep Movements
of Leaves
The sleep movements of leaves, referred to as nyctinasty,
are a well-described example of a plant circadian rhythm
that is regulated by light. In nyctinasty, leaves and/or
leaflets extend horizontally (open) to face the light during
the day and fold together vertically (close) at night (Figure
17.12). Nyctinastic leaf movements are exhibited by many
legumes, such as
Mimosa, Albizia, and Samanea, as well as
members of the oxalis family. The change in leaf or leaflet
angle is caused by rhythmic turgor changes in the cells of
the
pulvinus (plural pulvini), a specialized structure at the
base of the petiole.
Once initiated, the rhythm of opening and closing per-
sists even in constant darkness, both in whole plants and
in isolated leaflets (Figure 17.13). The phase of the rhythm
(see Chapter 24), however, can be shifted by various exoge-
nous signals, including red or blue light.
Phytochrome and Light Control of Plant Development 387
FIGURE 17.12 Nyctinastic leaf movements of Mimosa pudica. (A) Leaflets open.
(B) Leaflets closed. (Photos © David Sieren/Visuals Unlimited.)
(B)
(A)
Light also directly affects movement: Blue light stimu-
lates closed leaflets to open, and red light followed by dark-
ness causes open leaflets to close. The leaflets begin to close
within 5 minutes after being transferred to darkness, and
closure is complete in 30 minutes. Because the effect of red
light can be canceled by far-red light, phytochrome regu-
lates leaflet closure.
The physiological mechanism of leaf movement is well
understood. It results from turgor
changes in cells located on opposite
sides of the pulvinus, called
ventral
motor cells
and dorsal motor cells
(Figure 17.14). These changes in turgor
pressure depend on K
+
and Cl
–
fluxes
across the plasma membranes of the
dorsal and ventral motor cells. Leaflets
open when the dorsal motor cells accu-
mulate K
+
and Cl
–
, causing them to
swell, while the ventral motor cells
release K
+
and Cl
–
, causing them to
shrink. Reversal of this process results
in leaflet closure. Leaflet closure is
therefore an example of a rapid
response to phytochrome involving
ion fluxes across membranes.
Gene expression and circadian rhy-
thms. Phytochrome can also interact
with circadian rhythms at the level of
gene expression. The expression of genes
in the
LHCB family, encoding the light-
harvesting chlorophyll
a/b–binding pro-
teins of photosystem II, is regulated at
the transcriptional level by both circa-
dian rhythms and phytochrome.
In leaves of pea and wheat, the level of
LHCB mRNA has been found to oscillate
during daily light–dark cycles, rising in
the morning and falling in the evening.
Since the rhythm persists even in contin-
uous darkness, it appears to be a circadian
rhythm. But phytochrome can perturb
this cyclical pattern of expression.
When wheat plants are transferred
from a cycle of 12 hours light and 12
hours dark to continuous darkness, the
rhythm persists for a while, but it slowly
damps out (i.e., reduces in amplitude until
no peaks or troughs are discernible). If,
however, the plants are given a pulse
of red light before they are transferred
to continuous darkness, no damping
occurs (i.e., the levels of
LHCB mRNA
continue to oscillate as they do during
the light–dark cycles).
In contrast, a far-red flash at the end of the day prevents
the expression of
LHCB in continuous darkness, and the
effect of far red is reversed by red light. Note that it is not the
oscillator that damps out under constant conditions, but the
coupling of the oscillator to the physiological event being
monitored. Red light restores the coupling between the oscil-
lator and the physiological process.
388 Chapter 17
Up
Down
Light Dark Dark DarkLight Light
12 24 12 24 24 12 2412
Time
Leaf position
Petiole
Leaflet
Leaf
(A) Open (B) Closed
Ventral
motor cells
(turgid)
Dorsal
motor cells
(flaccid)
Ventral
motor cells
(flaccid)
Dorsal
motor cells
(turgid)
Epidermis
Vascular tissue
K
+
Cl
–
K
+
Cl
–
FIGURE 17.13 Circadian rhythm in the diurnal movements of Albizia leaves.
The leaves are elevated in the morning and lowered in the evening. In parallel
with the raising and lowering of the leaves, the leaflets open and close. The
rhythm persists at a lower amplitude for a limited time in total darkness.
FIGURE 17.14 Ion fluxes between the dorsal and ventral motor cells of Albizia
pulvini
regulate leaflet opening and closing. (After Galston 1994.)
Circadian Clock Genes of Arabidopsis
Have Been Identified
The isolation of clock mutants has been an important tool
for the identification of clock genes in other organisms. Iso-
lating clock mutants in plants requires a convenient assay
that allows monitoring of the circadian rhythms of many
thousands of individual plants to detect the rare abnormal
phenotype.
To allow screening for clock mutants in
Arabidopsis, the
promoter region of the
LHCB gene was fused to the gene
that encodes luciferase, an enzyme that emits light in the
presence of its substrate, luciferin. This reporter gene con-
struct was then used to transform
Arabidopsis with the Ti
plasmid of
Agrobacterium as a vector. Investigators were
then able to monitor the temporal and spatial regulation of
bioluminescence in individual seedlings in real time using
a video camera (Millar et al. 1995).
A total of 21 independent
toc (timing of CAB [LHCB]
expression) mutants have been isolated, including both
short-period and long-period lines. The
toc1 mutant in par-
ticular has been implicated in the core oscillator mecha-
nism (Strayer et al. 2001). A model for the endogenous
oscillator will be discussed later in the chapter.
ECOLOGICAL FUNCTIONS:
PHYTOCHROME SPECIALIZATION
Phytochrome is encoded by a multigene family: PHYA
through PHYE. Despite the great similarity in their structures,
each of these phytochromes performs distinct roles in the life
of the plant. In this section we will discuss the current state
of our knowledge of the ecological functions of the different
phytochromes, focusing primarily on phyA and phyB.
Phytochrome B Mediates Responses to
Continuous Red or White Light
Phytochrome B was first suspected to play a role in
responses to continuous light because the
hy3 mutant (now
called
phyB), which has long hypocotyls under continuous
white light, was found to have an altered
PHYB gene. In
these mutants,
PHYB mRNA was reduced in amount or
was absent, and little or no phyB protein could be detected.
In contrast, the levels of
PHYA mRNA and phyA protein
were normal.
Phytochrome B mediates shade avoidance by regulating
hypocotyl length in response to red light given in low-flu-
ence pulses or continuously, and as might be expected, the
phyB mutant is unable to respond to shading by increasing
hypocotyl extension. In addition, these plants do not
extend their hypocotyls in response to far-red light given
at the end of each photoperiod (called the
end-of-day far-red
response
). Both of these responses are likely to involve per-
ception of the Pfr:Ptotal ratio and occur in the low-fluence
region of the spectrum. Although phyB is centrally
involved in the shade avoidance response, evidence sug-
gests that other phytochromes play important roles as well
(Smith and Whitelam 1997).
The
phyB mutant is deficient in chlorophyll and in some
mRNAs that encode chloroplast proteins, and it is impaired
in its ability to respond to plant hormones. Since a muta-
tion in
PHYB results in impaired perception of continuous
red light, the presence of the other phytochromes must not
be sufficient to confer responsiveness to continuous red or
white light.
Phytochrome B also appears to regulate photoreversible
seed germination, the phenomenon that originally led to
the discovery of phytochrome. Wild-type
Arabidopsis seeds
require light for germination, and the response shows
red/far-red reversibility in the low-fluence range. Mutants
that lack phyA respond normally to red light; mutants defi-
cient in phyB are unable to respond to low-fluence red light
(Shinomura et al. 1996). This experimental evidence
strongly suggests that phyB mediates photoreversible seed
germination.
Phytochrome A Is Required for the Response
to Continuous Far-Red Light
No phytochrome gene mutations other than phyB were
found in the original
hy collection, so the identification of
phyA mutants required the development of more ingenious
screens. As discussed previously, because the far-red HIRs
were known to require light-labile (Type I) phytochrome,
it was suspected that phyA must be the photoreceptor
involved in the perception of continuous far-red light. If
this is true, then the phyA mutants should fail to respond
to continuous far-red light and grow tall and spindly under
these light conditions. However, mutants lacking chro-
mophore would also look like this because phyA can detect
far-red light only when assembled with the chromophore
into holophytochrome.
To select for just the phyA mutants, the seedlings that
grew tall in continuous far-red light were then grown
under continuous red light. The phyA-deficient mutants
can grow normally under this regimen, but a chro-
mophore-deficient mutant, which also lacks functional
phyB, does not respond. The
phyA mutant seedlings
selected in this screen had no obvious phenotype when
grown in normal white light, confirming that phyA has no
discernible role in sensing white light.
This also explains why
phyA mutants were not detected
in the original long-hypocotyl screen. Thus, phyA appears
to have a limited role in photomorphogenesis, restricted
primarily to de-etiolation and far-red responses. For exam-
ple, phyA would be important when seeds germinate
under a canopy, which filters out much of the red light.
It is also clear from this constant far-red light phenotype
that none of the other phytochromes is sufficient for the
perception of constant far-red light, and despite the ability
of all phytochromes to absorb red and far-red light, at least
phyA and phyB have distinct roles in this regard.
Phytochrome and Light Control of Plant Development 389
Phytochrome A also appears to be involved in the ger-
mination VLFR of
Arabidopsis seeds. Thus, mutants lacking
phyA cannot germinate in response to red light in the very-
low-fluence range, but they show a normal response to red
light in the low-fluence range (Shinomura et al. 1996). This
result demonstrates that phyA functions as the primary
photoreceptor for this VLFR, although recent evidence sug-
gests that phyE is required for this component of seed ger-
mination (Hennig et al. 2002).
Table 17.4 summarizes the different roles of phyA, phyB,
and other photoreceptors in the various phytochrome-
mediated responses.
Developmental Roles for Phytochromes C, D, and E
Are Also Emerging
Some of the roles of other phytochromes in plant growth
and development have recently begun to be elucidated
through experiments on mutant plants. Because these phy-
tochromes have functions that overlap with those of phyA
and phyB, it was necessary to screen for mutants in
phyAB
null mutant backgrounds to uncover mutations. For exam-
ple, both phyD and phyE help mediate the shade avoid-
ance response—a response mediated primarily by phyB.
The creation of double and triple mutants has made it
possible to assess the relative role of each phytochrome in
a given response. Thus it was found that, like phyB, phyD
plays a role in regulating leaf petiole elongation, as well as
in flowering time (see Chapter 24). Similar analyses sup-
port the idea that phyE acts redundantly with phyB and
phyD in these processes, but also acts redundantly with
phyA and phyB in inhibition of internode elongation.
Of the
Arabidopsis phytochromes, phyC is the least well
characterized. However, although
phyAphyBphyDphyE
quadruple mutants appear to have normal responses to the
red:far red ratio, there are differences in phytochrome-reg-
ulated gene expression.
In summary, phyC, phyD, and phyE appear to play
roles that are for the most part redundant with those of
phyA and phyB. Whereas phyB appears to be involved in
regulating all stages of development, the functions of the
other phytochromes are restricted to specific developmen-
tal steps or responses.
Phytochrome Interactions Are Important Early in
Germination
Figure 17.15A shows the action of constant red and far-red
light absorbed separately by the phyA and phyB systems.
Continuous red light absorbed by phyB stimulates de-eti-
390 Chapter 17
TABLE 17.4
Comparison of the very-low-fluence (VLFR), low-fluence (LFR), and high-irradiance responses (HIR)
Type of Response Photoreversibility Reciprocity Peaks of action spectra
a
Photoreceptor
VLFR No Yes Red, Blue phyA, phyE
a
LFR Yes Yes Red, far red phyB, phyD, phyE
HIR No No Dark-grown: far red, blue, UV-A Dark-grown: phyA, cryptochrome
Light-grown: red Light-grown: phyB
a
phyE is required for seed germination but not for other VLFR responses mediated by phyA
Continuous
red light
Continuous
far-red light
PrB PfrB
PrA
Photo-
equilibrium
PfrA
Red
Far red
Inhibits
de-etiolation
Inhibits
de-etiolation
Stimulates
de-etiolation
Stimulates
de-etiolation
Stimulates
de-etiolation
Stimulates
de-etiolation
Far redRed
(A)
(B)
Far redRed Far redRed
Continuous illumination
phyB phyA phyB
FIGURE 17.15 Mutually antagonistic roles of phyA and
phyB. (After Quail et al. 1995.)
olation by maintaining high levels of PfrB. Continuous far-
red light absorbed by PfrB prevents this stimulation by
reducing the amount of PfrB. The stimulation of de-etiola-
tion by phyA depends on the photostationary state of phy-
tochrome (indicated in Figure 17.15A by the circular
arrows). Continuous far-red light stimulates de-etiolation
when absorbed by the phyA system; continuous red light
inhibits the response.
The effects of phyA and phyB on seedling development
in sunlight versus canopy shade (enriched in far-red light)
are shown in Figure 17.15B. In open sunlight, which is
enriched in red light compared with canopy shade, de-eti-
olation is mediated primarily by the phyB system (on the
left in the figure). A seedling emerging under canopy
shade, enriched in far-red light, initiates de-etiolation pri-
marily through the phyA system (center). Because phyA is
labile, however, the response is taken over by phyB (right).
In switching over to phyB, the stem is released from
growth inhibition (see Figure 17.15A), allowing for the
accelerated rate of stem elongation that is part of the shade
avoidance response (see
Web Topic 17.4).
For a discussion of how plants sense their neighbors
using reflected light, see
Web Essay 17.2.
PHYTOCHROME FUNCTIONAL DOMAINS
Prior to the identification of the multiple forms of phy-
tochrome, it was difficult to understand how a single pho-
toreceptor could regulate such diverse processes in the
cell. However, the discovery that phytochrome is encoded
by members of a multigene family, each with its own pat-
tern of expression, provided a more plausible alternative
explanation: Each phytochrome-mediated response is reg-
ulated by a specific phytochrome, or by interactions
between specific phytochromes
. As discussed earlier, this
hypothesis was supported by the phenotypes of mutants
deficient in either phyA or phyB.
As a corollary to this hypothesis, it was further postulated
that specific regions of the PHY proteins must be specialized
to allow them to perform their distinct functions. Molecular
biology provides the tools to answer such difficult questions.
In this section we will describe what is known about the
functional domains of the phytochrome holoprotein.
Just as mutations
reducing the amount of a particular
phytochrome have yielded information about its role,
plants genetically engineered to
overexpress a specific phy-
tochrome are also useful. First, they allow an extension of
the range of phytochrome levels testable in relation to func-
tion. Second, as we will see, a particular phytochrome
sequence can be changed and reintroduced into a normal
plant to test its phenotypic effects.
Usually plants overexpressing an introduced
PHYA or
PHYB gene have a dramatically altered phenotype. Such
transgenic plants are often dwarfed, are dark green because
of elevated chlorophyll levels, and show reduced apical
dominance. This phenotype requires elevated levels of an
intact, photoactive holoprotein because overexpression of
a mutated form of phytochrome that is unable to combine
with its chromophore has a normal phenotype. Similarly,
plants expressing only the N-terminal domain of each phy-
tochrome have a normal phenotype, even though elevated
levels of the photoactive fragment accumulate.
Although protein overexpression greatly perturbs the
normal metabolism of a cell and is therefore subject to cer-
tain artifacts, such studies of structure and function have
helped build a picture of phytochrome as a molecule hav-
ing two domains linked by a hinge: an N-terminal light-
sensing domain in which the light specificity and stability
reside, and a C-terminal domain that contains the signal-
transmitting sequences (Figure 17.16).
Phytochrome and Light Control of Plant Development 391
PEST (photodegradation)
Dimerization
site
Phytochrome A/B specificity Signal transmission
COOH
H
2
N
Chromophore
Regulatory
region
Ubiquitination
site
74 kDa
N-terminal domain
55 kDa
C-terminal domain
FIGURE 17.16 Schematic diagram of the phytochrome holoprotein, showing the
various functional domains. The chromophore-binding site and PEST sequence are
located in the N-terminal domain, which confers photosensory specificity to the
molecule—that is, whether it responds to continuous red or far-red light. The C-ter-
minal domain contains a dimerization site, a ubiquitination site, and a regulatory
region. The C-terminal domain transmits signals to proteins that act downstream of
phytochrome.
The C-terminal domain also contains the site for the for-
mation of phytochrome dimers and the site for the addition
of ubiquitin, a tag for degradation. (For a more detailed
description of experiments that helped map the functional
domains of phytochrome, see
Web Topic 17.5.)
CELLULAR AND MOLECULAR
MECHANISMS
All phytochrome-regulated changes in plants begin with
absorption of light by the pigment. After light absorption, the
molecular properties of phytochrome are altered, probably
causing the signal-transmitting sequences in the C terminus
to interact with one or more components of a signal trans-
duction pathway that ultimately bring about changes in the
growth, development, or position of an organ (see Table 17.1).
Some of the signal-transmitting motifs appear to inter-
act with multiple signal transduction pathways; others
appear to be unique to a specific pathway. Furthermore, it
is reasonable to assume that the different phytochrome pro-
teins utilize different sets of signal transduction pathways.
Molecular and biochemical techniques are helping to
unravel the early steps in phytochrome action and the sig-
nal transduction pathways that lead to physiological or
developmental responses. These responses fall into two
general categories:
1. Relatively rapid turgor responses involving ion fluxes
2. Slower, long-term processes associated with photomor-
phogenesis, involving alterations in gene expression
In this section we will examine the effects of phy-
tochrome on both membrane permeability and gene
expression, as well as the possible chain of events consti-
tuting the signal transduction pathways that bring about
these effects.
Phytochrome Regulates Membrane Potentials
and Ion Fluxes
Phytochrome can rapidly alter the properties of mem-
branes. We have already seen that low-fluence red light is
required before the dark period to induce rapid leaflet clo-
sure during nyctinasty, and that fluxes of K
+
and Cl
–
into
and out of dorsal and ventral motor cells mediate the
response. However, the rapidity of leaf closure in the dark
(lag time about 5 minutes) would seem to rule out mech-
anisms based on gene expression. Instead, rapid phy-
tochrome-induced changes in membrane permeability and
transport appear to be involved.
During phytochrome-mediated leaflet closure, the
apoplastic pH of the dorsal motor cells (the cells that swell
during leaflet closure) decreases, while the apoplastic pH of
the ventral motor cells (the cells that shrink during leaflet
closure) increases. Thus the plasma membrane H
+
pump of
the dorsal cells appears to be activated by darkness (pro-
vided that phytochrome is in the Pfr form), and the H
+
pump of the ventral cells appears to be deactivated under
the same conditions (see Figure 17.14). The reverse pattern
of apoplastic pH change is observed during leaflet opening.
Studies have also been carried out on phytochrome reg-
ulation of K
+
channels in isolated protoplasts (cells without
their cell walls) of both dorsal and ventral motor cells from
Samanea leaves (Kim et al. 1993). When the extracellular K
+
concentration was raised, K
+
entered the protoplasts and
depolarized the membrane potential only if the K
+
chan-
nels were open. When the dorsal and ventral motor cell
protoplasts were transferred to constant darkness, the state
of the K
+
channels exhibited a circadian rhythmicity dur-
ing a 21-hour incubation period, and the two cell types var-
ied reciprocally, just as they do in vivo. That is, when the
dorsal cell K
+
channels were open, the ventral cell K
+
chan-
nels were closed, and vice versa. Thus the circadian rhythm
of leaf movements has its origins in the circadian rhythm
of K
+
channel opening.
On the basis of the evidence thus far, we can conclude
that phytochrome brings about leaflet closure by regulating
the activities of the primary proton pumps and the K
+
chan-
nels of the dorsal and ventral motor cells. Although the effect
is rapid, it is not instantaneous, and it is therefore unlikely
to be due to a direct effect of phytochrome on the membrane.
Instead, phytochrome acts indirectly via one or more signal
transduction pathways, as in the case of the regulation of
gene expression by phytochrome (see the next section).
However, some effects of red and far-red light on the
membrane potential are so rapid that phytochrome may
also interact directly with the membrane. Such rapid mod-
ulation has been measured in individual cells and has been
inferred from the effects of red and far-red light on the sur-
face potential of roots and oat (
Avena) coleoptiles, where
the lag between the production of Pfr and the onset of mea-
surable potential changes is 4.5 s for hyperpolarization.
Changes in the bioelectric potential of cells imply
changes in the flux of ions across the plasma membrane
(see
Web Topic 17.6). Membrane isolation studies provide
evidence that a small portion of the total phytochrome is
tightly bound to various organellar membranes.
These findings led some workers to suggest that mem-
brane-bound phytochrome represents the physiologically
active fraction, and that all the effects of phytochrome on
gene expression are initiated by changes in membrane per-
meability. On the basis of sequence analysis, however, it is
now clear that phytochrome is a hydrophilic protein with-
out membrane-spanning domains. The current view is that
it may be associated with microtubules located directly
beneath the plasma membrane, at least in the case of the
alga,
Mougeotia, as described in Web Topic 17.2.
If phytochrome exerts its effects on membranes from
some distance, no matter how small, involvement of a
sec-
ond messenger
is implied, and calcium is a good candidate.
Rapid changes in cytosolic free calcium have been impli-
cated as second messengers in several signal transduction
392 Chapter 17
pathways, and there is evidence that calcium plays a role
in chloroplast movement in
Mougeotia.
Phytochrome Regulates Gene Expression
As the term photomorphogenesis implies, plant development
is profoundly influenced by light. Etiolation symptoms
include spindly stems, small leaves (in dicots), and the
absence of chlorophyll. Complete reversal of these symp-
toms by light involves major long-term alterations in
metabolism that can be brought about only by changes in
gene expression.
The stimulation and repression of transcription by light
can be very rapid, with lag times as short as 5 minutes.
Such early-gene expression is likely to be regulated by the
direct activation of transcription factors by one or more
phytochrome-initiated signal transduction pathways. The
activated transcription factors then enter the nucleus,
where they stimulate the transcription of specific genes.
Some of these early gene products are transcription fac-
tors themselves, which activate the expression of other
genes. Expression of the early genes, also called
primary
response genes
, is independent of protein synthesis;
expression of the late genes, or
secondary response genes,
requires the synthesis of new proteins.
The photoregulation of gene expression has focused on
the nuclear genes that encode messages for chloroplast pro-
teins: the small subunit of ribulose-1,6-bisphosphate car-
boxylase/oxygenase (rubisco) and the major light-harvest-
ing chlorophyll
a/b–binding proteins associated with the
light-harvesting complex of photosystem II (LHCIIb pro-
teins). These proteins play important roles in chloroplast
development and greening; hence their regulation by phy-
tochrome has been studied in detail. The genes for both of
these proteins—
RBCS and LHCB (also called CAB in some
studies)—are present in multiple copies in the genome.
We can demonstrate phytochrome regulation of mRNA
abundance (e.g.,
RBCS mRNAs) experimentally by giving
etiolated plants a brief pulse of low-fluence red or far-red
light, returning them to darkness to allow the signal trans-
duction pathway to operate, and then measuring the abun-
dance of specific mRNAs in total RNA prepared from each
set of plants. If its abundance is regulated by phytochrome,
the mRNA is absent or present at low levels in etiolated
plants but is increased by red light. The red light–induced
increase in expression can be reversed by immediate treat-
ment with far-red light, but far-red light alone has little
effect on mRNA abundance. The expression of some other
genes is down-regulated under these conditions.
Recently red-light stimulation of lettuce seed germina-
tion has been correlated with an increase in the biologi-
cally active form of the hormone gibberellin. Red light
causes a large increase in the expression of the gene cod-
ing for a key enzyme in the gibberellin biosynthetic path-
way (Toyomasu et al. 1998). The effect of red light is
reversed by a treatment with far-red light, indicative of
phytochrome. Since gibberellin can substitute for red light
in promoting lettuce seed germination, it appears that
phytochrome promotes seed germination by increasing
the biosynthesis of the hormone. Gibberellins are dis-
cussed in detail in Chapter 20.
For an expanded discussion see
Web Topic 17.7.
Both Phytochrome and the Circadian Rhythm
Regulate
LHCB
A MYB-related transcription factor whose mRNA level
increases rapidly when
Arabidopsis is transferred from the
dark to the light is involved in phytochrome-mediated
expression of
LHCB genes (Figure 17.17). (For information
on MYB, see Chapter 14 on the web site.)
This transcription factor appears to bind to the promoter
of certain
LHCB genes and regulate their transcription,
which, as Figure 17.17 shows, occurs later than the increase
in the MYB-related protein (Wang et al. 1997). The gene
that encodes the MYB-related protein is therefore probably
a primary response gene, and the
LHCB gene itself is prob-
ably a secondary response gene.
Recent work has indicated that this MYB-related pro-
tein, now known as
circadian clock associated 1 (CCA1),
also plays a role in the circadian regulation of
LHCB gene
expression. A second but distinct MYB-related protein,
late
elongated
hypocotyl (LHY), has also been identified as a
potential clock gene. Expression of
CCA1 and LHY oscil-
lates with a circadian rhythm. Constitutive expression of
CCA1 abolishes several circadian rhythms and suppresses
both
CCA1 and LHY expression. When the CCA1 gene is
mutated so that no functional protein is produced, circa-
dian and phytochrome regulation of four genes, including
LHCB, is affected. These observations suggest that CCA1
and LHY are associated with the circadian clock.
Phytochrome and Light Control of Plant Development 393
0.02
0.01
2
1
024681012
Time in light (hours)
MYB-related protein mRNA
LHCB mRNA
MYB
LHCB
FIGURE 17.17 Time course for inducing transcription.
Kinetics of the induction of transcripts for a MYB-related
transcription factor (MYB) and the light-harvesting chloro-
phyll
a/b–binding protein (LHCB) in Arabidopsis after trans-
fer of the seedlings from darkness to continuous white
light. (After Wang et al. 1997.)
A protein kinase (CK2) can interact with and phospho-
rylate CCA1. The CK2 kinase is a multisubunit protein
with serine/threonine kinase activity. The regulatory sub-
unit of CK2 (CKB3) has been shown to interact with, and
phosphorylate, CCA1 in vitro. Mutations in CKB3 have
also been found to perturb CK2 activity and, in turn,
change the period of rhythmic expression of CCA1. These
mutations affect many clock outputs, from gene expression
to flowering time, suggesting that CK2 is involved in the
regulation of the circadian clock via its interactions with
CCA1 (Sugano et al. 1999).
The Circadian Oscillator Involves a Transcriptional
Negative Feedback Loop
The circadian oscillators of cyanobacteria (Synechococcus),
fungi (
Neurospora crassa), insects (Drosophila melanogaster),
and mouse (
Mus musculus) have now been elucidated. In
these four organisms, the oscillator is composed of several
“clock genes” involved in a transcriptional–translational
negative feedback loop.
So far, three major clock genes have been identified in
Arabidopsis: TOC1, LHY, and CCA1. The protein products
of these genes are all regulatory proteins.
TOC1 is not
related to the clock genes of other organisms, suggesting
that the plant oscillator is unique.
According to a recent model (Alabadi et al. 2001), light
and the TOC1 regulatory protein activate
LHY and CCA1
expression at dawn (Figure 17.18). The increase in LHY and
CCA1 represses the expression of the
TOC1 gene. Because
TOC1 is a positive regulator of the
LHY and CCA1 genes,
the repression of
TOC1 expression causes a progressive
reduction in the levels of LHY and CCA1, which reach
their minimum levels at the end of the day. As LHY and
CCA1 levels decline,
TOC1 gene expression is released
from inhibition. TOC1 reaches its maximum at the end of
the day, when LHY and CCA1 are at their minimum. TOC1
then either directly or indirectly stimulates the expression
of
LHY and CCA1, and the cycle begins again.
The two MYB regulator proteins—LHY and CCA1—
have dual functions. In addition to serving as components
of the oscillator, they regulate the expression of other genes,
such as
LHCB and other “morning genes,” and they repress
genes expressed at night. Light acts to reinforce the effect
of the
TOC1 gene in promoting LHY and CCA1 expression.
This reinforcement represents the underlying mechanism
of
entrainment. Other proteins, such as the CK2 kinase,
affect the activity of CCA1, and thus regulate the clock.
Phytochrome and the blue-light photoreceptor CRY2 (see
Chapter 18) mediate the effects of red and blue light,
respectively.
Regulatory Sequences Control Light-Regulated
Transcription
The cis-acting regulatory sequences required to confer
light regulation of gene expression have been studied
extensively. Most eukaryotic promoters for genes that
encode proteins comprise two functionally distinct
regions: a short sequence that determines the transcription
start site (the
TATA box, named for its most abundant
nucleotides) and upstream sequences, called
cis-acting
regulatory elements
, that regulate the amount and pattern
of transcription (see Chapter 14 on the web site). These
regulatory sequences bind specific proteins, called
trans-
acting factors
, that modulate the activity of the general
394 Chapter 17
LHY
CCA1
LHY
CCA1
TOC1 and other
evening genes
TOC1
LHCB and other
morning genes
Light
Night
Day
1. Light activates LHY and
CCA1 expression at dawn.
5. TOC1 augments the expression
of LHY and CCA1, which reach
maximum levels at dawn, starting
the cycle again.
2. LHY and CCA1 activate
the expression of LHCB
and other morning genes.
3. CCA1 and LHY repress
TOC1 and other evening
genes.
4. Progressive reduction of
LHY and CCA1 expression
levels during the day allows
TOC1 transcript levels to rise
and reach maximum levels
toward the end of the day.
FIGURE 17.18 Circadian oscillator model showing the hypothetical interactions
between the
TOC1 and MYB genes LHY and CCA1. Light acts at dawn to increase
LHY and CCA1 expression. LHY and CCA1 act to regulate other daytime and
evening genes.
transcription factors that assemble around the transcrip-
tion start site with RNA polymerase II.
Overall, the picture emerging for light-regulated plant
promoters is similar to that for other eukaryotic genes: a
collection of modular elements, the number, position,
flanking sequences, and binding activities of which can
lead to a wide range of transcriptional patterns. No single
DNA sequence or binding protein is common to all phy-
tochrome-regulated genes.
At first it may appear paradoxical that light-regulated
genes have such a range of elements, any combination of
which can confer light-regulated expression. However, this
array of sequences allows for the differential light- and tis-
sue-specific regulation of many genes through the action
of multiple photoreceptors. (For an expanded discussion,
see
Web Topic 17.8.)
Regulatory factors. As might be expected, the diverse
range of phytochrome regulatory sequences can bind a
wide variety of transcription factors. At least 50 of these
regulatory factors have been identified recently by the use
of genetic and molecular screens (Tepperman et al. 2001).
Although some of the early-acting signaling pathways
are specific to phyA or phyB, it is clear that late-acting sig-
naling pathways common to multiple photoreceptors must
be used because different light qualities can trigger the
same response (Chory and Wu 2001).
For example, SPA1 is a phyA-specific signaling inter-
mediate that acts as a light-dependent repressor of photo-
morphogenesis in
Arabidopsis seedlings (Hoecker and Quail
2001). The SPA1 protein has a coiled-coil protein domain
that enables it to interact with another factor, COP1 (
con-
stitutive
photomorphogenesis 1), that acts downstream of
both phyA and phyB. The COP1 protein was identified in
the screen for constitutive photomorphogenesis mutants
that has yielded several other factors that act downstream
of photoreceptors (see
Web Topic 17.9). COP1 is an E3
ubiquitin ligase that targets other proteins for destruction
by the 26S proteasome (see Chapter 14 on the web site).
The functions of many of these factors are probably
modulated through the action of HY5, a protein first iden-
tified through the long-hypocotyl screen, discussed earlier
in the chapter. HY5 is a basic leucine zipper–type tran-
scription factor that is always located in the nucleus (see
Chapter 14 on the web site). HY5 binds to the G-box motif
of multiple light-inducible promoters and is necessary for
optimal expression of the corresponding genes. In the dark,
HY5 is ubiquitinated by COP1 and degraded by the 26S
proteasome complex.
Phytochrome Moves to the Nucleus
It has long been a mystery as to how phytochrome could
act in the nucleus when it is apparently localized in the
cytosol. Recent exciting work has finally opened up the
black box between phytochrome and gene expression. The
most surprising finding is that in some cases phytochrome
itself moves to the nucleus in a light-dependent manner.
Detection of this movement relied on the ability to fuse
phytochrome to a visible marker,
green fluorescent pro-
tein
(GFP), that can be activated by light of an appropriate
wavelength being shone on plant cells. A big advantage of
GFP fusions is that they can be visualized in living cells,
making it possible to follow dynamic processes within the
cell under the microscope.
Both phyA–GFP and phyB–GFP show light-activated
import into the nucleus (Figure 17.19) (Sakamoto and
Nagatani 1996; Sharma 2001). The phyB fusion moves to the
nucleus in the Pfr form only, and transport is slow, taking
several hours for full mobilization. In contrast, phyA–GFP
can move in the Pfr or the Pr form, provided that it has cycled
through Pfr first. Movement of phyA–GFP is much more
rapid than that of phyB–GFP, taking only about 15 minutes.
Phytochrome and Light Control of Plant Development 395
FIGURE 17.19 Nuclear localization
of phy–GFP fusion proteins in epi-
dermal cells of
Arabidopsis
hypocotyls. Transgenic Arabidopsis
expressing phyA–GFP (left) or
phyB–GFP (right) was observed
under a fluorescence microscope.
Only nuclei are visible. The plants
were placed either under continu-
ous far-red light (left) or white
light (right) to induce the nuclear
accumulation. The smaller bright
green dots inside the nucleus are
called “speckles.” The significance
of speckles is unknown. (From
Yamaguchi et al. 1999, courtesy of
A. Nagatani).
(A)
(B)
10 µm
Most satisfying is the observation that phyB–GFP trans-
port is promoted by red light and inhibited by far-red light,
while transport of phyA–GFP is maximal under continu-
ous far-red light. Furthermore, nuclear translocation of
phyB is under circadian control, as would be expected,
since phyB regulates the expression of clock-regulated
genes. These light conditions are the ones known to be
responsible for activation of phyA and phyB and would be
consistent with their activity in the nucleus.
What happens when Pfr moves to the nucleus? Two
nuclear proteins that interact with phytochrome have been
identified to date, although there are probably additional
targets. The first,
phytochrome interacting factor 3 (PIF3),
reacts with the C-terminal end of phyA or phyB. However,
it reacts preferentially with the full-length phyB protein in
a light-dependent manner, and it is thought to be a func-
tional primary reaction partner for this phytochrome.
Although its precise function is not yet known, PIF3
resembles transcription factors that bind to a particular ele-
ment in plant promoters, the G-box motif, that confers light
regulation to genes. It is also known that phyB in the Pfr
form can form a complex with PIF3 bound to its target
DNA. A picture is therefore emerging in which some phy-
tochrome-regulated genes are activated directly by move-
ment of phyB to the nucleus in the Pfr form. Once in the
nucleus, phyB interacts with transcription factors such as
PIF3. A model for the direct activation of gene expression
by phyB in the nucleus is shown in Figure 17.20.
Phytochome Acts through Multiple Signal
Transduction Pathways
Using biochemical approaches, researchers have shown
that signaling involves several different mechanisms,
including G-proteins, Ca
2+
, and phosphorylation. We will
consider the evidence for each of these in turn.
G-proteins and calcium. Well-characterized signaling
pathways in other systems (e.g., mating in yeasts) often
include
G-proteins (which are reviewed in Chapter 14 on
the web site). These protein complexes are normally mem-
brane associated, have three different subunits, and bind
GTP or GDP on one subunit. The hydrolysis of GTP to
GDP is required for regulation of G-protein function.
Sequences that encode G-protein subunits have been
cloned from plants, indicating that this type of system is
present. One way that the function of G-proteins can be
tested is to treat cells with chemicals that activate or inhibit
the ability of the complex to bind or break down GTP.
396 Chapter 17
PrB
PfrB
PfrB
PIC
PIC
PfrB
Red
light
Far-red
light
DNA
PIF 3 PIF 3
G-BOX TATA MYB
PIF 3 PIF 3
G-BOX TATA MYB
TATA LHCB
MYB
MYB
Nucleus
Cytoplasm
1. PhyB is
synthesized in
the cytoplasm in
the inactive PrB
form.
2. When
converted to the
active PfrB form
by red light, it
moves into the
nucleus.
3. PfrB binds to
a dimer of the
transcription
factor, PIF3,
which is bound
to the G-BOX
elements of
MYB gene
promoter.
4. Upon
addition of the
pre-initiation
complex (PIC),
the transcription
of MYB genes,
including CCA1
and LHY, is
activated.
5. MYB transcription factors in turn
activate the transcription of other
genes, such as LHCB.
FIGURE 17.20 Direct regulation of gene expression by phyB
transport to the nucleus. (After Quail 2000.)
Microinjection experiments (see Web Topic 17.10) indi-
cate that phytochrome signaling can occur in single cells
and does not require light after activation of phytochrome.
At least one G-protein may function downstream of phy-
tochrome. After the G-protein step, there are at least two
branching pathways. One of these pathways—gene
expression and chloroplast development—requires Ca
2+
and calmodulin; the other—anthocyanin synthesis—is
Ca
2+
independent.
The branching pathways can be distinguished further
by the
cis-acting regulatory elements targeted and the sig-
naling intermediate employed. For many years, it has been
known that both cyclic AMP (cAMP) and cyclic GMP
(cGMP) are important intermediates in hormone- and light-
Phytochrome and Light Control of Plant Development 397
ATP
P
P
P
P
Chromophore
Phytochrome
Red light
Chromophore
Chromophore
Red light
Ser Kinase domain
H
2
N
H
2
N
COOH
Chromophore
Ser Kinase domain
XX
COOH
(A) Bacterial phytochrome
(B) Plant phytochrome
1. Phytochrome is
autophosphorylated
on serine.
ATP
Input Transmitter His
2. Phytochrome may
phosphorylate other
proteins.
Sensor protein
Response regulator protein
Input Transmitter
Receiver
His
Asp
Output
Receiver
Asp
Output
Output
signal
1. After receiving a signal from the input
domain, the transmitter domain of the
sensor protein autophosphorylates a
histidine.
2. The phosphorylated sensor protein
phosphorylates the response regulator
protein at an aspartate.
3. The phosphorylated
response regulator
stimulates the response.
FIGURE 17.21 Phytochrome is an autophospho-
rylating protein kinase. (A) Bacterial phy-
tochrome is an example of a two-component
signaling system, in which phytochrome func-
tions as a sensor protein that phosphorylates a
response regulator (see Chapter 14 on the web
site). (B) Plant phytochrome is an autophospho-
rylating serine/threonine kinase that may phos-
phorylate other proteins (X).
induced signaling pathways in animals (see Chapter 14 on
the web site). Although the presence of cAMP has been dif-
ficult to demonstrate in plants, the presence of cGMP in
plant tissues is well established. Indeed, recent studies have
shown that cGMP may serve as a second messenger in
phytochrome action.
However, the role of the G-protein cascade in plants is
still controversial. Some key genes (e.g., guanylylate
cyclase) have not yet been identified in plant genomes,
and cGMP levels are vanishingly small in plants. On the
other hand, studies with inhibitors have implicated cGMP
as a second messenger for the hormones gibberellin (see
Chapter 20) and abscisic acid (see Chapter 23). Thus a role
for cGMP in phytochrome signaling, although controver-
sial, remains a possibility.
Phosphorylation. The evidence for a potential role of
phosphorylation in phytochrome action first came from
red-light regulation of protein phosphorylation and phos-
phorylation-dependent binding of transcription factors to
the promoters of phytochrome-regulated genes. Some
highly purified preparations of phytochrome were also
reported to have kinase activity.
Kinases are enzymes that have the capacity to transfer
phosphate groups from ATP to amino acids such as serine
or tyrosine, either on themselves or on other proteins.
Kinases are often found in signal transduction pathways
in which the addition or removal of phosphate groups reg-
ulates enzyme activity.
Phytochrome is now known to be a protein kinase. The
evolutionary origin of phytochrome is very ancient, pre-
dating the appearance of eukaryotes. Bacterial phy-
tochromes are light-dependent histidine kinases that func-
tion as
sensor proteins that phosphorylate corresponding
response regulator proteins (Figure 17.21A). (See also
Chapter 14 on the web site and
Web Topic 17.11)
However, although higher-plant phytochromes have
some homology with the kinase domains, they do not
function as histidine kinases. Instead, they are serine/thre-
onine kinases. In addition, recombinant versions of higher-
plant and algal phytochromes have been shown to be
light- and chromophore-modulated kinases that can phos-
phorylate themselves, as well as other proteins (Figure
17.21B) (Sharma 2001).
At least one potential target is a cytosolic protein
termed
phytochrome kinase substrate 1, or PKS1, that
can accept a phosphate from phyA. Phosphorylation
occurs on serines, and to a lesser extent on threonines.
The PKS1 phosphorylation is regulated by phytochrome
both in the test tube and in the plant, with Pfr having a
twofold higher level of activity than Pr. Overexpression
of PKS1 in transgenic plants suggests that it may function
to negatively regulate phyB-mediated events (Fankhauser
et al. 1999).
Another protein kinase associated with phytochrome is
nucleoside diphosphate kinase 2 (NDPK2). Phytochrome
A has been found to interact with this protein, and its
kinase activity is increased about twofold when phyA is
bound in the Pfr form. Because the NDPK2 protein is
found in both the nucleus and the cytosol, the location of
its primary site of action is unclear.
A summary of the possible signaling and regulatory
pathways of phytochrome is shown in Figure 17.22.
Phytochrome Action Can Be Modulated by the
Action of Other Photoreceptors
The recent isolation of the genes encoding the cryp-
tochrome and phototropin photoreceptors (see Chapter 18)
mediating blue light–regulated responses has made it pos-
sible to analyze whether these photoreceptors have over-
lapping functions (Chory and Wu 2001). This possibility
was suspected because mutations in the cryptochrome
CRY2 gene led to delayed flowering under continuous
white light, and flowering time was also known to be
under phytochrome control.
In
Arabidopsis, continuous blue or far-red light treatment
leads to promotion of flowering, and red light inhibits
flowering. Far-red light acts through phyA, and the antag-
onistic effect of red light is through the action of phyB. One
might expect the
cry2 mutant to be delayed in flowering,
since blue light promotes flowering. However,
cry2
mutants flower at the same time as the wild type under
either continuous blue or continuous red light. Delay is
observed only if both blue and red light are given together.
Therefore, cry2 probably functions to promote flowering in
blue light by repressing phyB function.
Additional experiments have confirmed that the other
cryptochrome, cry1, also interacts with phytochromes. Both
cry1 and cry2 interact with phyA in vitro and can be phos-
phorylated in a phyA-dependent manner. Phosphorylation
of cry1 has also been demonstrated to occur in vivo in a red
light–dependent manner. Indeed, the importance of cryp-
tochromes as developmental regulators has been under-
scored by their subsequent discovery in animal systems,
such as mouse and human.
SUMMARY
The term photomorphogenesis refers to the dramatic effects
of light on plant development and cellular metabolism.
Red light exerts the strongest influence, and the effects of
red light are often reversible by far-red light.
Phytochrome is the pigment involved in most photo-
morphogenic phenomena. Phytochrome exists in two
forms: a red light–absorbing form (Pr) and a far-red
light–absorbing form (Pfr). Phytochrome is synthesized in
the dark in the Pr form. Absorption of red light by Pr con-
verts it to Pfr, and absorption of far-red light by Pfr con-
398 Chapter 17
Phytochrome and Light Control of Plant Development 399
ATP
PfrB
PrB
Red
light
Far red
light
PrA
PSK1
Dark
Dark
Dark
Light
Light
Light
Light
Light
Light
PSK1
COP1
SPA1
COP1
PfrA
Red
light
Far red
light
PIF 3
NUCLEUS
CYTOPLASM
PfrA
P
PfrA
HY5
P
P
P
G-
protein
PfrB
NDPK2
NDPK2
P
PfrB
ATP
cGMP
Ca
2+
CAM
Y
X
HY5
degradation
COP/DET/FUS
proteasome
Light-regulated
gene expression
1
2
2
1
1 Red light converts PrA and PrB to their Pfr forms.
2 The Pfr forms of phyA and phyB phytochrome can autophosphorylate.
3 Activated PfrA phosphorylates phytochrome kinase substrate 1 (PKS1).
4 Activated PfrA and PfrB may interact with G-proteins.
5 cGMP, calmodulin (CAM), and calcium (Ca
2+
) may activate transcription factors (X and Y).
6 Activated PfrA and PfrB enter the nucleus.
7 PfrA and PfrB may regulate transcription directly or through interaction with phytochrome
interacting factor 3 (PIF3).
8 Nucleoside diphosphate kinase 2 (NDPK2) is activated by PfrB.
9 In the dark, COP1 enters the nucleus and suppresses light-regulated genes.
10 In the dark, COP1, an E3 ligase, ubiquitinates HY5.
11 In the dark, HY5 is degraded with the assistance of the COP/DET/FUS proteasome complex.
12 In the light, COP1 interacts directly with SPA1 and is exported to the cytoplasm.
3
4
4
5
6
12
10
11
8
7
6
9
12
7
FIGURE 17.22 Summary diagram of the known factors involved in phytochrome-
regulated gene expression. It is likely that additional shared and phytochrome-spe-
cific pathways will be uncovered as more signaling intermediates are identified.
(After Sharma 2001.)