Preparative isolation and purification of six volatile compounds from essential oil of Curcuma wenyujin using high-performance centrifugal partition chromatography doc
Bạn đang xem bản rút gọn của tài liệu. Xem và tải ngay bản đầy đủ của tài liệu tại đây (204.62 KB, 7 trang )
Research Article
Preparative isolation and purification of six
volatile compounds from essential oil of
Curcuma wenyujin using high-performance
centrifugal partition chromatography
Six volatile compounds, curdione (1), curcumol (2), germacrone (3), curzerene (4), 1,8-
cineole (5) and b-elemene (6), were successfully isolated from the essential oil of Curcuma
wenyujin by high-performance centrifugal partition chromatography using a nonaqueous
two-phase solvent system consisting of petroleum ether-acetonitrile-acetone (4:3:1 v/v/v).
A total of 8 mg of curdione (1), 4 mg of curcumol (2), 10 mg of germacrone (3), 18 mg of
curzerene (4), 9 mg of 1,8-cineole (5) and 17 mg of b-elemene (6) were isolated from the
essential oil (300 mg) in 500 min. Their structures were determined by comparison of
their retention times and MS data with those of the authentic samples as well as NMR
spectroscopic analysis.
Keywords: Curcuma w enyujin / High-performance centrifugal partition chromato-
graphy / Preparative separation / Volatile components
DOI 10.1002/jssc.200900453
1 Introduction
Essential oils (also called volatile oils) generally extracted by
distillation from plants are hydrophobic liquids containing
volatile aromatic compounds. The essential oils are widely
used in perfumes, c osmetics as well as in food and drink as
flavor additives. Some essential oils show multiple pharmaco-
logical activities and have been considered as th e major active
fractions of herbal medicines [1–3]. Preparative separation of
the v olatile components is very important not only f or the
quality control of the crude herbsandtheproductscontaining
the esse ntial oil but also for the bi o-evaluat ion. However,
preparative separation of these pu re vola tile components is a
challenge because of their structural similarity, strongly
hydrophobic properties a nd poor stability. Column chromato-
graphy over silica gel is broadly used to separate the volatile
components, which is time-consuming and a rduous work. I n
most cases, the major components in essential oils cannot b e
retained on silica gel even using hexane or heptane as mobile
phase. Poor solubility in aqueous solvents prevents them from
being separated in large s cale over the reverse stationary phase.
GC is the conventional method for analysis of the essential
components usually c oupled with a mass s pectrometer.
Preparative GC (Prep-GC) has been successfully used in the
separation of the volatile components nowadays [4–6].
However, t hermolabile volatile c omponents could decompose
during separation by Prep-GC. Samples injected into Prep-GC
mustbefullyvaporizedontocolumntoensureradial
distribution of the sample across the column. The compounds
of interest are eluted out at very dilute concentrations fro m the
column;therefore,itisverydifficulttoextractorcondense
those compounds from the gas stream. Efficient parking of
large GC columns is also difficult. A ll these e co nomic and
technical difficulties limit wide use of Prep-GC in chemical
separation([4],Scott,R.P.W.,Chrom-Ed Book Series- GC
Chromatography, ).
Counter-current chromatography (CCC) including high-
speed CCC (HSCCC) a nd high-performance centrifugal
partition chromatography (HPCPC) is a liquid–liquid partition
chromatographic t echnique based on partition of compounds
between two immiscible liquid phases. T his method p rovides
an advantage over the conventional column chromatography
by eliminating the use of a solid support, which may result in
irreversible adsorption [7, 8]. HSCCC and HPCPC have
increasingly been used to isolate and purify a multitude of
natural p roducts [ 7–10]. But only a few researches have been
reported in the separation of one or two volatile components
from essential oils w ith this technique [11–15].
Eighty-four herbal drugs including Rhizoma Curcumae
(Ezhu) are among 472 Chinese herbal materials recorded in
China Pharmacopoeia (2005). Their therapeutic effects have
been attributed to essential oils [16, 17]. The rhizomes of
Yuan-Ye Dang
Xiao-Cen Li
Qing-Wen Zhang
Shao-Ping Li
Yi-Tao Wang
Institute of Chinese Medical
Sciences, University of Macau,
Taipa, Macau SAR, P. R. China
Received June 29, 2009
Revised January 20, 2010
Accepted February 23, 2010
Abbreviations: CCC, counter-current chromatography;
HPCPC, high-performance centrifugal partition chromato-
graphy; HSCCC, high-speed CCC; Prep-GC, preparative GC
Correspondence: Dr. Qing-Wen Zhang, Institute of Chinese
Medical Sciences, University of Macau, Taipa, Macau SAR,
P. R. China
E-mail:
Fax: 1853-2884-1358
& 2010 WILEY-VCH Verlag GmbH & Co. KGaA, Weinheim www.jss-journal.com
J. Sep. Sci. 2010, 33, 1658–1664
1658
three species of Curcuma including C. wenyujin, C. phaeo-
caulis and C. kwangsiensis are used as Ezhu, which displays
wide and diverse medicinal value [16]. The essential oil of C.
wenyujin is considered as an effective part of Rhizoma
Curcumae, which is reported to possess anti-tumor [18, 19]
and anti-viral activities [20, 21]. Several components
including b-elemene, curcumol, germacrone and curdione
have been reported to be the biologically active ingredients
in the essential oil [22, 23]. Germacrone and curdione were
isolated and purified using two-phase solvent system
composed of petroleum ether/ethanol/diethyl ether/water
(5:4:0.5:1 v/v/v/v) by HSCCC by Yan et al. [15]. The ther-
mally labile compounds in ezhu oil, germacrone, curdione,
furanodienone and furanodiene, were found to degrade to
b-elemenone, curcumol, curzerenone and curzerene,
respectively, under heat while zurzerene was transformed
into callitrin and callitrisin in aqueous media in previous
studies [24–26]. Therefore, it is preferable to use a non-
aqueous solvent system at low temperature to separate those
unstable volatile components. An HPCPC method using a
nonaqueous two-phase solvent system was successfully
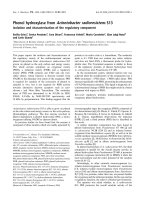
developed for the separation of six components including
curdione (1), curcumol (2), germacrone (3), curzerene (4),
1,8-cineole (5) and b-elemene (6) (Fig. 1) from the essential
oil of C. wenyujin. GC-MS analysis showed that the six
isolated compounds except curcumol (2) were the major
components in the essential oil of C. wenyujin.
2 Materials and methods
2.1 Apparatus
The separation was performed on an SIC CPC240 HPCPC
(Ever Seiko Corporation, Tokyo, Japan) at room tempera-
ture. Total rotor volume of this model is 240 mL and total
number of cells is 3136 in which cell length is 15 mm and
the distance to the cell center is 82.5 mm. Descending and
ascending modes can be interconverted by a four-way
switching valve. The rotation speed is up to 2000 rpm
(increase and decrease by 100 steps). The two-phase solvent
system was pumped with a Syknm S 1021 pump using a
dual piston solvent delivery system (Syknm, Germany),
equipped with HPCPC to pump. Maximum sample
injection volume was 5 mL and the flow rate of the pump
was set between 0 and 30 mL/min. Maximum pressure of
the HPCPC equipment is 6.0 MPa. An ultra-violet multiple
wavelength detector of Agilent Technologies 1200 series
(Agilent Technologies, USA) performed the preliminary
analysis and detection for all the effluent from CPC240
constantly. The chromatogram was recorded with Agilent
ChemStation. Fractions were collected by a CF-1 fraction
collector (Spectrum, USA).
GC-MS analysis was performed with an Agilent 6890
gas chromatography instrument coupled to an Agilent 5973
mass spectrometer and an Agilent ChemStation software
(Agilent Technologies).
2.2 Reagents and materials
All organic solvents used for HPCPC were of analytical or
chromatographic grade. Petroleum ether (b.p. 60–901C) of
analytical grade was purchased from Uni-Chem (Guang-
zhou, China). Acetonitrile and acetone of chromatographic
grade were purchased from Merck (Darmstadt, Germany).
The essential oil of Curcuma wenyujin was purchased from
Zhejiang Ruian Pharmaceutical (Ruian, China). The refer-
ence compounds of curdione (1), curcumol (2), germacrone
(3), curzerene (4) and b-elemene (6) were previously isolated
from the above commercial oil [25].
2.3 Preparation of two-phase solvent system and
sample solutions
The two-phase solvent systems were selected
mainly according to the partition coefficient K of the target
compounds. The K values were determined by
GC-MS analysis as follows: One drop (about 5 mg) of the
essential oil was added to the mixture of equal volume of the
upper phase and the lower phase of the two-phase solvent
system. The solutions were then mixed thoroughly by
shaking. The upper phase and the lower phase were
analyzed by GC-MS, respectively, after equilibration was
established.
O
O
O
OH
O
O
O
21
43
5
6
Figure 1. Chemical structures of curdione (1), curcumol (2),
germacrone (3), curzerene (4), 1,8-cineole (5), b-elemene (6).
J. Sep. Sci. 2010, 33, 1658–1664
Sample Preparation 1659
& 2010 WILEY-VCH Verlag GmbH & Co. KGaA, Weinheim www.jss-journal.com
A two-phase solvent system composed of petroleum
ether/acetonitrile/acetone (4:3:1 v/v/v) was selected for the
HPCPC separation after a partition experiment of the
essential oil in a series of solvent systems (Table 1) by GC-
MS analysis. The solvent mixture was equilibrated comple-
tely in a separatory funnel at room temperature. Both of the
upper and the lower phases were degassed for 30 min by
ultrasonication before use.
Aliquots of 300 mg of the essential oil were diluted by
2.4 mL of the mixed solution of lower phase and upper
phase (1:1 v/v) of the optimized solvent system used for
HPCPC separation.
2.4 HPCPC separation procedure
The upper phase of the two-phase solvent system was
performed as the stationary phase and the lower phase as
the mobile phase in the present HPCPC separation. The
upper stationary phase was first pumped into HPCPC at a
flow-rate of 5.0 mL/min and the apparatus was run at
300 rpm under ascending separation mode. After about
50 min when the column was fully filled with stationary
phase, the lower mobile phase was pumped into HPCPC at
a flow rate of 1.5 mL/min and the rotation speed was set at
1700 rpm under descending separation mode. The sample
was injected through the sample loop after hydrodynamic
equilibrium was reached, as indicated by a clear mobile
phase eluting at the outlet. The HPCPC separation was
running for 600 min and effluent from the outlet of HPCPC
was continuously monitored by an ultra-violet multiple
wavelength detector at UV 210 nm. Per 3 mL fractions of
effluent were collected and analyzed by GC-MS. The
fractions were pooled according to GC-MS results and
evaporated at 401C under reduced pressure to avoid thermal
degrading. At the end of the separation, all the upper
stationary phase was collected to calculate the retention of
the stationary phase.
2.5 GC-MS analysis
GC-MS was performed on a capillary column (30 m  0.25
mm, id) coated with 0.25 mm film 5% phenyl methyl
siloxane was used for the separation. The carrier gas was
high-purity helium and its flow rate was at 1.0 mL/min. The
optimized GC-MS conditions were as follows: the column
temperature was set at 601C for injection, then programmed
at 51C/min to 1201C and held for 13 min, then at 251C/min
to 1451C and held for 20 min, finally, at 301C/min to 2801C.
Split injection (2 mL) was conducted with a split ratio of 10:1.
The mass spectrometer was set in electron-impact (EI)
mode in which the scan range was between 40 and 550 amu,
the ionization energy was 70 eV and the scan rate was 0.34 s
per scan. The inlet, ionization source temperatures were 250
and 2801C [27].
3 Results and discussions
The selection of the two-phase solvent system is the first and
critical step for an HPCPC or an HSCCC separation.
Successful separation by HSCCC or HPCPC depends on the
suitable selection of a two-phase solvent system, which
should have good solubility and stability for target
compounds, an ideal partition coefficient (K), short settling
time (o30 s) and satisfactory stationary phase retention
(>50%) [9, 28].
Partition coefficient is a very important parameter for
solvent system selection. A compound with a small K value
may come out with the solvent front and result in a loss of
peak resolution while a large K value produces excessive
running time and band broadening. Ideally, the partition
coefficient K has to be close to 1, usually in a range of 0.5–2
[8, 9]. However, all partition coefficients are difficult to
maintain in the range of 0.5–2 when separating more than
four compounds in a one-step HSCCC or HPCPC run. In
practice, a K value between 0.2 and 5 can be used without
the excessive elution time associated with band broadening
[7, 29].
In this study, K 5 A
up
(peak area of compound in upper
phase)/A
low
(peak area of compound in lower phase).
Previous study indicated some components degraded in
aqueous solution [26]. Hence, the non-aqueous solvent
system was given priority in the selection of solvent system.
Eight kinds of two-phase nonaqueous solvent systems were
studied, such as petroleum ether/acetonitrile/acetone (2:1:1,
5:3:2, 4:3:1 and 7:6:1 v/v/v) and n-heptane/acetonitrile/ethyl
acetate (7:6:1, 4:3:1, 5:3:2 and 2:1:1 v/v/v). With the GC-MS
results and the calculation of K 5 A
up
/A
low
, the different
K values of curdione (1), curcumol (2), germacrone (3),
Table 1. The partition coefficient values of curdione (K
1
),
curcumol (K
2
), germacrone (K
3
), curzerene (K
4
), 1,8-
cineole (K
5
) and b-elemene (K
6
) in eight kinds of
solvent systems
No. Solvent systems (v/v) K
1
K
2
K
3
K
4
K
5
K
6
1 Petroleum ether/acetonitrile/
acetone (2:1:1)
0.36 0.58 0.92 2.25 2.01 6.03
2 Petroleum ether/acetonitrile/
acetone (5:3:2)
0.39 0.60 0.77 1.49 1.66 3.27
3 Petroleum ether/acetonitrile/
acetone (4:3:1)
0.33 0.56 0.76 1.74 1.94 4.53
4 Petroleum ether/acetonitrile/
acetone (7:6:1)
0.17 0.32 0.50 1.02 1.15 2.22
5 n-Heptane/acetonitrile/ethyl
acetate (7:6:1)
0.28 0.54 0.72 2.08 2.17 6.49
6 n-Heptane/acetonitrile/ethyl
acetate (4:3:1)
0.34 0.63 0.75 1.90 1.94 5.22
7 n-Heptane/acetonitrile/ethyl
acetate (5:3:2)
0.43 0.72 0.80 1.49 1.56 2.99
8 n-Heptane/acetonitrile/ethyl
acetate (2:1:1)
0.58 0.82 0.81 1.25 1.26 1.94
J. Sep. Sci. 2010, 33, 1658–16641660 Y Y. Dang et al.
& 2010 WILEY-VCH Verlag GmbH & Co. KGaA, Weinheim www.jss-journal.com
curzerene (4), 1,8-cineole (5) and b-elemene (6) were
obtained for those eight kinds of solvent systems (Table 1).
The K values of nearly all target compounds in petroleum
ether/acetonitrile/acetone systems could be enlarged by
increasing the volume ration of acetone. In the petroleum
ether/acetonitrile/ethyl acetate systems, increasing the
volume ration of ethyl acetate result in the increasing of the
K values of curdione (1), curcumol (2) and germacrone (3),
and the decreasing of the K values of curzerene (4), 1,8-
cineole (5) and b-elemene (6). The K values of all target
compounds in n-heptane/acetonitrile/ethyl acetate (2:1:1 v/
v/v) system lay well in a range of 0.5–2.0. Theoretically, two
compounds with a similar K value could not be separated
from each other by CCC. Since K
2
and K
4
were close to K
3
and K
5
, respectively, curcumol (2) and germacrone (3), and
curzerene (4) and 1,8-cineole (5) were hardly separated from
each other with this solvent system (n-heptane/acetonitrile/
ethyl acetate 2:1:1 v/v/v). Other factors beside the range of K
value should also be considered for the selection of the
solvent system.
Resolution Rs is a critical parameter to measure the
quality of a separation and is expressed as the Knox equation
composing three variables including the efficiency N, the
selectivity a, and the capacity k
0
:
Rs ¼ðNÞ
1=2
½ða À 1Þ=a½k
0
2
=ð1 þ k
0
2
Þ=4or
Rs ¼ðNÞ
1=2
ða À 1Þ½k
0
1
=ð1 þ k
0
1
Þ=4
ð1Þ
Since K is more practically used than k
0
, the above
equation will be given as [7]:
Rs ¼ 2V
s
ðK
2
À K
1
Þ=ðW
b1
1W
b2
Þð2Þ
Herein, V
s
is the volume of the stationary phase; K
1
and
K
2
are the partition coefficients for the two adjacent peaks,
respectively (where K
2
>K
1
); W
b1
and W
b2
are the peak width
for the two target components.
It is obvious that the resolution increases with the
volume V
s
of the stationary phase, with the selectivity
(K
2
/K
1
) or the difference between K
2
and K
1
, and the
reduction in band width.
Within the eight tested solvents systems, the differences
between K
2
and K
3
, and between K
4
and K
5
in solvent
systems (petroleum ether/acetonitrile/acetone 2:1:1 and
4:3:1 v/v/v) are 0.34 and 0.24, and 0.20 and 0.20, respec-
tively, which are larger than those in the other six systems
(Table 1). These two solvent systems (petroleum ether/
acetonitrile/acetone 4:3:1 and 2:1:1 v/v/v) were selected for
further study.
The settling times for solvent systems of petroleum
ether/acetonitrile/acetone (4:3:1 and 2:1:1 v/v/v) were 7 and
14 s, respectively, which indicated that the solvent system of
petroleum ether/acetonitrile/acetone (4:3:1 v/v/v) may yield
a larger retention of the stationary phase than the solvent
system of petroleum ether/acetonitrile/acetone (2:1:1 v/v/v).
The influences of flow rate and revolution speed were
also investigated. A lower flow rate usually gives a higher
retention level of the stationary phase, improves the peak
resolution and also requires a longer separation time. Using
a lower revolution speed reduces the volume of the
stationary phase retained in the column leading to lower
peak resolution. On the other hand, higher revolution
speeds may produce excessive sample band broadening by
violent pulsation of the column because of elevated pressure
[9]. When revolution speed was 1200 rpm and flow rate of
the mobile phase was 2.5 mL/min, more than 50% of the
stationary phase (upper layer of petroleum ether/acetoni-
trile/acetone 4:3:1 v/v/v) was extruded when the mobile
phase (lower layer of petroleum ether/acetonitrile/acetone
4:3:1 v/v/v) was pumped into HPCPC. When the revolution
speed was increased to 1400 rpm and the flow rate of the
mobile phase was decreased to 2.0 mL/min, the outflow
volume of the stationary phase was about 70 mL before
sample injection, which means that the retention of
stationary phase was nearly 70% (total rotor volume of this
model is 240 mL). The stationary phase could not be held
well in the rotor and it came out with the effluent all the
time during the whole process of separation. Then, the
revolution speed was increased to 1600 rpm and the flow
rate of the mobile phase was reduced to 1.5 mL/min,
yielding nearly 50 mL of the stationary phase eluted after
hydrodynamic equilibrium was attained, and the main-
tenance of the stationary phase was also improved. The
purity of the target components from this separation could
reach 80%. At last, when revolution speed was increased to
1700 rpm and the flow rate of the mobile phase was main-
tained at 1.5 mL/min, stationary phase retention was over
85% and rarely any stationary phase eluted after the sample
injection. The purity of each target component increased to
85% or above in this last experiment. For the solvent system
Absorbance (mAU)
min0 50 100 150 200 250 300 350 400 450
mAU
0
500
1000
1500
2000
Time (Min)
1
2
3
6 5
4
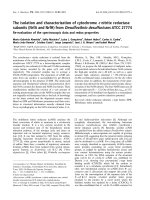
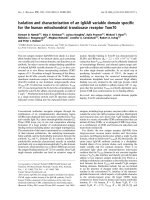
Figure 2. HPCPC chromatogram of the
essential oil of C. wenyujin. Experimental
conditions: solvent system: petroleum ether/
acetonitrile/acetone (4:3:1 v/v/v); mobile
phase: lower phase, revolution speed:
1700 rpm; flow rate: 1.5 mL/min; wavelength:
210 nm. Fractions 1–6 correspond to
curdione, curcumol, germacrone, curzerene,
1,8-cineole and b-elemene, respectively.
J. Sep. Sci. 2010, 33, 1658–1664
Sample Preparation 1661
& 2010 WILEY-VCH Verlag GmbH & Co. KGaA, Weinheim www.jss-journal.com
of petroleum ether/acetonitrile/acetone (2:1:1 v/v/v), the
retention of stationary phase was less than 50% when
carrying out the same procedures for optimizing
the flow rate and revolution speed as for solvent system of
petroleum ether/acetonitrile/acetone (4:3:1 v/v/v). Thus,
petroleum ether/acetonitrile/acetone (4:3:1 v/v/v) was
selected as the solvent system for the HPCPC separation
and other conditions were optimized as: revolution speed
was 1700 rpm while flow rate of mobile phase was 1.5
mL/min.
The HPCPC separation with the optimum condition
described above yielded a total of 8 mg of curdione (1), 4 mg
of curcumol (2), 10 mg of germacrone (3), 18 mg of
curzerene (4), 9 mg of 1,8-cineole (5) and 17 mg
of b-elemene (6) from the essential oil (300 mg) in 2.4 mL of
the selected optimum solvent system (Fig. 2). The amount
of each isolated compound from one run was enough for
structural analysis by MS and NMR.
Repeatability test was chosen to evaluate the system
suitability of the developed assay. The HPCPC separation
5.00 10.00 15.00 20.00 25.00 30.00 35.00 40.00 45.000
200000
1000000
1800000
2600000
Time >
Abundance
A
B
C
D
E
F
G
1
5
6
4
3
5.00
10.00
15.00 20.00
25.00 30.00
35.00
40.00 45.000
600000
1400000
2200000
3000000
Time >
Abundance
1
2
5.00 10.00
15.00
20.00 25.00 30.00
35.00
40.00 45.00
0
80000
16000
240000
320000
Time >
Abundance
2
5.00
10.00 15.00 20.00 25.00 30.00 35.00 40.00 45.00
0
80000
160000
240000
Time >
Abundance
3
5.00 10.00 15.00 20.00 25.00 30.00 35.00 40.00 45.000
200000
600000
1000000
1400000
1800000
Time >
Abundance
4
5.00 10.00 15.00 20.00 25.00 30.00 35.00 40.00 45.000
40000
80000
120000
160000
Time >
Abundance
5
5.00 10.00 15.00 20.0
25.00 30.00 35.00 40.00 45.00
0
50000
150000
250000
350000
450000
Abundance
6
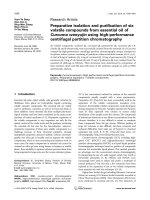
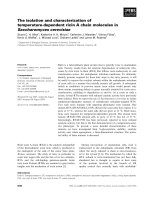
Figure 3. GC-MS chromato-
grams of (A) the essential oil
of Curcuma wenyujin and (B)
Fraction 1, (C) Fraction 2, (D)
Fraction 3, (E) Fraction 4, (F)
Fraction 5 and (G) Fraction 6
from HPCPC separation. 1,
curdione; 2, curcumol; 3,
germacrone; 4, curzerene; 5,
1,8-cineole; 6, b-elemene.
J. Sep. Sci. 2010, 33, 1658–1664
1662 Y Y. Dang et al.
& 2010 WILEY-VCH Verlag GmbH & Co. KGaA, Weinheim www.jss-journal.com
was repeated three times and the purity of the isolated
components determined by GC-MS (Fig. 3, Table 2).
Variation of purity was expressed by the RSDs, which were
less than 2.1% (Table 2).
The structures of compounds 1–4 and 6 were identified
as curdione (1), curcumol (2), germacrone (3), curzerene (4)
and b-elemene (6), respectively, in comparison of their
retention times and MS data (Table 3) with those of the
authentic samples isolated from this oil previously [25].
Compound 5 was identified as 1,8-cineole (5) by spectro-
scopic analysis including MS (Table 3) and NMR as follows:
The
1
H NMR spectrum of compound 5 showed signals
at d: 1.01 (3H, s, H
3
-7), 1.21 (6H, s, H
3
-9 and H
3
-10 ), 1.36
(1H, m, H-4), 1.45 (2H, m, H
a
-3 and H
a
-5), 1.47 (2H, m,
H
a
-2 and H
a
-6 ), 1.61 (2H, m, H
b
-2 and H
b
-6 ) and 2.00 (2H,
m, H
b
-3 and H
b
-5 ). The
13
C NMR spectrum of compound 5
displayed signals at d: 22.8 (C-3 and C-5), 27.5 (C-7), 28.8
(C-9 and C-10), 31.5 (C-2 and C-6), 32.9 (C-4), 69.7 (C-1) and
73.5 (C-8). The NMR data above were in agreement with
those of 1,8-cineole [30].
4 Concluding remarks
After only a one-step separation by HPCPC using a
non-aqueous two-phase solvent system, six components,
namely, curdione (1), curcumol (2), germacrone (3),
curzerene (4), 1,8-cineole (5) and b-elemene (6), were
successfully separated from the essential oil of C. wenyujin,
which are pure enough for structural elucidation,
qualitative analysis as a chemical reference. The isolated
components (2, 3, 5 and 6) with purity above 90% might be
suitable for biological research. The result suggested that
HPCPC might be an effective and efficient method for the
isolation and purification of bioactive compounds from
volatile oil. The method provides an alternative approach to
separate the strong hydrophobic components with similar
structures.
The authors would like to thank X. H. Gao and F. Q. Yang
for their technical assistance in GC-MS in our laboratory. The
research was supported by grants from Macao Science and
Technology Development Fund (013/2008/A1) and Research
committee of University of Macau (RG075/06-07S/WYT/
ICMS).
The authors have declared no conflict of interest.
5 References
[1] Bakkali, F., Averbeck, S., Averbeck, D., Idaomar, M.,
Food Chem. Toxicol. 2008, 46, 446–475.
[2] Chan, S. S. K., Yan, R., Li, G., in: Li, S. P., Wang, Y. T.
(Eds.), Pharmacological Activity- Based Quality Control
of Chinese Herbs, Nova Science-Publishing, New York
2008, pp. 273–289.
[3] Zhang, Y., Cao, H., Yang, M. M., Xiao, P., in: Li, S. P.,
Wang, Y. T. (Eds.), Pharmacological Activity-Based
Quality Control of Chinese Herbs, Nova Science-
Publishing, New York 2008, pp. 311–324.
[4] Jusforgues, P., in: Wilson, I. D. (Ed.), Encyclopedia of
Separation Science, Elsevier-Publishing, Amsterdam
2000, pp. 529–536.
[5] Adio, A. M., Konig, W. A., Phytochemistry 2005, 66,
599–609.
Table 2. Purity of six components separated by HPCPC
Purity Curdione (1) Curcumol (2) Germacrone (3) Curzerene (4) 1,8-Cineole (5) b-Elemene (6)
First run (%) 85.0
a)
91.7 94.0 88.5 94.4 97.8
Second run (%) 86.9 92.8 94.5 89.7 93.2 96.7
Third run (%) 88.6 93.4 92.8 86.8 95.8 96.2
Average (%) 86.8 92.6 93.8 88.3 94.5 96.9
RSD (%) 2.1 0.9 0.9 1.6 1.4 0.8
a) Purity (%) 5 100 Â (peak area of target compound)/(total peak area of all peaks).
Table 3. The retention times (RT) and MS data of six isolated components
Peak Compound RT (min) MS data
a)
1 Curdione 35.60 236(M
1
,8), 180(96), 167(75), 109(80), 95(34), 82(36), 69(100), 68(64), 67(61), 55(73), 41(67)
2 Curcumol 29.48 236(M
1
,26), 135(28), 121(100), 119(29), 107(41), 93(40), 91(29), 69(33), 55(44), 43(28), 41(46)
3 Germacrone 33.82 218(M
1
,8), 136(49), 135(71), 121(24), 107(100), 105(20), 91(33), 79(20), 67(52), 53(22), 41(28)
4 Curzerene 23.59 216(M
1
,13), 148(30), 133(10), 109(10), 108(100), 105(12), 93(11), 91(16), 79(17), 77(15)
5 1,8-Cineole 6.16 154(M
1
,36), 111(47), 108(50), 93(36), 84(41), 81(61), 71(48), 69(38), 41(36), 43(100)
6 b-Elemene 16.98 204(M
1
,2), 147(46), 121(46), 107(67), 93(100), 91(50), 81(93), 79(66), 68(67), 67(75), 41(51)
a) m/z , relative intensity shown in parenthesis.
J. Sep. Sci. 2010, 33, 1658–1664
Sample Preparation 1663
& 2010 WILEY-VCH Verlag GmbH & Co. KGaA, Weinheim www.jss-journal.com
[6] Cool, L. G., Phytochemistry 2001, 58, 969–972.
[7] Foucault, A. P., Centrifugal Partition Chromatography,
Marcel Dekker, New York 1994.
[8] Cao, X. L., High-Speed Countercurrent Chromatography
Technology and Application, Chemical Industry Press,
Beijing 2005.
[9] Ito, Y., J. Chromatogr. A 2005, 1065, 145–168.
[10] Yao, S., Liu, R. M., Huang, X. F., Luo, J. G., Kong, L. Y.,
Chin. J. Nat. Med. 2008, 6, 13–19.
[11] Shi, X. G., Wang, X., Wang, D. J., Geng, Y. L., Liu, J. H.,
Sep. Sci. Technol. 2009, 44, 712–721.
[12] Xiao, Y., Xie, J. C., Ma, L. H., Ma, J. F., Shipin Yu Fajiao
Gongye 2007, 33, 142–143, 147.
[13] Xie, J. C., Wang, S. B., Sun, B. G., Zheng, F. P., J. Liq.
Chromatogr. Relat. Technol. 2008, 31, 2621–2631.
[14] Zhang, D. L., Teng, H. L., Li, G. S., Liu, K., Su, Z. G., Sep.
Sci. Technol. 2006, 41, 3397–3408.
[15] Yan, J. Z., Chen, G., Tong, S. Q., Feng, Y. P., Sheng, L.
Q., Lou, J. Z., J. Chromatogr. A 2005, 1070, 207–210.
[16] Pharmacopeia Commission of PRC (Ed.), Pharmaco-
poeia of the People’s Republic of China, Chemical
Industry Press, Beijing 2005.
[17] Yang, F. Q., Li, S. P., in: Ching, F. M. (Ed.), Chinese
Herbal Drug research Trends, Nova Science-Publishing,
New York 2007, pp. 67–98.
[18] Nie, X. H., Ao, Z. H., Yin, G. Y., Tao, W. Y., Pharm.
Biotechnol. 2003, 10, 152–154.
[19] Jiang, J. P., Jilin J. Tradit. Chin. Med. 2000, 20,
62–64.
[20] Xia, Q., Huang, Z. G., Li, S. P., Zhang, P., Wang, J., He, L.
N., Chin. Pharmacol. Bull. 2004, 20, 357–358.
[21] Ming, Q., Sun, F., Liu, J. W., Liu, Z. Q., Zhang, S. Q.,
Jin, Y. Q., Xing, S. Y., Chin. J. Gerontol. 2004, 24,
267–268.
[22] Zheng, S., Yang, H., Zhang, S., Wang, X., Yu, L., Lu, J.,
Li, J., J. Cell Biochem. 1997, Suppl. 27, 106–112.
[23] Wang, Y., Wang, M. Z., Acta Pharm. Sin. 2001, 36,
849–853.
[24] Yang, F. Q., Li, S. P., Zhao, J., Lao, S. C., Wang, Y. T.,
J. Pharm. Biomed. Anal. 2007, 43, 73–82.
[25] Yang, F. Q., Wang, Y. T., Li, S. P., J. Chromatogr. A 2006,
1134, 226–231.
[26] Yang, F. Q., Li, S. P., in: Li, S. P., Wang, Y. T. (Eds.),
Pharmacological Activity-Based Quality Control of
Chinese Herbs, Nova Science-Publishing, New York
2008, pp. 291–310.
[27] Qin, N. Y., Yang, F. Q., Wang, Y. T., Li, S. P., J. Pharm.
Biomed. Anal. 2007, 43, 486–492.
[28] Foucault, A. P., Chevolot, L., J. Chromatogr. A 1993, 808,
3–22.
[29] Sutherland, I. A., Fisher, D., J. Chromatogr. A 2009,
1216, 740–753.
[30] Xu,S., Tong, S., Yang, X., Pan, Y., Mod. Chin. Med. 2008,
10, 24–29.
J. Sep. Sci. 2010, 33, 1658–16641664 Y Y. Dang et al.
& 2010 WILEY-VCH Verlag GmbH & Co. KGaA, Weinheim www.jss-journal.com