Báo cáo khoa học: Light-harvesting complex II protein CP29 binds to photosystem I of Chlamydomonas reinhardtii under State 2 conditions doc
Bạn đang xem bản rút gọn của tài liệu. Xem và tải ngay bản đầy đủ của tài liệu tại đây (410.77 KB, 10 trang )
Light-harvesting complex II protein CP29 binds to
photosystem I of Chlamydomonas reinhardtii under State 2
conditions
Joanna Kargul
1
, Maria V. Turkina
2
, Jon Nield
1
, Sam Benson
1
, Alexander V. Vener
2
and James Barber
1
1 Wolfson Laboratories, Division of Molecular Biosciences, Imperial College London, UK
2 Division of Cell Biology, Linko
¨
ping University, Sweden
Excitation of the membrane-bound protein complexes
photosystem I (PSI) and II (PSII) by light must be
optimized to ensure the highest efficiency of photosyn-
thetic electron transport. Redistribution of excitation
energy between both photosystems as an immediate
and dynamic response to changing illumination condi-
tions occurs during the process termed ‘State transi-
tions’, where State 1 is induced by excess PSI light and
State 2 by excess PSII light [1]. State 1 to State 2
transition occurs in response to the reduction of the
plastoquinone pool, triggering the activation of thyla-
koid-bound kinases which in turn phosphorylate the
mobile light-harvesting complex II (LHCII) antenna
[2–5]. The phosphorylated LHCII is proposed to
transfer physically from PSII to PSI to balance energy
distribution between, and optimize the rate of electron
transfer through, the two photosystems or induce
cyclic electron flow around PSI [6–9]. Conversely, in
PSI-favouring light, oxidation of plastoquinone occurs,
leading to deactivation of LHCII-specific kinases and
dephosphorylation of mobile LHCII by redox-inde-
pendent phosphatases. As a consequence, LHCII deta-
ches from PSI and functionally couples to PSII (State
2 to State 1 transition). Recent studies of the mutants
that were blocked in State 1 revealed that thylakoid
protein kinase Stt7 from green alga Chlamydomonas
reinhardtii and its higher plant orthologue STN7 are
required for phosphorylation of several LHCII poly-
peptides [4,5], thus providing further evidence that pro-
tein phosphorylation is essential for State transitions.
Keywords
Chlamydomonas; CP29; photosynthesis;
protein phosphorylation; State transitions
Correspondence
J. Barber, Division of Molecular Biosciences,
Imperial College London, South Kensington
Campus, London SW7 2AZ, UK
Fax: +44 20 7594 5267
Tel: +44 20 7594 5266
E-mail:
(Received 17 June 2005, revised 29 July
2005, accepted 2 August 2005)
doi:10.1111/j.1742-4658.2005.04894.x
The State 1 to State 2 transition in the photosynthetic membranes of plants
and green algae involves the functional coupling of phosphorylated light-
harvesting complexes of photosystem II (LHCII) to photosystem I (PSI).
We present evidence suggesting that in Chlamydomonas reinhardtii this
coupling may be aided by a hyper-phosphorylated form of the LHCII-like
CP29 protein (Lhcbm4). MS analysis of CP29 showed that Thr6, Thr16
and Thr32, and Ser102 are phosphorylated in State 2, whereas in State 1-
exposed cells only phosphorylation of Thr6 and Thr32 could be detected.
The LHCI–PSI supercomplex isolated from the alga in State 2 was found
to contain strongly associated CP29 in phosphorylated form. Electron
microscopy suggests that the binding site for this highly phosphorylated
CP29 is close to the PsaH protein. It is therefore postulated that redox-
dependent multiple phosphorylation of CP29 in green algae is an integral
part of the State transition process in which the structural changes of
CP29, induced by reversible phosphorylation, determine the affinity of
LHCII for either of the two photosystems.
Abbreviations
Chl, chlorophyll; DDM, b-dodecyl maltoside; EM, electron microscopy; IMAC, immobilized metal affinity chromatography; LHCII, light-
harvesting complex II; PSI, photosystem I; PSII, photosystem II; S1 and S2, State 1 and State 2.
FEBS Journal 272 (2005) 4797–4806 ª 2005 FEBS 4797
Although it is well established that State transitions
are driven by the redox control of phosphorylation ⁄
dephosphorylation of a mobile pool of LHCII and
that this mobile antenna system shuttles between PSI
and PSII [6–9], little is known about the structural
changes involved. Lunde et al. [11] showed that the
PsaH protein of PSI was important in establishing
State 2 and suggested that it could be the docking site
for phosphorylated LHCII. This idea was recently
reinforced by the 4.4 A
˚
X-ray structure of higher plant
PSI [12], in which the PsaH protein was shown to be
located at an exposed hydrophobic surface of PSI and
to bind a chlorophyll (Chl) molecule which may aid
energy transfer from phosphorylated LHCII to the PSI
complex. The X-ray structure, however, lacked density
indicative of binding of LHCII in this region. Indeed,
to date, there is no direct structural evidence of how
phosphorylated LHCII binds to PSI, although recent
cross-linking and antisense studies have provided some
evidence for binding of the LHCII antenna within the
PsaH ⁄ I ⁄ O region of the PSI core in State 2 conditions
[13,14].
In this study, we set out to characterize the physical
association of phosphorylated LHCII to PSI in State 2
using biochemical analyses, electron microscopy and
single particle image averaging of LHCI–PSI super-
complexes isolated from the green alga C. reinhardtii.
Compared with the LHCI–PSI supercomplex isolated
from cells in State 1, we found an additional protein
density in the isolated State 2 LHCI–PSI supercomplex
in the vicinity of the PsaH protein region. This extra
density seems to be due to the presence of a 35 kDa
phosphoprotein which was shown by MS analyses to
be the minor LHCII-like subunit, CP29. MS also
revealed that CP29 in thylakoids isolated from algal
cells, exposed to either State 2 or State 1 conditions,
underwent multiple differential phosphorylation events.
Therefore, our data indicate involvement of CP29
phosphorylation in State transitions and suggest that
hyperphosphorylated CP29 may provide a functional
link between a mobile LHCII antenna and the PSI
core in State 2.
Results
Biochemical characterization of State 1 and
State 2 LHCI–PSI supercomplexes
It is well established that when Chlamydomonas is sub-
jected to anaerobic conditions in the dark, the cells
convert from State 1 to State 2 due to over-reduction
of the redox pool linking PSI and PSII [10,15]. Using
this procedure we were able to establish that this
conversion occurs by monitoring their low-temperature
Chl emission spectrum and comparing it with that of
Chlamydomonas cells in State 1 induced by normal
aerobic dark conditions. As shown in Fig. 1, in State 2
the yield of fluorescence from PSI (peaking at
715 nm), which is a measure of its absorption cross-
section, was significantly higher than that from PSI of
State 1 cells, based on normalization with the fluores-
cence from PSII (peaking at 685 nm). This result
confirmed the increase of functional light-harvesting
antenna in PSI during State 1 to State 2 transition.
Using previously optimized sucrose gradient frac-
tionation of thylakoid membranes partially depleted
from PSII and solubilized with 0.9% b-dodecyl malto-
side (DDM) [16], we isolated LHCI–PSI complexes
from State 1 (S1) and State 2 (S2)-induced Chlamydo-
monas cells. Three Chl-containing fractions were
obtained with the densest fractions corresponding to
the LHCI–PSI supercomplexes (S1–F3 and S2–F3 frac-
tions) [16]. The protein profiles of S1 and S2 thyla-
koids (Thy) and also of the S1 ⁄ S2–F3 sucrose-gradient
factions (Fig. 2A) were essentially identical (as judged
by Coomassie Brilliant Blue staining) and similar to
the S1 profiles reported previously [16]. Western blot-
ting and spectroscopic analyses of S1–F3 and S2–F3
fractions confirmed the presence of PSI core subunits
and the functionally coupled LHCI antenna which
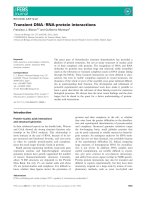
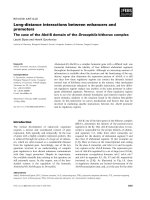
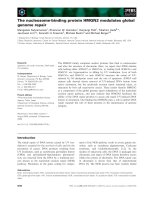
Fig. 1. State transitions in C. reinhardtii. We measured 77 K fluor-
escence emission spectra measured from the psbD-His cells,
induced to State 1 (solid) or State 2 (dotted). Note the resultant rel-
ative change in fluorescence of PSI (715 nm) and PSII (685 nm)
owing to relative changes in the absorption cross-section of each
photosystem. Spectra were obtained from dark-adapted aerated
cells (State 1) or from cells preadapted to anaerobic conditions in
the dark (State 2).
Phospho-CP29 and state transitions J. Kargul et al.
4798 FEBS Journal 272 (2005) 4797–4806 ª 2005 FEBS
form the outer light-harvesting proteins of PSI (data
not shown) [16]. These LHCI proteins are not phos-
phorylated in State 1 and indeed, there is no reported
evidence that they become phosphorylated in State 2
[17–19]. Nevertheless, as shown in Fig. 2B, significantly
increased phosphorylation of several proteins was
detected within intact S2 thylakoid membranes by
western blotting with antiphosphothreonine serum. In
S1 thylakoids, only the 10 kDa phosphoprotein was
clearly detected under the conditions used, whereas in
S2 thylakoids additional phosphorylated proteins were
clearly distinguished in the range of 29–35 kDa
(Fig. 2B). The latter proteins correspond to phosphor-
ylated CP29, CP26 and unresolved major LHCII
antenna polypeptides undergoing phosphorylation in
S2 thylakoids [4,10]. In the case of the S2–F3 fraction,
a single phosphorylated protein of 35 kDa was spe-
cifically detected (arrowed in Fig. 2B), which was not
present in the S1–F3 fraction. Although antiphospho-
threonine serum readily interacted with the phospho-
LHCII solubilized from S2 thylakoid membranes, it
was less effective at detecting phospho-CP29 either in
the thylakoid membrane or in S2 LHCI–PSI super-
complex fractions (Fig. 2B).
To identify the 35 kDa phosphoprotein in the S2–F3
fraction, the protein band was excised from the poly-
acrylamide gel and digested with trypsin. The peptides
were extracted after the procedure of tryptic in-gel
digestion and subjected to tandem MS. Collision-
induced fragmentation of peptide ions revealed
sequences of four peptides ranging in length from 12
to 27 amino acids (Table 1, peptides 1–4). The blast
database search [20] identified that all the subsequent
peptides originate from the minor LHCII-like subunit
CP29. The positions of the sequenced peptides in the
sequence of the mature CP29 are indicated in Table 1.
These data also confirmed recent findings [21] that the
putative transit peptide of the nuclear-encoded CP29
in Chlamydomonas is not removed but processed by
methionine excision and acetylation (peptide 1 in
Table 1). However, we were unable to detect any phos-
phopeptides from CP29, which could be explained by
the frequently observed loss of the phosphorylated
peptides during the in-gel digestion procedure and the
following peptide extraction, as well as the suppressed
ionization of the phosphorylated peptides in the pres-
ence of nonphosphorylated ones [22]. Importantly, no
peptides corresponding to CP29 were detected in the
S1–F3 sample subjected to identical tandem MS analy-
sis, even though all the proteins present in the region
of 25–40 kDa were analysed by in-gel digestion fol-
lowed by MS characterization.
In order to investigate the status of CP29 phos-
phorylation in the algal cells exposed to State 2 condi-
tions, we subjected isolated thylakoid membranes to
proteolytic ‘shaving’ and enriched the phosphopeptides
by immobilized metal affinity chromatography (IMAC)
using the procedure described previously [21]. Sequen-
cing of the phosphopeptides obtained by nanospray
quadrupole time-of-flight MS revealed four distinct
phosphorylated peptides from the CP29 protein
(Table 1, peptides 5–8).
Identification and mapping of the three previously
unknown phosphorylation sites in CP29 was achieved
A
B
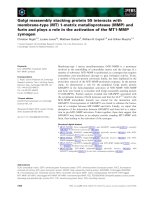
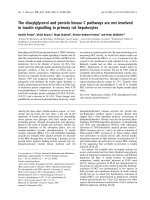
Fig. 2. Protein composition and phosphorylation of thylakoids and LHCI–PSI obtained from State 1 and State 2 C. reinhardtii cells. (A) Protein
profiles of thylakoids (Thy) and LHCI–PSI (F3) complexes obtained from psbD-His State 1- (S1) and State 2 (S2)-induced cells. (B) Phosphory-
lation of thylakoids and LHCI–PSI complexes isolated from psbD-His cells. Proteins were separated on SDS ⁄ PAGE at 5 lg of Chl per lane.
Detection of phosphoproteins was performed with antiphosphothreonine serum as described previously [16]. Protein size markers are indica-
ted on the left. The 35 and 10 kDa phosphobands are marked with arrows in (B). The 35 kDa protein was identified as CP29 by MS. Posi-
tions of other proteins were identified by western blotting as in Kargul et al. [16].
J. Kargul et al. Phospho-CP29 and state transitions
FEBS Journal 272 (2005) 4797–4806 ª 2005 FEBS 4799
by collision-induced dissociation of the corresponding
peptide ions and examination of the resultant spectra
for the presence of the signals produced by ‘neutral
loss’ of phosphoric acid, which are characteristic
of phosphorylated peptides [22–24]. Analysis of the
spectra for the presence of N- and C-terminal frag-
ments that contain phosphate and show neutral loss of
phosphoric acid allowed unambiguous localization of
the exact phosphorylation sites. The first (Fig. 3A) and
second (Fig. 3B) peptides contained three threonine
residues each, but only the third N-terminal threonine
Table 1. The sequences of tryptic peptides from CP29 revealed by
tandem MS. A single-letter amino acid code is used; Ac- designates
N-terminal acetylation; the lower case ‘t’and‘s’ specify phosphor-
ylated threonine and serine residues, correspondingly. Positions of
the peptides in the sequence of the mature CP29 are indicated by
corresponding amino acid numbers. The sequences of the peptides
1–4 were obtained after in-gel digestion of the putative phospho-
protein from the State 2 LHCI–PSI supercomplex preparation. The
sequences of the phosphorylated peptides 5–8 were obtained after
phosphopeptide enrichment from State 2 thylakoid membranes
(see Experimental procedures).
No. Peptide sequence
Amino acid
numbers
1 Ac-VFKFPTPPGTQK 1–12
2 GFDPLGLSKPSEFVVIGVDENDQNAAK 71–97
3 GSVEAIVQATPDEVSSENR 101–119
4 LAPYSEVFGLAR 120–131
5 Ac-VFKFPtPPGTQK 1–12
6AGtTATKPAPK 14–24
7VAtSTGTR 30–37
8 NNKGsVEAIVQATPDEVSSENR 98–119
m/z
200 600 800
400
A
AGtTATKPAPK
b 234 5 7 9
1098 76 54 32 1
y
Intensity (%)
10
20
40
30
568.7
519.7
y9*
y9*
2+
y2
b4*
b3
y8
b9*
y7
y6
b7*
y10*
2+
y4
b5*
b2
y1
b3*
y3
y5
C
NNKGsVEAIVQATPDEVSSENR
b 8910 12
13 12 11 10 9 8 6 5 4 2
y
m/z
Intensity (%)
20
40
60
200 1000 1400600
832.1
y13
y12
y11
y9
b10
799.4
y10
b9
b8
y8
y9
2+
b12
2+
y6
y5
a5
a5*
y4
b10*
2+
y2
a5*
2+
B
Intensity (%)
20
40
80
60
m/z
200 600 800
400
VAtSTGTR
b 23 6 7
7654 3 21
y
443.7
y3
y4
y6*
2+
y7
b3*
y1
y6
y7*
y6*
b7*
y5
y5-H
2
0
b6*
394.7
y2-H
2
0
b2
a2
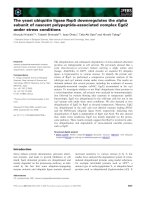
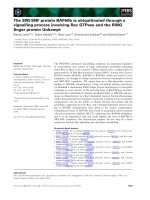
Fig. 3. MS sequencing of three phosphorylated peptides from CP29
in C. reinhardtii cells exposed to State 2 conditions. The b
(N-terminal) and y (C-terminal) fragment ions are labelled and the
peptide sequences shown. The lower case t and s in the sequences
designate phosphorylated Thr and Ser residues, respectively. The
sites of phosphorylation were localized according to the pattern of
the fragment ions that do not contain phosphate and complimentary
ions containing phosphate and satellite signals with the neutral loss
of phosphoric acid (b and y ions marked with the asterisk). (A) Frag-
mentation spectrum of the doubly protonated peptide ion with
m ⁄ z ¼ 568.7. The pronounced doubly charged ion indicated at
m ⁄ z ¼ 519.7 corresponds the neutral loss of phosphoric acid from
the parent ion (568.7 · 2 ) 519.7 · 2 ¼ 98, which is the mass of
H
3
PO
4
). Thr3 in the peptide is phosphorylated: see, particularly, b3
ion with the phosphate, b3* after the neutral loss of H
3
PO
4
and
complementary y8 ion without phosphate. (B) Fragmentation spec-
trum of the doubly protonated peptide ion with m ⁄ z ¼ 443.7 (indica-
ted). The ion originated after the neutral loss of phosphoric acid is
indicated at m ⁄ z ¼ 394.7. Thr3 in the peptide is phosphorylated:
see, particularly, y5 ion without phosphate and y6 with the
phosphate plus b3* ion after the neutral loss of H
3
PO
4
. (C) Frag-
mentation spectrum of the triply protonated phosphopeptide ion
with m ⁄ z ¼ 832.1 and corresponding ‘neutral loss’ signal at m ⁄ z ¼
799.4 (832.1 · 3 ) 799.4 · 3 ¼ 98). The peptide is phosphorylated
at Ser5: see y11 to y13 fragments without phosphate and b8 to b10
ions with the phosphate. This pattern of fragment ions can only
originate from the peptide in which Ser5 is phosphorylated.
Phospho-CP29 and state transitions J. Kargul et al.
4800 FEBS Journal 272 (2005) 4797–4806 ª 2005 FEBS
in each of these peptides was found to be phosphoryl-
ated. These residues correspond to positions 16 and 32
in the sequence of the mature CP29 (Table 1). The
third peptide contained one threonine and three serine
residues (Fig. 3C). However, the fragmentation spec-
trum (Fig. 3C) revealed that only the serine corres-
ponding to position 102 in the amino acid sequence of
CP29 was phosphorylated. All three newly identified
phosphorylation sites are located in the long N-termi-
nus of CP29 exposed to the stromal side of thylakoid
membranes. These findings (Table 1, Fig. 3) are unique
because there is no other report of any thylakoid pro-
tein undergoing quadruple phosphorylation.
To determine the extent of CP29 phosphorylation in
State 1 we performed similar MS analyses of thylakoid
membranes isolated from algal cells exposed to State 1
conditions. This study identified only two phosphoryl-
ated peptides derived from CP29, which corresponded
to phosphorylation of Thr6 and Thr32 (Table 1). The
level of both phosphopeptide ions was significantly
lower than in samples from the same amount of thyla-
koids in State 2, probably accounting for the lack of
detection of phospho-CP29 in State 1 thylakoids by
antiphosphothreonine blotting (Fig. 2B). However, MS
measurements that do not include labelling with stable
isotopes are generally not quantitative and the exact
levels of CP29 phosphorylation at positions 6 and 32
in State 1 and 2 conditions will be addressed in a sep-
arate study. We did not find any phosphorylation of
CP29 at residues 16 and 102 in State 1 thylakoid
membranes and therefore, we conclude that phos-
phorylation of these residues is specific to the State 2
condition.
Single particle image averaging of State 1 and
State 2 LHCI–PSI supercomplexes
Both S1–F3 and S2–F3 sucrose density gradient frac-
tions were analysed by electron microscopy of negat-
ively stained particles followed by single-particle
averaging. In the S1–F3 fraction, the population of the
most structurally intact particles (3881 particles) cor-
responded to LHCI–PSI supercomplexes described pre-
viously for State 1 [16]. In the S2–F3 fraction, a novel
population of larger LHCI–PSI supercomplexes (1675
particles) was identified. Top-view projection maps of
the LHCI–PSI supercomplex isolated from State 1 and
State 2 are compared in Fig. 4. The former (Fig. 4A)
has maximum dimensions of 190 · 170 A
˚
(excluding
detergent shell), whereas the State 2 supercomplex
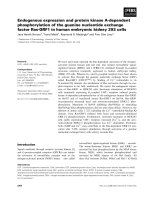
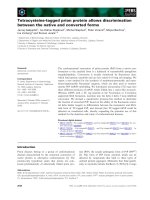
Fig. 4. Top-view projections of S1 and S2
LHCI–PSI supercomplexes of C. reinhardtii,
as viewed from their stromal sides. (A) Pro-
jection of State 1 LHCI–PSI, derived from an
analysis of negatively stained particles by
electron microscopy. (B) Projection of State
2 LHCI–PSI. (C,D) Outline (black) of the pea
three-dimensional X-ray model 1qzv.pdb [12]
emphasizing the monomeric PSI core and
the four LHCI subunits overlaid onto projec-
tions of State 1 and State 2 LHCI–PSI,
respectively. Scale bar ¼ 50 A
˚
.
J. Kargul et al. Phospho-CP29 and state transitions
FEBS Journal 272 (2005) 4797–4806 ª 2005 FEBS 4801
(Fig. 4B) is larger with maximum dimensions of
190 · 205 A
˚
. This size difference is due to additional
protein density (Fig. 4B). To gain further insight into
the organization of Chlamydomonas LHCI–PSI super-
complexes, the outline of the X-ray map of the
recently published higher plant LHCI–PSI [12] was
overlaid onto the S1 and S2 LHCI–PSI projections
(Fig. 4C,D, respectively) using the crescent-like four-
domain LHCI antenna as a visual reference for the fit-
ting. In addition to the four Lhca subunits present
within the X-ray model of the higher plant LHCI–PSI
supercomplex, we were able to identify density which
could accommodate two further LHC subunits in the
S1 LHCI–PSI supercomplexes (Figs 4C and 5). Import-
antly, in the S2 LHCI–PSI particles, the additional
density compared with that of higher plant PSI, was
larger than for State 1 particles, and the extra density
corresponded to that expected for an additional LHC
subunit (Fig. 5). As can be seen in Fig. 5, all the extra
density was observed in the region adjacent to PsaH
(highlighted in white in Fig. 5).
Discussion
The recent X-ray structure of the higher plant LHCI–
PSI supercomplex revealed several unique features of
the organization of the LHCI antennae and its bind-
ing to the PSI core. First, the number of Lhca pro-
teins constituting the higher plant LHCI appears to
be lower than previously estimated from biochemical
and spectroscopic studies. Four rather than eight
Lhca subunits form the light-harvesting belt asymmet-
rically located on the PsaG ⁄ J ⁄ K side of the core
domain [12]. Second, the LHCI crescent is much more
densely populated with Chl molecules than previously
estimated, with 56 Chls bound within the peripheral
LHCI antenna region and an additional 10 Chls pre-
sent in the so-called ‘gap’ region, which are involved
in energy transfer from the antenna to the reaction
centre [12].
The crystal structure of the higher plant LHCI–PSI
supercomplex prompted us to extend the modelling of
the Chlamydomonas homologue visualized by electron
microscopy [16]. We propose that in Chlamydomonas,
the four major Lhca subunits of LHCI form a crescent
positioned asymmetrically on the PsaG ⁄ J ⁄ K side of
the core complex similar to the higher plant LHCI
antenna. However, it is well established that the
Chlamydomonas LHCI antenna complex comprises a
larger number of Lhca proteins than in higher plants
[25–27]. Therefore, as argued previously [16], the addi-
tional density detected in the Chlamydomonas LHCI–
PSI supercomplex particles from State 1 cells is likely
to accommodate extra LHCI antenna subunits which
are also retained in the supercomplex isolated from
cells placed in State 2. According to modelling using
the X-ray structure of higher plant PSI [12], we con-
clude that S1 and S2 LHCI–PSI supercomplexes of
Chlamydomonas contain six Lhca subunits (Fig. 5,
red).
The LHCI–PSI supercomplex, isolated from Chlamy-
domonas cells in State 2 and present in the S2–F3
fraction of the sucrose density gradient, contained a
single phosphoprotein with an apparent molecular
mass of 35 kDa (Fig. 2B). Subsequent analyses by
tandem MS identified this protein as CP29 whose well-
established function is to aid the binding of LHCII to
the PSII reaction centre core complex [28,29]. We there-
fore suggest that the additional density observed in the
S2 LHCI–PSI supercomplex in the vicinity of PsaH is
indeed phosphorylated CP29, modelled in blue in
Fig. 5 according to the X-ray structure of the LHCII
protein [30]. In order to further test the hypothesis that
phospho-CP29 plays a role in the binding of phospho-
LHCII to facilitate the State 1 to State 2 transition, we
Fig. 5. Detailed modelling of the projection map for the LHCI–PSI
supercomplex isolated from C. reinhardtii cells placed in State 2.
Modelling is based on higher plant coordinates 1qzv.pdb [12] with
PSI core (green), LHCI antenna (red), PsaJ (yellow), PsaK
(magenta), PsaG (purple), PsaI (orange), PsaL (cyan) and PsaH
(white). The additional density observed in State 2 LHCI–PSI super-
complex which is able to accommodate an additional LHC subunit
is coloured blue and is suggested to be phospho-CP29 (see text).
Chlorophylls are shown in yellow, but were excluded from the addi-
tional density attributed to the LHCI and CP29 subunits. The deter-
gent shell surrounding the particles in the hydrophobic membrane
plane sits within any stain present and this shell is assigned here
as an 15 A
˚
wide outer contour (yellow). Scale bar ¼ 50 A
˚
.
Phospho-CP29 and state transitions J. Kargul et al.
4802 FEBS Journal 272 (2005) 4797–4806 ª 2005 FEBS
conducted studies on a mutant of Chlamydomonas gen-
erated by dsRNA antisense technology having an unde-
tectable level of CP29 (A. Kanno and J. Minagawa,
unpublished observations). We found that although
this mutant was highly unstable with regards to CP29
suppression (experiments are currently being conducted
to stabilize inhibition of CP29 expression; A. Kanno
and J. Minagawa, unpublished observations), a prelim-
inary mutant line depleted of CP29 did not contain the
35 kDa phosphoprotein in the purified State 2 LHCI–
PSI complex even though thylakoid membranes from
which it was isolated contained several phosphopro-
teins including major LHCII (J. Kargul, J. Nield,
S. Benson, A. Kanno, M. Turkina, A. Vener, J. Mina-
gawa & J. Barber, unpublished observations). Conco-
mitant with this finding, electron microscopy and
single-particle analysis showed that density attributed
to phospho-CP29 was absent in the LHCI–PSI particles
isolated from the State 2-induced CP29 mutant cells
(J. Kargul, J. Nield, S. Benson, A. Kanno, M. Turkina,
A. Vener, J. Minagawa and J. Barber, unpublished
observations).
Although it is known that CP29 can undergo revers-
ible N-terminal phosphorylation [21,31,32], it has not
previously been shown to bind to PSI or be implicated
with State transitions. CP29 in Chlamydomonas is
unique because it is the only nuclear-encoded thyla-
koid protein in which the transit chloroplast-targeting
peptide is not removed but processed by excision of
the N-terminal methionine, followed by acetylation
and phosphorylation of Thr6 [21]. It has been
proposed that it is the functional importance of this
phosphorylation site which leads to retention of the
transit peptide in the mature protein [21]. Importantly,
our MS analyses identified three novel phosphorylation
sites, in addition to Thr6, within the N-terminal
domain of CP29 in Chlamydomonas exposed to State 2
conditions. We also found that phosphorylation of
these sites is dynamically regulated by redox conditions
in the photosynthetic membranes. Phosphorylation of
CP29 in State 2 is more pronounced and two of the
newly found modification sites are exclusively phos-
phorylated only under conditions associated with the
State 1 to State 2 transition. It is feasible that under
State 2 conditions, these additional phosphorylations
perturb the electrostatic properties of CP29 and trigger
a conformational change leading to dissociation of this
protein from PSII and its subsequent attachment to
PSI.
In conclusion, our results suggest that phospho-
CP29, possibly in a multiphosphorylated form,
strongly associates with PSI in State 2, adjacent to the
PsaH protein. The absence of the mobile pool of
LHCII in our State 2 LHCI–PSI supercomplex prepar-
ation is likely to be a consequence of its weak interac-
tion with PSI compared with phospho-CP29, and its
displacement following DDM treatment [13]. Our data
suggest that the functional role of the phospho-CP29
bound to LHCI–PSI is to act as a docking site for the
mobile phospho-LHCII, as depicted in Fig. 6. The
extent of LHCII binding to LHCI–PSI will depend on
the degree of excitation imbalance between PSI and
PSII. Therefore, in Chlamydomonas, it seems that
CP29 may functionally couple LHCII to PSI as well as
to PSII, with the former occurring under State 2 con-
ditions. Previously, we estimated that the LHCI–PSI
supercomplex in State 1 binds about 214 Chls [16] and
if CP29 binds 14 Chls, as does each monomer of
LHCII [30], then CP29 alone would increase the
absorption cross section of the State 2 LHCI–PSI
Fig. 6. Diagrammatic representation of how
phospho-CP29 could tightly associate with
PSI in State 2 and therefore facilitate the
binding of mobile LHCII in order to regulate
the absorption cross-section of PSI.
J. Kargul et al. Phospho-CP29 and state transitions
FEBS Journal 272 (2005) 4797–4806 ª 2005 FEBS 4803
supercomplex by 7% compared with its State 1
counterpart. This increase in antenna size would be
enhanced by the functional association of phospho-
LHCII, which in the case of Chlamydomonas can be
very extensive compared with higher plants [4–6]. Whe-
ther hyperphosphorylation of CP29 occurs in higher
plants and whether this phosphoprotein associates with
PSI in State 2 has yet to be determined. Importantly,
one phosphorylation site identified in this study exclu-
sively in State 2 thylakoid membranes (Thr16) is fully
conserved between higher plant (Arabidopsis and
maize) CP29 and its Chlamydomonas counterpart.
Experimental procedures
Culturing and State transitions
C. reinhardtii psbD-His cells [33] were grown to mid-log
phase photoheterotrophically using a Tris ⁄ acetate ⁄ phos-
phate medium as described previously [16]. The cells were
placed in either State 1 by aerobic dark incubation for 2 h
or in State 2 by anaerobic dark incubation (bubbling with
nitrogen) for 20 min in the presence of 40 mm NaF to inhi-
bit phosphatase activity, as described previously [15]. The
ability of the cells to carry out State transitions was
checked by monitoring room fluorescence yield changes in
response to illumination by light preferentially absorbed by
PSII, light 2 (Balzer BG18 filter, Milan, Italy) or light pref-
erentially absorbed by PSI, light 1 (Schott RG695 filter,
Mainz, Germany). The room temperature fluorescence
emission was monitored at > 650 nm using a Waltz chloro-
phyll fluorimeter (PAM-101; Effeltrich, Germany). State
transitions were also monitored by recording chlorophyll
fluorescence spectra at 77 K using a Perkin–Elmer LS50
luminescence spectrophotometer (Beaconsfield, UK) with
an excitation wavelength of 435 nm.
Biochemical isolation and characterization
Using a procedure reported previously [16], thylakoid mem-
branes were isolated from cells that had been placed in
either State 1 or State 2 using the dark aerobic ⁄ anaerobic
procedures [15]. In the case of cells in State 2, 40 mm NaF
was present in order to prevent dephosphorylation of phos-
phoproteins. LHCI–PSI supercomplexes were isolated from
thylakoids (0.8 mgÆmL
)1
Chl) by solubilization with 0.9%
DDM followed by sucrose density gradient centrifugation
as detailed in Kargul et al. [16]. This procedure produced
three Chl-containing bands, F1–F3, where F3 consists of
the LHCI–PSI supercomplex as shown previously [16].
Protein analyses were conducted using SDS ⁄ PAGE,
immunoblotting with antiphosphothreonine serum (Zymed
Laboratories Inc., South San Francisco, CA, USA) [16]
and by tandem MS (see below).
Mass spectroscopy
For protein identification, the procedures of in-gel digestion
and peptide extraction were made as described previously
[22]. Phosphorylated peptides were obtained after treatment
of the isolated thylakoids by trypsin, conversion of the
released peptides to methyl esters by methanolic HCl and
following enrichment of the phosphopeptides by IMAC as
described earlier [21]. Electrospray ionization tandem MS
was performed on a hybrid spectrometer Q-STAR Pulsar I
(Applied Biosystems, Foster City, CA, USA) equipped with
a nano-electrospray ion source (MDS Protana, Odense,
Denmark). Collision-induced dissociation of selected pre-
cursor ions was performed with manual control of collision
energy during spectrum acquisition.
Electron microscopy and densitometry
All samples were stained with 2% (w ⁄ v) uranyl acetate and
imaged using a Philips CM100 electron microscope (FEI
Company, Eindhoven, the Netherlands) at a calibrated mag-
nification of · 50 850. Micrographs, which displayed no dis-
cernible drift or astigmatism, were digitized using a Leafscan
45 densitometer at a step size of 10 lm and transferred to a
networked cluster of Linux-based PC workstations.
Image processing
The densitometry resulted in a sampling frequency of
1.97 A
˚
per pixel on the specimen scale. All subsequent pro-
cessing was performed using the imagic-v software environ-
ment [34,35]. The first minima of the micrographs’ power
spectra were measured to be in the range of 20.5–21.8 A
˚
.
No correction was made for the contrast transfer function.
Datasets consisting of 10 933 and 5195 particle images for
State 1 LHCI–PSI (S1–F3) and State 2 LHCI–PSI (S2–F3)
samples, respectively, were compiled by interactively select-
ing all possible single particles from the micrographs. Mul-
tivariate statistical analyses and reference-free alignments
identified a number of subpopulations within each dataset
[34,35]. Each of these subpopulations was extracted from
the total data set and treated de novo, gaining initial two-
dimensional class averages and then iterative refinement fol-
lowed in order to obtain improved class averages. Standard
molecular modelling programs were used to visualize the
protein data bank file, 1qzv.pdb, of the higher plant LHCI–
PSI structure [12]. The views obtained were subsequently
overlaid onto the improved two-dimensional class averages
by visual inspection.
Acknowledgements
We thank Jun Minagawa (Hokkaido University,
Japan) for donating the Chlamydomonas psbD-His
Phospho-CP29 and state transitions J. Kargul et al.
4804 FEBS Journal 272 (2005) 4797–4806 ª 2005 FEBS
strain and preliminary CP29 mutant line. For financial
support, JB acknowledges the Biotechnology and Bio-
logical Sciences Research Council (BBSRC). AV is
grateful for support by grants from the Swedish
Research Council for Environment, Agriculture and
Space Planning (Formas), Nordiskt Kontaktorgan fo
¨
r
Jordbruksforskning (NKJ) and Graduate Research
School in Genomics and Bioinformatics (FGB). JN is
a Royal Society University Research Fellow.
References
1 Bonaventura C & Myers J (1969) Fluorescence and
oxygen evolution from Chlorella pyrenoidosa. Biochim
Biophys Acta 184, 366–383.
2 Horton P & Black MT (1980) Activation of adenosine
5¢ triphosphate-induced quenching of pea chlorophyll
fluorescence by reduced plastoquinone. The basis of
state I–state II transitions in chloroplasts. FEBS Lett
119, 141–144.
3 Allen JF, Bennett J, Steinback KE & Arntzen CJ (1981)
Chloroplast protein phosphorylation couples plastoqui-
none redox state to distribution of excitation energy
between photosystems. Nature 291, 25–29.
4 Depe
`
ge N, Bellafiore S & Rochaix J-D (2003) Role of
chloroplast protein kinase STT7 in LHCII phosphoryla-
tion and state transition in Chlamydomonas. Science
299, 1572–1575.
5 Bellafiore S, Barneche F, Peltier G & Rochaix J-D
(2005) State transitions and light adaptation require
chloroplast thylakoid protein kinase STN7. Nature 433,
892–895.
6 Haldrup A, Jensen PE, Lunde C & Scheller HV (2001)
Balance of power: a view of the mechanism of
photosynthetic state transitions. Trends Plant Sci 6,
301–305.
7 Kruse O (2001) Light-induced short-term adaptation
mechanisms under redox control in the PS II–LH CII
supercomplex: LHC II state transitions and PS II repair
cycle. Naturwissenschaften 88, 284–292.
8 Zer H & Ohad I (2003) Light, redox state, thylakoid-
protein phosphorylation and signaling gene expression.
Trends Biochem Sci 28, 467–470.
9 Allen JF (2003) State transitions – a question of bal-
ance. Science 299, 1530–1532.
10 Fleishmann MM, Ravanel S, Delosme R, Olive J, Zito
F, Wollman F-A & Rochaix J-D (1999) Isolation and
characterization of photoautotrophic mutants of Chla-
mydomonas reinhardtii deficient in state transition. J Biol
Chem 274, 30987–30994.
11 Lunde C, Jensen PE, Haldrup A, Knoetzel J & Scheller
HV (2000) The PSI-H subunit of photosystem I is essen-
tial for state transitions in plant photosynthesis. Nature
408, 613–615.
12 Ben-Shem A, Frolow F & Nelson N (2003) Crystal
structure of plant photosystem I. Nature 426, 630–635.
13 Zhang S & Scheller HV (2004) Light-harvesting complex
II binds to several small subunits of photosystem I.
J Biol Chem 279, 3180–3187.
14 Jensen PE, Haldrup A, Zhang S & Scheller HV (2004)
The PSI-O subunit of plant photosystem I is involved in
balancing the excitation pressure between the two
photosystems. J Biol Chem 279, 24212–24217.
15 Bulte
´
L, Gans P, Rebe
´
ille F & Wollman F-A (1990)
ATP control on state transitions in vivo in Chlamydomo-
nas reinhardtii. Biochim Biophys Acta 1020, 72–80.
16 Kargul J, Nield J & Barber J (2003) Three-dimensional
reconstruction of a light-harvesting complex I–photosys-
tem I (LHCI–PSI) supercomplex from the green alga
Chlamydomonas reinhardtii. J Biol Chem 278, 16135–
16141.
17 Bennett J (1991) Protein-phosphorylation in green plant
chloroplasts. Annu Rev Plant Physiol Plant Mol Biol 42,
281–311.
18 Croce R, Morosinotto T, Castelletti S, Breton J & Bassi
R (2002) The Lhca antenna complexes of higher plants
photosystem I. Biochim Biophys Acta 1556, 29–40.
19 Storf S, Stauber EJ, Hippler M & Schmid VHR (2004)
Proteomic analysis of the photosystem I light-harvesting
antenna in tomato (Lycopersicon esculentum). Biochem-
istry 43, 9214–9224.
20 Altschul SF, Madden TL, Schaffer AA, Zhang J, Zhang
Z, Miller W & Lipman DJ (1997) Gapped BLAST and
PSI-BLAST: a new generation of protein database
search programs. Nucleic Acids Res 2, 3389–3402.
21 Turkina MV, Villarejo A & Vener AV (2004) The tran-
sit peptide of CP29 thylakoid protein in Chlamydomonas
reinhardtii is not removed but undergoes acetylation and
phosphorylation. FEBS Lett 564, 104–108.
22 Carlberg I, Hansson M, Kieselbach T, Schroder WP,
Andersson B & Vener AV (2003) A novel plant protein
undergoing light-induced phosphorylation and release
from the photosynthetic thylakoid membranes. Proc
Natl Acad Sci USA 100, 757–762.
23 Aro EM, Rokka A & Vener AV (2004) Determination
of phosphoproteins in higher plant thylakoids. Methods
Mol Biol 274, 271–286.
24 Hunter AP & Games DE (1994) Chromatographic and
mass spectrometric methods for the identification of
phosphorylation sites in phosphoproteins. Rapid Com-
mun Mass Spectrom 8, 559–570.
25 Stauber EJ, Fink A, Markert C, Kruse O, Johan-
ningmeier U & Hippler M (2003) Proteomics of
Chlamydomonas reinhardtii light-harvesting proteins.
Eukaryot Cell 2, 978–994.
26 Tokutsu R, Teramoto H, Takahashi Y, Ono TA &
Minagawa J (2004) The light-harvesting complex of
photosystem I in Chlamydomonas reinhardtii: protein
J. Kargul et al. Phospho-CP29 and state transitions
FEBS Journal 272 (2005) 4797–4806 ª 2005 FEBS 4805
composition, gene structures and phylogenic implica-
tions. Plant Cell Physiol 45, 138–145.
27 Takahashi Y, Yasui TA, Stauber EJ & Hippler M
(2004) Comparison of the subunit compositions of the
PSI–LHCI supercomplex and the LHCI in the green
alga Chlamydomonas reinhardtii. Biochemistry 43,
7816–7823.
28 Hankamer B, Barber J & Boekema EJ (1997) Structure
and membrane organization of photosystem II in green
plants. Annu Rev Plant Physiol Plant Mol Biol 48,
641–671.
29 Yakushevska AE, Keegstra W, Boekema EJ, Dekker
JP, Andersson J, Jansson S, Ruban AV & Horton P
(2003) The structure of photosystem II in Arabidopsis:
localization of the CP26 and CP29 antenna complexes.
Biochemistry 42, 608–613.
30 Liu Z, Yan H, Wang K, Kuang T-Y, Zhang J, Gui L,
An X & Cheng W (2004) Crystal structure of spinach
major light-harvesting complex at 2.72 A
˚
resolution.
Nature 428, 287–292.
31 Testi MG, Croce R, Polverino-De Laureto P & Bassi R
(1996) A CK2 site is reversibly phosphorylated in the
photosystem II subunit CP29. FEBS Lett 399, 245–250.
32 Hansson M & Vener AV (2003) Identification of three
previously unknown in vivo protein phosphorylation
sites in thylakoid membranes of Arabidopsis thaliana.
Mol Cell Proteomics 2, 550–559.
33 Sugiura M, Inoue Y & Minagawa J (1998) Rapid and
discrete isolation of oxygen-evolving His-tagged photo-
system II core complex from Chlamydomonas reinhardtii
by Ni
2+
affinity column chromatography. FEBS Lett
426, 140–144.
34 van Heel M, Gowen B, Matadeen R, Orlova EV, Finn
R, Pape T, Cohen D, Stark H, Schmidt R, Schatz M
et al. (2000) Single particle electron cryo-microscopy:
towards atomic resolution. Q Rev Biophys 33, 307–369.
35 Ruprecht J & Nield J (2001) Determining the structure
of biological macromolecules by transmission electron
microscopy, single particle analysis and 3D-reconstruc-
tion. Prog Biophys Mol Biol 75, 121–164.
Phospho-CP29 and state transitions J. Kargul et al.
4806 FEBS Journal 272 (2005) 4797–4806 ª 2005 FEBS