Báo cáo khoa học: Conformational studies of a hyperthermostable enzyme potx
Bạn đang xem bản rút gọn của tài liệu. Xem và tải ngay bản đầy đủ của tài liệu tại đây (416.56 KB, 13 trang )
Conformational studies of a hyperthermostable enzyme
Sotirios Koutsopoulos
1
, John van der Oost
2
and Willem Norde
1,3
1 Laboratory of Physical Chemistry and Colloid Science, Wageningen University, the Netherlands
2 Laboratory of Microbiology, Wageningen University, the Netherlands
3 Department of Biomedical Engineering, University Medical Center Groningen, the Netherlands
Hyperthermophilic microorganisms predominantly
belong to the Archaea, the third phylogenetic domain
of life [1]. They flourish in environments of extreme
temperatures even higher than 100 °C, which until
recently were considered as incompatible with life. No
multicellular organisms have been found to tolerate
temperatures above 60 °C and no unicellular eukarya
have been discovered to withstand long-term exposure
to temperatures higher than % 70 °C. Pyrococcus furio-
sus is an anaerobic hyperthermophile which was dis-
covered in geothermally heated marine sediments at
100 °C [2]. It is a very efficient consumer of the
organic material found on the sea floor such as pro-
teins, peptides and sugar mixtures (e.g. maltose, cello-
biose, oligosaccharides and starch), which are
fermented and used as carbon source. P. furiosus has
a large collection of hyperthermostable enzymes
which may be used in important applications in
biotechnology. One of them, the extracellular endo-
b-1,3-glucanase (LamA), has been isolated and charac-
terized [3]. LamA hydrolyzes 1,3-b-glycosyl bonds of
polysaccharides such as laminarin. The temperature of
maximum activity is 104 °C and the optimal pH % 6.5.
LamA is practically inactive at room temperature and
shows detectable activity only above 30 °C [4].
The intrinsic fluorescence from LamA’s tryptophans
can be used to study its structural characteristics and
identify conformational states upon heat and chemical
treatment [5]. The fluorescence emission spectrum of
proteins depends on the microenvironment of the
fluorescent amino acids. Fluorescence spectroscopy is a
useful technique for studying partially folded or unfol-
ded proteins; NMR and X-ray crystallography are
much less practical due to the structural heterogeneity
and mobility of the polypeptide chain. In the steady-
state fluorescence measurements the sample is
Keywords
circular dichroism; hyperthermostable
protein; steady-state fluorescence; time-
resolved fluorescence and anisotropy
Correspondence
S. Koutsopoulos, Center for Biomedical
Engineering, Massachusetts Institute of
Technology, NE47-Room 307, 500
Technology Square, Main Street,
Cambridge, MA 02139-4307, USA
Fax: +1 617 258 5239
Tel: +1 617 324 7612
E-mail:
(Received 15 July 2005, accepted 30 August
2005)
doi:10.1111/j.1742-4658.2005.04941.x
The structural features of the hyperthermophilic endo-b-1,3-glucanase from
Pyrococcus furiosus were studied using circular dichroism, steady-state and
time-resolved fluorescence spectroscopy and anisotropy. Upon heat and
chemical treatment the folded and denatured states of the protein were
characterized by distinguishable spectral profiles that identified a number
of conformational states. The fluorescence methods showed that the spec-
tral differences arose from changes in the local environment around specific
tryptophan residues in the native, partially folded, partially unfolded and
completely unfolded state. A structural resemblance was observed between
the native protein and the structurally perturbed state which resulted after
heat treatment at 110 °C. The enzyme underwent disruption of the native
secondary and tertiary structure only after incubation at biologically extre-
mely high temperatures (i.e. 150 °C), whilst in the presence of 8 m of guani-
dine hydrochloride the protein was partially unfolded.
Abbreviations
ANS, 8-anilino naphthalene-1-sulfonic acid; CD, circular dichroism; GdnHCl, guanidine hydrochloride; LamA, endo-b-1,3-glucanase.
5484 FEBS Journal 272 (2005) 5484–5496 ª 2005 FEBS
constantly illuminated and the emission is recorded.
Time-resolved measurements are performed with expo-
sure of the sample to a picosecond light pulse and
recording of the intensity decay in the nanosecond
timescale [6]. The fluorescence and anisotropy decays
contain information on the shape, rigidity, compact-
ness, fluorophore dynamics and rotational motion of
the protein [6,7]. Even in the absence of structural
data, valuable information about the local and global
dynamics of LamA can be inferred from inspection of
the fluorescence decays alone.
In this study, the structural characteristics of the
hyperthermostable LamA are investigated at extreme
temperatures and high concentrations of guanidine
hydrochloride (GdnHCl). The spectroscopic analysis
will enable us to characterize the thermally and chem-
ically denatured states of LamA. Using a combination
of circular dichroism, steady-state and time-resolved
spectroscopy and anisotropy we will show that it is
possible to observe conformations of partially struc-
tured, partially unfolded and completely unfolded
states, depending on the treatment.
Results
The hyperthermophilic LamA is a single-domain protein
with a molar mass of 30 085 Da. Experimental data
from mass spectroscopy (MALDI TOF) and size exclu-
sion chromatography showed that LamA in solution is
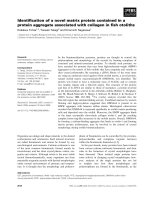
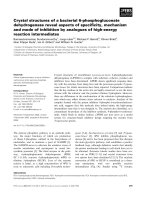
a monomer. LamA contains 11 tryptophans homogen-
ously distributed over the amino acid sequence (Fig. 1).
For the graphical representation a molecular simulation,
software was utilized [8] assuming structural similarity
of LamA with a homologous 1,3-1,4-b-glucanase from
Bacillus licheniformis and with a j-carrageenase frag-
ment from Pseudoalteromonas carrageenovora whose
crystal structures are known (PDB entries 1GBG and
1DYP, respectively) [9,10]. According to the model, the
shape of LamA is globular-ellipsoid with calculated
dimensions of 4.6 nm · 3.2 nm · 3.4 nm. For the selec-
tion of the best model preliminary analysis of the NMR
solution structure of LamA as well as spectroscopic data
from this work were taken into consideration. Investiga-
tion of proteins with multiple tryptophans results in
emission spectra that represent the contribution from all
emitting groups. Nevertheless, valuable information can
be obtained from analyses of the conformational states
of LamA upon heat treatment and in the presence of
GdnHCl. At the experimental conditions employed in
this work LamA shows a calorimetric transition at
109 °C which represents denaturation [11] and main-
tains its structural integrity at high concentrations of
GdnHCl up to 5.5 m.
Circular dichroism (CD)
The secondary and tertiary structural features of
LamA were studied by far- and near-UV CD, respect-
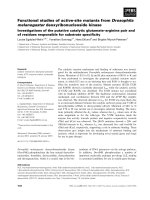
ively. As may be seen in Fig. 2 (top, curve a), the far-
UV CD spectrum of native LamA exhibits a broad
negative peak at 217 nm and a positive absorption dif-
ference band from % 207 nm. This spectral profile is
characteristic of proteins predominantly consisting of
b-structures. The spectral analysis revealed that native
LamA consists of b-sheets and turns up to % 96%
(Table 1). Heating the protein solution up to 98 °C
followed by cooling resulted in restoring the spectral
ellipticity (spectrum coincided with curve a in the top
panel of Fig. 2). However, heating at and above the
Fig. 1. Graphic display of the structure of LamA using molecular
modeling. The enzymatic cleft is located on the top of the structural
representation. Secondary structural elements (A) and the position
(B) of the tryptophans in the three-dimensional structure (graphs
were generated with Swiss PDB Viewer).
S. Koutsopoulos et al. CD, fluorescence and anisotropy of LamA
FEBS Journal 272 (2005) 5484–5496 ª 2005 FEBS 5485
denaturation temperature (e.g. 110 °C) did not result
in recovering the spectral features of the native protein
(Fig. 2; top, curve b). Notably, heating at such high
temperatures did not unfold the hyperthermostable
protein. The features of the native state could still be
observed in the denatured sample, illustrating the per-
sistence of a stable network of b-structures up to
% 87%. Monitoring the ellipticity at 220 nm showed
the beginning of the thermal transition which indicated
that at 110 °C (i.e., just above the denaturation point
of the protein) residual secondary structure was still
present (Fig. 2, inset). The CD spectrum of LamA at
110 °C closely resembled the one recorded for the
same sample after cooling to room temperature.
Heat incubation at 150 °C for 30 min resulted in
collapsed secondary structure and the polypeptide
chain appeared to be unordered (Fig. 2; top, curve c).
Severe changes in the secondary structure were also
observed in the presence of 8 m GdnHCl but the effect
could not be quantified (Fig. 2; top, curve d). This
finding is in contrast to a previous study where it was
reported that the presence of 7.9 m GdnHCl did not
alter LamA’s secondary structural characteristics [12].
In the near-UV region the differences between the
native and the thermally denatured states were more
noticable. The CD spectrum of native LamA shows
two minima in ellipticity at % 295 nm and 265 nm.
The bands arose from the aromatic residues fixed in
an asymmetric environment. The CD spectrum of de-
natured LamA after heating at 110 °C resembled the
one of native LamA but the intensities of the bands
were lower. After heat incubation at 150 °C the spec-
trum of LamA had very little and no ellipticity at
295 nm and 262 nm, respectively (Fig. 2; bottom,
curve c), suggesting disruption of the tertiary structure.
In the presence of 8 m GdnHCl the near-UV CD spec-
tral profile of LamA showed decreased ellipticity of
the bands around 295 and 262 nm and increased ellip-
ticity of the positive band around 285 nm (Fig. 2;
bottom, curve d). These changes, although significant,
strongly suggest that even at 8 m GdnHCl the protein
did not completely unfold. These results are in agree-
ment with data reported by Chiaraluce et al. [12].
Steady-state fluorescence spectroscopy
The fluorescence emission spectra of LamA recorded
after excitation at 300 nm are typical for a multitryp-
tophan protein [6]. The native protein shows a maxi-
mum at 335 nm (Fig. 3; curve a). After heating of the
protein solution to 110 °C the maximum intensity shif-
ted to 344 nm. This indicates partial exposure of tryp-
tophan(s) to water, possibly due to a structural
distortion. Incubation at 150 °C shifted the emission
maximum to 356 nm suggesting significant exposure of
tryptophans and possibly collapsed tertiary structure.
Interesting features were also revealed from the
-15
-10
-5
0
5
10
15
20
25
190 200 210 220 230 240 250 260
Wavelength (nm)
[
θ
01 x ]
4-
mc ged(
2
lom
1-
)
(a)
(b)
(c)
(d)
260 280 300 320
-0.4
-0.2
0.0
0.2
0.4
(b)
(d)
(c)
(a)
(c)
(b)
(d)
(a)
[
θ
01 x ]
4-
mc ged(
2
lom
1-
)
Wavelen
g
th (nm)
-15
-10
-5
0
5
10 30 50 70 90 110
Temperature (
o
C)
[
θ
01 x ]
4-
mc ged(
2
lom
1-
)
Fig. 2. Circular dichroism of 0.25 mgÆmL
)1
LamA in 10 mM sodium
phosphate buffer at pH 7.0 in the far-UV (top) and near-UV (bottom)
region of the spectrum. Lines represent: (a) LamA in the native
form, (b) heat denatured at 110 °C, (c) after heat incubation at
150 °C, and (d) in the presence of 8
M GdnHCl. Spectra were recor-
ded at 20 °C. Inset: the thermal transition of LamA monitored by
the molar ellipticity at 220 nm.
Table 1. Secondary structure content of LamA in 0.01 M sodium
phosphate at pH 7.0 in the native state, after heat treatment and in
the presence of 8
M GdnHCl as calculated from CD spectra using
the program
CONTIN.
Sample
a-helix
(%)
b-sheet
(%)
b-turn
(%)
Unordered
(%)
LamA in solution 0.5 ± 0.3 74.5 ± 2.5 21.0 ± 2.0 4.0 ± 2.0
LamA (110 °C) 4.0 ± 1.2 65.0 ± 3.0 22.0 ± 1.5 10.0 ± 4.2
LamA (150 °C) 1.0 ± 0.4 43.0 ± 1.7 17.0 ± 1.0 39.0 ± 2.0
CD, fluorescence and anisotropy of LamA S. Koutsopoulos et al .
5486 FEBS Journal 272 (2005) 5484–5496 ª 2005 FEBS
respective fluorescence intensities. Heating LamA to
110 °C resulted in decreased emission. The effect of
thermal treatment was more pronounced after incuba-
tion at 150 °C and subsequent recording of the fluores-
cence emission at 20 °C (i.e., the intensity decreased
threefold as compared to that of native LamA). The
emission maximum of LamA in 8 m GdnHCl was
observed at 350 nm with two-fold increased intensity
(Fig. 3).
8-Anilino naphthalene-1-sulfonic acid (ANS)
fluorescence spectroscopy measurements
Coherence and integrity of the external surface of
LamA upon thermal and chemical treatment were tes-
ted by measuring the exposure of the hydrophobic
groups to the solvent. The fluorescence intensity of
ANS is quenched in aqueous solution, but in contact
with nonpolar groups a striking emission enhancement
is observed [13,14]. Depending on the treatment, the
interaction of LamA with ANS resulted in notable dif-
ferences in the fluorescence emission of the probe
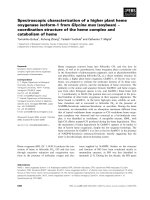
(Fig. 4). Heating LamA at 110 °C resulted in 12-fold
increased intensity relative to that of the native state.
After incubation at 150 °C the intensity was similar to
that of native LamA but the ANS emission maximum
was clearly blue-shifted to 460 nm (Fig. 4; curve c)
which suggests increased exposure of hydrophobic
groups. In the presence of 8 m GdnHCl the ANS fluor-
escence could not be measured, probably due to the
interaction of ANS with the denaturant.
Time-resolved fluorescence decay
In an attempt to understand the origin of the differ-
ences observed in the steady-state fluorescence spectra,
we inspected the time-resolved profiles. The decays
were best fitted by five components according to
Eqn (4) (Experimental procedures), except in the case
of LamA in 8 m GdnHCl where four exponents were
sufficient. The lifetimes (s) and their fractional contri-
butions (a) associated with the decays are summarized
in Table 2. Heat and chemical treatment of LamA
(Fig. 5; curves b–d) resulted in fluorescence decays that
relaxed at longer lifetimes as compared to that of the
native state (Fig. 5; curve a). This can also be seen in
Table 2, from the increased contribution (a
i
) of the
longest lifetimes (s
i
) on the average fluorescence life-
times, <s>. LamA thermally treated at 110 °C has a
dynamic fluorescence profile that clearly differs from
that of the native protein. The differences are striking
as compared to the information obtained from the
steady-state spectra (Fig. 3; curves a and b). Compar-
ison of the decays justifies the dynamic diversity of
the tryptophans’ local microenvironment owing to
conformational changes. Heat treatment at 110 °C and
incubation at 150 °C resulted in similar decay profiles.
However, inspection of the resolved parameters shows
that after heat treatment at 110 °C, the short fluores-
cence lifetimes, s
1
–s
3
, are shorter relative to those
found for LamA after incubation at 150 °C. The pic-
ture is reversed at longer lifetimes (Table 2). In the
0
20
40
60
80
100
120
410 460 510 560
Wavelen
g
th (nm)
).u.a( ytisnetni ecnecseroulf SNA
(b)
(c)
(d)
(a)
Fig. 4. Binding of ANS to LamA before and after heat and chemical
treatment. Spectra of 0.1 mgÆmL
)1
LamA in sodium phosphate buf-
fer at pH 7.0 in the presence of 50 l
M ANS were recorded at
20 °C after excitation at 380 nm. The lines represent the ANS fluor-
escence of LamA (a) in the native state, (b) thermally denatured at
110 °C, (c) incubated at 150 °C, and (d) in the presence of 8
M
GdnHCl.
0
50
100
150
200
250
300
350
305 325 345 365 385
Wavenumber (nm)
).u.a( ytisnetnI noissimE ecneseroulF
(a)
(b)
(c)
(d)
Fig. 3. Normalized steady-state fluorescence emission spectra of
LamA in sodium phosphate buffer at pH 7.0. Curve (a) refers to the
native state, (b) and (c) to LamA after heat treatment at 110 °Cand
150 °C, respectively, and (d) in the presence of 8
M GdnHCl. Spec-
tra of 0.025 mgÆmL
)1
LamA were recorded at 20 °C; the excitation
wavelength was 300 nm.
S. Koutsopoulos et al. CD, fluorescence and anisotropy of LamA
FEBS Journal 272 (2005) 5484–5496 ª 2005 FEBS 5487
presence of 8 m GdnHCl the decay differs from that of
native and heat-treated LamA. In this case, the data
analysis showed that the shortest and the longest life-
times observed in the other samples could not be
resolved. Instead, the major contribution to the decay
arises from tryptophans relaxing at medium and relat-
ively long lifetimes.
Time-resolved anisotropy decay
Two exponential terms were required to describe the
anisotropy decays of LamA according to Eqn (6).
The fitting parameters are summarized in Table 3. The
fluorescence is mainly depolarized by the rapid local
motion of the tryptophans and by the overall rotation
of the entire protein. The diversity of the anisotropy
decays observed for each sample (Fig. 6) suggests a
different depopulation mechanism of the excited state
depending on the protein conformation. The aniso-
tropy of native LamA decays slower relative to that
after heat and chemical treatment. Data analysis
revealed two rotational correlation times at /
1
¼
260 ps and /
2
¼ 18.9 ns with amplitudes b
1
¼ 0.038
and b
2
¼ 0.122, respectively. The shortest correlation
time is associated with the rapid internal flexibility of a
population of indole rings, which depends on the
microenvironment that the tryptophans reside in, in
the protein. The longer component is relevant to the
rotational diffusion of the protein from which the
hydrodynamic size may be calculated using the
Einstein–Stokes equation (u ¼ 4pR
3
h
g=3kT; where g is
the viscosity of the medium, k is the Boltzmann con-
stant and T is the absolute temperature). The hydro-
dynamic radius, R
h
, of native LamA was found to be
2.63 nm. This value is in good agreement with the pro-
tein size of the model, especially if the size of the
hydration layer surrounding the protein in solution is
taken into account. After thermal denaturation at
110 °C, the anisotropy decay was found to be consid-
erably different from that observed for the native state
(Fig. 6; curves a and b). This is also shown in the
short correlation time resolved at /
1
¼ 434 ps which is
longer than that observed in native LamA but which
has a larger amplitude. The longest rotational correla-
tion time is slightly longer than that of the native state
but the difference in the calculated hydrodynamic radii
does not document size expansion (Table 3). After
incubation at 150 °C and in the presence of 8 m
GdnHCl, the anisotropy decayed very fast and calcula-
tions on the size of the protein could not be implemen-
ted. In the case of incubation at 150 °C the longest
correlation time, which was observed in the native
state and in LamA after heating at 110 °C, could not
Table 2. Calculated fluorescence decay parameters of LamA in sodium phosphate buffer solution 0.01 M at pH 7.0 upon excitation at 295 nm. Standard errors for the calculation of the
decay components are given in parentheses.
Sample a
1
(%) s
1
(ns) a
2
(%) s
2
(ns) a
3
(%) s
3
(ns) a
4
(%) s
4
(ns) a
5
(%) s
5
(ns) <s> (ns)
LamA in solution 32.0 (± 2.6) 0.028 (± 0.004) 27.6 (± 1.3) 0.233 (± 0.034) 30.7 (± 2.8) 0.612 (± 0.046) 9.0 (± 0.8) 1.463 (± 0.053) 0.6 (± 0.3) 5.521 (± 0.091) 0.43
LamA (110 °C) 31.8 (± 2.4) 0.037 (± 0.004) 26.4 (± 2.2) 0.355 (± 0.044) 22.2 (± 2.5) 1.278 (± 0.072) 15.6 (± 1.7) 4.051 (± 0.066) 3.9 (± 0.4) 8.235 (± 0.064) 1.34
LamA (150 °C) 27.2 (± 3.0) 0.051 (± 0.006) 19.6 (± 1.4) 0.348 (± 0.037) 25.2 (± 1.9) 1.455 (± 0.040) 24.1 (± 2.6) 3.831 (± 0.035) 3.8 (± 2.5) 7.761 (± 0.083) 1.67
LamA in 8
M
GdnHCl
15.4 (± 3.1) 0.282 (± 0.018) 13.4 (± 1.5) 0.712 (± 0.059) 32.2 (± 3.6) 1.737 (± 0.075) 39.0 (± 2.7) 3.981 (± 0.062) – – 2.25
CD, fluorescence and anisotropy of LamA S. Koutsopoulos et al .
5488 FEBS Journal 272 (2005) 5484–5496 ª 2005 FEBS
be resolved. Instead, a medium-lived component was
found at 3.8 ns. It should be noted that the long rota-
tional correlation time observed for LamA in the
presence of 8 m GdnHCl should be corrected by a
factor 2.3 when compared to the respective lifetimes of
LamA in guanidine-free solutions [15]. This is due to
the difference between the viscosity of the solution in
the presence and in the absence of 8 m GdnHCl, i.e.,
Table 3. Anisotropy decay parameters of LamA in sodium phosphate buffer solution 0.01 M at pH 7.0. Values in parentheses are the range
at 67% confidence intervals. ND, not determined.
Sample b
1
/
1
(ns) b
2
/
2
(ns) R
h
(nm) r
o
h
LamA in solution 0.038 (0.027–0.048) 0.26 (0.24–0.28) 0.122 (0.111–0.132) 18.90 (17.97–19.84) 2.63 (2.59–2.68) 0.16 23.5° (21.2–24.9)
LamA (110 °C) 0.054 (0.043–0.067) 0.43 (0.41–0.46) 0.071 (0.061–0.084) 19.39 (18.64–20.14) 2.66 (2.62–2.69) 0.13 32.4° (31.7–32.9)
LamA (150 °C) 0.098 (0.092–0.115) 0.34 (0.32–0.36) 0.062 (0.054–0.075) 3.83 (3.67–3.98) – 0.16 39.7° (39.4–40.4)
LamA in 8
M
GdnHCl
0.095 (0.063–0.120) 2.14 (1.93–2.34) 0.016 (0.003–ND) 17.96 (12.32–23.59) – 0.11 49.0° (ND)52.9)
1
10
100
1000
10000
100000
1000000
0 5 10 15 20 25 30
Time (ns)
ytisnetnI ecnecseroulF
(a)
(b)
(c)
(d)
-0,04
0
0,04
0102030
-0,04
0
0,04
0102030
-0,04
0
0,04
0102030
-0,04
0
0,04
Residuals
0102030
-0,3
0
0,3
0102030
-0,3
0
0,3
0102030
-0,3
0
0,3
0102030
-0,3
0
0,3
0102030
(a)
(c)
(b)
(d)
(a)
(c)
(b)
(d)
Autocorrelation
Fig. 5. Time-resolved fluorescence decay of
0.25 mgÆmL
)1
LamA in sodium phosphate
buffer pH 7.0 at 20 °C on excitation at
295 nm. The y axis is in a logarithmic scale.
The lines represent the fluorescence decay
of (a) LamA in the native state, (b) heated at
110 °C, (c) incubated at 150 °C, and (d) in
the presence of 8
M GdnHCl.
S. Koutsopoulos et al. CD, fluorescence and anisotropy of LamA
FEBS Journal 272 (2005) 5484–5496 ª 2005 FEBS 5489
2.39 cP and 1.02 cP at 20 °C, respectively [16]. Short life-
times are not affected by the viscosity of the medium.
The fundamental anisotropy, r
o
, representing the
total anisotropy in the absence of rotation (at t ¼ 0),
is equal to the sum of the amplitudes, b
i
, of the fluoro-
phores. For excitation at 295 nm the theoretical time-
zero anisotropy is about 0.3 [6]. This is higher than the
values obtained for the tryptophans in LamA. Depend-
ing on the protein conformation and the freedom of
the tryptophans to rotate in the protein matrix, the r
o
may be reduced as a result of subpicosecond motions
that are too fast to be detected [17,18], noncollinearity
of the absorption and emission dipoles [6,18,19], and
intertryptophan energy migration [20,21].
The rotation angle, h, of the tryptophans attached in
the protein backbone may be calculated from the
amplitude b
1
of the fast motion [7]:
1 À
b
fast
r
o
¼
3 cos
2
h À 1
2
ð1Þ
The average cones of rotation of the tryptophans in
LamA (Table 3) increase from 23.5° in the native state
to 32.4° in the thermally denatured state, to 39.7° in
the unfolded state after incubation at 150 °C, to 49.0°
in the perturbed conformation in the presence of 8 m
GdnHCl. The increase of the rotational freedom in the
heat and chemically treated LamA illustrates the fast
anisotropy decays observed in Fig. 6.
0,00
0,05
0,10
0,15
0,20
0 5 10 15 20 25 30
Time (ns)
yportosinA
(a)
(b)
(c)
(d)
-10
0
10
0102030
-10
0
10
0102030
-10
0
10
0102030
-10
0
10
0102030
-0,2
0
0,2
0102030
-0,2
0
0,2
0102030
-0,2
0
0,2
0102030
-0,2
0
0,2
0102030
(a)
(c)
(b)
(d)
(a)
(c)
(b)
(d)
Residuals
Autocorrelation
Fig. 6. Time-resolved anisotropy of
0.25 mgÆmL
)1
LamA in sodium phosphate
buffer at pH 7.0 at 20 °C. The decays
represent (a) native LamA, (b) LamA heat
treated at 110 °C, (c) after incubation at
150 °C, and (d) in the presence of 8
M
GdnHCl. The lines represent fitting of the
anisotropy exponential decay with two
components as shown in Table 3.
CD, fluorescence and anisotropy of LamA S. Koutsopoulos et al .
5490 FEBS Journal 272 (2005) 5484–5496 ª 2005 FEBS
Discussion
The hyperthermostable LamA shows a heat denatura-
tion transition at 109 °C and only a partly unfolded
structure at 7.9 m GdnHCl [11,12]. In this study, the
structural characteristics of LamA were thoroughly
investigated upon thermal and chemical treatment. The
spectroscopic data suggested different conformations
depending on the temperature of the treatment. It was
shown that after cooling to room temperature, the
thermally denatured LamA did not refold to the native
conformation but to a compact form with defined
structure that is different from that of the native and of
the chemically denatured states. Such a conformation
resembles the features of a molten globule exhibiting
native-like secondary structure but different tertiary
structure. LamA’s irreversible denaturation is con-
firmed by calorimetric experiments (S. Koutsopoulos,
J. van der Oost & W. Norde, unpublished data). Both
the secondary and tertiary structures irreversibly col-
lapsed only after prolonged heating at 150 °C. The
interaction of LamA with GdnHCl solutions did not
show significant changes in the spectroscopic character-
istics of the protein up to % 5.5 m GdnHCl. Severe
changes in LamA’s secondary and tertiary structure
were observed in the presence of 8 m GdnHCl.
Inspection of the far-UV CD spectra showed minor
changes in the secondary structure of LamA upon heat
denaturation at 110 °C while significant changes were
observed upon incubation at 150 °C and in the pres-
ence of 8 m GdnHCl. Moreover, the near-UV bands at
262 nm and 295 nm of LamA were notably decreased
upon heat treatment at 110 °C, and significantly sup-
pressed after heat incubation at 150 °C or in the pres-
ence of 8 m GdnHCl. The intensities of the bands
decrease when aromatic residues become more distant
from each other due to loose structure.
The conclusions drawn from fluorescence spectro-
scopy are in line with CD. The fluorescence emission
of native LamA showed maximum intensity at 335 nm
indicating moderate interaction of the tryptophans
with the solvent. The emission profile of thermally
denatured LamA at 110 °C suggests that cooling to
room temperature did not result in refolding to the
native conformation but rather to a native-like form.
The red-shift in the emission maximum indicates
increased tryptophan exposure. It should be noted
that when the emission maxima are correlated with
tryptophan exposure to water, the interaction often
originates from penetration of water molecules into the
interior of the protein. This is true especially for struc-
tural distortions induced by heat treatment. In such
cases, the red-shift of the emission originates from
larger accessibility of tryptophans to both internal and
external water. The red-shift to 356 nm, which was
observed upon heat incubation at 150 °C, suggests
protein unfolding. In the presence of 8 m GdnHCl the
emission maximum was observed at 350 nm which is
red-shifted as compared to the respective maximum
of the native state, but not as much as that of the
unfolded protein.
Analysis of the fluorescence properties of multitryp-
tophan proteins is a difficult task even when the struc-
ture is known. The emission spectrum represents the
average of local quenching and complicated resonance
energy transfer phenomena. Apart from the influence
of the polar solvent, which decreases the fluorescence
emission of exposed tryptophans, in the protein matrix
tryptophans can be quenched by neighboring carboxyl
groups, histidine, methionine, phenylalanine, lysine,
etc. [22]. Energy transfer from one tryptophan to
another tryptophan or to a tyrosine decreases the
fluorescence quantum yield of the donor [23]. LamA
has a single cysteine that is likely to play a critical role
as sulfhydryl groups are notorious quenchers of the
proximal tryptophans [24]. After thermal denaturation
at 110 °C, the fluorescence intensity moderately
decreased while incubation at 150 °C resulted in sub-
stantial three-fold decreased emission. This observation
and the red-shift of the emission maximum at 356 nm
suggest that in this conformation, the tryptophans are
quenched, possibly due to contact with water. The
residual intensity may imply that even in the case of
an extensively hydrated unstructured backbone it is
possible that tryptophan(s) belong to a locally struc-
tured domain. The twofold increase of the fluorescence
intensity in the presence of 8 m GdnHCl probably ori-
ginates from relocation of tryptophans in the three
dimensional structure of the protein. In the new posi-
tions the interactions of the tryptophans with quench-
ing groups are weaker and ⁄ or the intertryptophan
distances are longer than that required for energy
transfer [25,26]. Both mechanisms increase the fluores-
cence quantum yield, which overwhelms the quenching
effect of the solvent-exposed tryptophans. Hence, from
both the emission maximum and the fluorescence
intensity it is concluded that even at 8 m GdnHCl
there is a residual structure in LamA that involves
buried tryptophan residue(s).
Notable differences in LamA before and after ther-
mal and chemical treatment were also observed upon
interaction with ANS (Fig. 4). The heat-denatured
state is probably characterized by a structural distor-
tion from which dissolved ANS accessed hydrophobic
groups that were previously located in the interior of
the protein [27]. This interaction led to a significantly
S. Koutsopoulos et al. CD, fluorescence and anisotropy of LamA
FEBS Journal 272 (2005) 5484–5496 ª 2005 FEBS 5491
increased intensity. The unfolded state upon incuba-
tion of LamA at 150 °C was justified by the blue-shift
of the ANS emission maximum.
Time-resolved fluorescence gave insight into the
tryptophans’ relaxation dynamics. Conformational
changes were justified by simple inspection of the fluor-
escence decays. The fluorescence of the heat- and chem-
ically-treated LamA decayed at longer lifetimes. This is
typical for proteins with solvent exposed tryptophans
[28]. Each of the five (four in the presence of 8 m
GdnHCl), lifetimes, s
i
, resolved represents a class of
tryptophans in a specific microenvironment [29–31],
and the respective pre-exponentials, a
i
, are related to
the fraction of tryptophans in each class [28,32,33]. In
native LamA the extremely short lifetime (28 ps),
which accounts for one third of the total fluorescence
intensity, can be assigned to very efficient energy trans-
fer or to strong static quenching from amino acid(s)
(e.g. cysteine) in the vicinity of the emitting trypto-
phans. The amplitude of the longest lifetime, s
5
,in
native LamA at 5.5 ns probably represents water-
exposed tryptophans and contributes very little to the
total fluorescence. The picture is reversed after heat
and chemical treatment, where the contribution from
the longest lifetimes is significantly increased.
After heating at 110 °C the tryptophans, character-
ized by extremely short-lived relaxation in the native
state, were now decayed at a slightly longer lifetime
(37 ps). Notably, the amplitude, a
1,
of the tryptophans
emitting at the shortest lifetime is similar to that
resolved for native LamA. The amplitude for trypto-
phans that decay at longer lifetimes was markedly
increased, which suggests that the slightly exposed tryp-
tophans of the native protein become more exposed in
the molten globule and therefore more solvent-
quenched.
Studies in helical peptides and in small b-structured
proteins show that the amplitudes for each decay com-
ponent vary with the secondary structure [34,35]. The
fluorescence from tryptophans belonging to an exten-
ded b-conformation decays with significant contribu-
tion from intermediate lifetimes. This is the case for
native LamA. Interestingly, the apparent increase of
a-helices and the decrease of sheets and strands upon
heat treatment at 110 °C and in the presence of 8 m
GdnHCl, as evidenced by far-UV CD, were confirmed
by the time-resolved fluorescence measurements: the
increased pre-exponential term a
5
of the longest
decay time and the decreased contribution of the
intermediate components (i.e., a
2
–a
4
for the native and
a
2
–a
3
for the heat and chemically treated LamA) sug-
gest decreased b-structures and increased helical con-
tent [34].
The contribution, a
i
, of the longest lifetime compo-
nents (s
i
> 3.8 ns) to the total fluorescence signifi-
cantly increased from the native LamA to the
thermally denatured at 110 °C LamA, to the heat
unfolded LamA, to the chemically treated partially
unfolded protein. This order is consistent with the
increased solvent exposure of the tryptophans in the
heat-treated samples as observed in the steady-state
fluorescence spectra. There is a deviation from the
order in the case of LamA in the presence of 8 m
GdnHCl (Fig. 5). This could be due to the significant
contribution from completely exposed tryptophans
(s
5
> 7 ns) of the heat unfolded protein that is absent
in the GdnHCl partially unfolded LamA. However, we
should bear in mind that steady-state measurements
provide an intensity-weighted, time-averaged descrip-
tion of the fluorophore emission and, hence, are pro-
portional not to the most populated state but to the
state that emits most. This trait of steady-state emis-
sion and the fact that specific interactions may elude
time-resolved fluorescence detection and, thus, conceal
a part of the interpretation are additional reasons for
the discrepancy.
An analysis of the time-resolved anisotropy in terms
of protein conformer-lifetime assignments was also
attempted. The rapidly relaxing component in native
LamA, /
1
, can be ascribed to flexibility of the indole
ring in the protein matrix or other local dynamic
events of the tryptophans which cause very fast de-
polarization. Upon heat and chemical treatment, the
tryptophans rotate more freely as a result of rearrange-
ments in the protein matrix around the fluorophore(s).
This is shown in the fractional contribution b
1
of the
short correlation time and the calculated rotation angle
of the tryptophans in Table 2.
The presence of many tryptophans distributed over
the protein backbone is advantageous for the calcula-
tion of the rotational diffusion of a protein in solution.
The rotational properties depend on the orientation of
the dipoles relative to the main symmetry axis and,
hence, a large number of fluorophores ensures that all
orientations are sampled and the pristine rotational
correlation time is determined by the anisotropy decay
[36]. After thermal denaturation at 110 °C, the long
lived component slightly increased to 19.39 ns. In the
completely and partially unfolded states the intra-
molecular interactions and internal structural con-
straints are loosened or lost and, hence, large parts
of the polypeptide chain become solvent exposed.
Therefore, the rotational freedom of the tryptophans
substantially increases and the system loses anisotropy
much faster (Fig. 6; curves c and d). In these cases, the
size of LamA could not be determined from the
CD, fluorescence and anisotropy of LamA S. Koutsopoulos et al .
5492 FEBS Journal 272 (2005) 5484–5496 ª 2005 FEBS
parameters recovered due to hydration of internal pro-
tein segments resulting in largely expanded conforma-
tions. The medium correlation time of 3.8 ns that was
observed in the completely unfolded LamA corres-
ponds to tryptophans trapped locally that just lose
anisotropy faster than the tryptophans in the native
state (Table 3). The medium-lived component (2.1 ns)
observed in the guanidine-treated partially unfolded
LamA emerged at the expense of the shortest pico-
second correlation lifetime. Motions with correlation
times ranging from 1 to 3 ns describe segmental back-
bone fluctuations of the polypeptide chain [37,38].
These motions are important when the protein integ-
rity is disrupted and the protein backbone is solvated
and more flexible.
Data from CD, fluorescence spectroscopy (steady-
state, time-resolved and ANS binding), and anisotropy
were used to probe conformational features of LamA
before and after heat or chemical treatment. It was
suggested that upon heating at 110 °C, the local micro-
environment of the tryptophans resembles but it is not
identical to that of the native state. It is likely that this
state represents a structurally disturbed or locally
unfolded state rather than completely unfolded. The
structural elements may be maintained by a mechan-
ism involving specific local and long-range interactions,
some of which are native-like [39–43]. The interaction
of LamA with 8 m GdnHCl resulted in significant
structural changes but not in complete unfolding. The
protein was partially unfolded with characteristics
clearly distinct from the completely unfolded confor-
mation obtained after incubation at 150 °C.
Experimental procedures
Purification of LamA, treatment and chemicals
The gene encoding LamA (sequence deposited in GenBank:
accession No. AF013169) was isolated from P. furiosus and
after cloning it was overexpressed in Escherichia coli BL21
(DE3) using the T7 expression system [3]. Further purifica-
tion was achieved by size exclusion chromatography in a
Superdex 200 column (Amersham Pharmacia, Piscataway,
NJ, USA). Pure LamA was stored at 4 °C in 0.01 m
sodium phosphate buffer at pH 7.0. The protein concentra-
tion was routinely determined by the absorption at 280 nm.
Controlled heat treatment of LamA was carried out in a
VP-DSC calorimeter (MicroCal Inc., Northampton, MA,
USA). The heating rate was 1 °CÆmin
)1
and after reaching
110 °C the sample was allowed to cool down to room tem-
perature and used for further analyses. Heat incubation for
30 min at 150 °C was performed in a temperature con-
trolled oil bath using thick-walled glass tubes with a lid
capable of withstanding the vapor pressure of water. Chem-
ical denaturation was studied in the presence of extra pure
fluorescence-free GdnHCl (Merck, Rahway, NJ, USA). The
GdnHCl solutions were prepared according to Pace et al.
[44] and the concentration was determined by measuring
their refractive index. LamA was allowed to interact with
GdnHCl overnight at 20 °C.
Circular dichroism
Far- and near-UV CD spectra of 0.25 mgÆmL
)1
LamA in
1 mm and 1 cm quartz cuvettes, respectively, were recorded
in a JASCO J-715 (Tokyo, Japan) spectrophotometer
equipped with a temperature controller (JASCO PTC 348
WI) which was set at 20 °C. Measurements were also
performed at temperatures up to 110 °C in a closed
metal-caged quartz cuvette under pressure to prevent eva-
poration of water. The CD spectra referring to LamA
after heat incubation at 150 °C were obtained from sam-
ples which had been previously heated and then cooled to
room temperature. The spectrophotometer was calibrated
with a standard ammonium D-10-camphorsulphonate
solution. The scan rate was 100 nmÆmin
)1
, with 0.1 nm
resolution, and 0.25 s response time. Spectra of LamA
before and after heat or chemical treatment resulted from
accumulation of 32 scans that were subsequently aver-
aged. Blank spectra of buffer without protein, obtained at
identical conditions, were subtracted. Data analysis was
performed by fitting the acquired spectra with reference
spectra using the contin program, which is based on
nonlinear regression fitting algorithms without constraints
(ridge-regression analysis) [45,46]. This program gives a
much better estimate of b-sheets and turns than simple
multiple linear regression [47]. An average molar mass of
115 Da per amino acid residue was used for calculating
the ellipticity, h.
Steady-state fluorescence spectroscopy
Fluorescence emission was measured by a Varian Cary
Eclipse spectrophotometer (Variam, Palo Alto, CA, USA).
Unless otherwise indicated, all measurements were carried
out at 20 °C using quartz cuvettes of 1 cm path length.
Emission spectra of 0.025 mgÆmL
)1
LamA were recorded in
the range 300–400 nm on excitation at 300 nm. The excita-
tion and emission slit widths were set at 5.0 and 2.5 nm,
respectively. All spectra were corrected for the background
emission of water. Spectra of samples containing GdnHCl
were corrected using as reference the buffer solution with
the same concentration of GdnHCl. Binding of ANS was
studied between 400 and 600 nm on excitation at 380 nm.
Fluorescence spectra of 0.1 mgÆmL
)1
LamA in the presence
of 50 lm of ANS were recorded at 20 °C before and after
heat and chemical treatment.
S. Koutsopoulos et al. CD, fluorescence and anisotropy of LamA
FEBS Journal 272 (2005) 5484–5496 ª 2005 FEBS 5493
Picosecond polarized time-resolved fluorescence
and anisotropy
Time-resolved fluorescence and anisotropy decay times were
measured in a home-built setup with mode-locked continu-
ous wave laser excitation and time-correlated photon count-
ing detection. The pump laser was a CW diode-pumped,
frequency-tripled Nd:YVO
4
. The mode-locked laser was a
titanium ⁄ sapphire laser coupled with a pulse picker which
decreased the repetition rate of the excitation pulses to
3.8 · 10
6
pulses per second. The maximum pulse energy
was a few pJ, the emission wavelength 295 nm and the
pulse duration 3 ps. The fluorescence was collected at an
angle of 90° with respect to the direction of the excitation
light beam. Extreme care was taken to avoid artefacts from
depolarization effects. At the front of the sample housing a
Glan-laser polarizer was mounted, optimizing the already
vertical polarization of the input light beam. Between sam-
ple and photomultiplier a single fast lens, an interference
filter (348.8 nm, Dk ¼ 5.4 nm), a computer controlled rota-
ting sheet-type polarizer and a second single fast lens were
placed, focusing the fluorescence on the photomultiplier
cathode. All polarizers were carefully aligned and the setup
was checked by measuring reference samples. Detection
electronics were standard time-correlated single photon
counting modules. With a small portion of the mode-locked
light a fast PIN-photodiode was excited. The output pulses
were sent to one channel of a quad constant fraction dis-
criminator and then used as stop signal for a time-to-ampli-
tude converter. Subsequently, they were analyzed by an
analogue-to-digital converter and were collected in 4096
channels of a multichannel analyzer with 11.1 ps time spa-
cing. A microchannel plate photomultiplier was used for
detecting the fluorescence photons. The energy of the exci-
tation pulses was reduced with neutral density filters and
the rate of the fluorescence photons was decreased to
30 000 per second to prevent pile-up distortion [48]. Other
instrumental sources of data distortion were minimized to
below the noise level of normal photon statistics [49].
For the time-resolved measurements the concentration of
LamA was 0.25 mgÆmL
)1
. Fused silica cuvettes of 1 cm
light path were placed in a temperature-controlled holder
set at 20 ° C. The cuvettes were carefully cleaned and
checked for background luminescence prior to the measure-
ments. Nanopure
TM
water was also tested for artificial
luminescence. For obtaining a dynamic instrumental
response of the setup, the single-exponential fluorescence
decay of paraterphenyl was measured in a mixture of cyclo-
hexane and CCl
4
in a 50:50% (v ⁄ v) ratio. To avoid and
correct eventual temporal shifts experimental data consisted
of repeating sequences of measurements of the parallel and
perpendicular polarized emission fluorescence decays of the
reference compound (three cycles of 20 s), the protein sam-
ple (10 cycles of 20 s), the background (two cycles of 20 s)
and again the reference compound.
Time-resolved data analysis
The time-resolved fluorescence intensity I(t) and anisotropy
r(t) decays were obtained from the measured parallel, I
||
(t),
and perpendicular, I
^
(t), fluorescence intensity components
through the relations:
IðtÞ¼I
k
ðtÞþ2I
?
ðtÞð2Þ
rðtÞ¼
I
k
ðtÞÀI
?
ðtÞ
I
k
ðtÞþ2I
?
ðtÞ
ð3Þ
The data were globally analyzed using the ‘TRFA Data
Processing Package’ (Scientific Software Technologies Cen-
ter, Minsk, Belarus), which employs a reweighted iterative
reconvolution method [50,51] The method allows correction
for wavelength dependence of the shape of the instrumental
response function and requires measuring the single-expo-
nential fluorescence decay of a reference compound at the
same conditions. Fluorescence decays were analyzed assu-
ming the multiexponential law,
IðtÞ¼EðtÞ
X
N
i¼1
a
i
Á e
Àt=s
i
ð4Þ
where the relative amplitudes, a
i
, and the decay fluores-
cence lifetimes, s
i
, are the numerical parameters of the
ith component to be determined, N the number of the
fluorescent components and E(t) is the instrumental
response function. The weighted average fluorescence life-
time <s> was calculated from the lifetime spectrum a(s)
according to the equation:
shi¼
X
N
i¼1
a
i
s
i
=
X
N
i¼1
a
i
ð5Þ
The anisotropy decay of an asymmetric rotor can be des-
cribed by a sum of discrete exponential terms [52]:
rðtÞ¼
X
N
i¼1
b
i
Á e
Àt=u
i
ð6Þ
where /
i
are the rotational correlation times and the pre-
exponential terms b
i
are the contribution of each correlation
time to the total anisotropy decay. The anisotropy decay
parameters were estimated by simultaneous analysis of I
||
(t)
and I
^
(t). The goodness-of-fit was judged by the value of
parameter, v
2
, and inspection of the residual function graphs
for each data set. In all cases the v
2
factor was close to unity,
and the weighted residuals and the autocorrelation of the
residuals were uniformly distributed around zero indicating
an optimal fit. In all cases the simpler model was chosen.
Attempted fits of the experimental data to a model with less
independent exponents resulted in a substantial increase of
the v
2
value. Fitting sessions using more components did not
lead to significant improvement in v
2
value.
CD, fluorescence and anisotropy of LamA S. Koutsopoulos et al .
5494 FEBS Journal 272 (2005) 5484–5496 ª 2005 FEBS
Acknowledgements
We are grateful to A. van Hoek for technical support.
This research was supported by an Individual Marie
Curie Fellowship of the European Community pro-
gram ‘Improving Human Research Potential and the
Socio-Economic Knowledge Base’ under contract num-
ber HPMF-CT-1999-00210 to S.K.
References
1 Brown JR & Doolittle WF (1997) Archaea and the pro-
karyote-to-eukaryote transition. Microbiol Mol Biol Rev
61, 456–502.
2 Fiala G & Stetter KO (1986) Pyrococcus furiosus sp.
nov. represents a novel genus of marine heterotrophic
archaebacteria growing optimally at 100 °C. Arch
Microbiol 145, 56–61.
3 Gueguen Y, Voorhorst WGB, van der Oost J & de Vos
WM (1997) Molecular and biochemical characterization
of an endo-b-1,3-glucanase of the hyperthermophilic
archaeon Pyrococcus furiosus. J Biol Chem 272, 31258–
31264.
4 Koutsopoulos S, van der Oost J & Norde W (2005)
Temperature dependent structural and functional
features of a hyperthermostable enzyme using elastic
neutron scattering. Proteins, doi: 10.1002/prot,20606.
5 Eftink MR (1991) Phase-resolved spectral measurements
with several two tryptophan containing proteins. Meth-
ods Biochem Anal 35, 127–205.
6 Lakowicz JR (1999) Principles of Fluorescence Spectro-
scopy, 2nd edn. Kluwer Academic ⁄ Plenum Publishers,
New York.
7 Steiner RF (1991) Fluorescence Spectroscopy: Theory
and applications. In Topics in Fluorescence Spectroscopy
(Lakowicz JR, ed.), Plenum Press, New York ⁄ London,
pp. 1–52.
8 Combet C, Jambon M, Deleage G & Geourjon C
(2002) Geno3D: automatic comparative molecular
modelling of protein. Bioinformatics 18, 213–214.
9 Hahn M, Pons J, Planas A, Querol E & Heinemann U
(1995) Crystal structure of Bacillus licheniformis 1,3–1,
4-b-d-glucan 4-glucanohydrolase at 1.8 A
˚
resolution.
FEBS Lett 374, 221–224.
10 Michel G, Chantalat L, Duee E, Barbeyron T, Henris-
sat B, Kloareg B & Dideberg O (2001) The kappa-carra-
geenase of P. carrageenovora features a tunnel-shaped
active site: a novel insight in the evolution of clan-B
glycoside hydrolases. Structure 9, 513–525.
11 Koutsopoulos S, van der Oost J & Norde W (2004)
Structural features of a hyperthermostable endo-b-1,3-
endoglucanase in solution and adsorbed on ‘invisible’
particles. Biophys J 88, 467–474.
12 Chiaraluce R, van der Oost J, Lebbink JHG, Kaper T
& Consalvi V (2002) Persistence of tertiary structure in
7.9 m guanidinium chloride: The case of endo-beta-1,
3-glucanase from Pyrococcus furiosus. Biochemistry 41,
14624–14632.
13 Radda GK (1971) Design and use of fluorescent
probes for membrane studies. Curr Top Bioenerg 4,
81–123.
14 Brand L & Go
¨
hlke JR (1972) Fluorescence probes for
structure. Annu Rev Biochem 41, 843–868.
15 Chakraborty S, Ittah V, Bai P, Luo L, Haas E & Peng
Z-y (2001) Structure and dynamics of the alpha-lactal-
bumin molten globule: Fluorescence studies using
proteins containing a single tryptophan residue.
Biochemistry 39, 7228–7238.
16 Kawahara K & Tanford C (1966) Viscosity and density
of aqueous solutions of urea and guanidine hydro-
chloride. J Biol Chem 241, 3228–3232.
17 Ruggiero AJ, Todd DC & Flemming GR (1990) Sub-
picosecond fluorescence anisotropy studies of trypto-
phan in water. J Am Chem Soc 112, 1003–1014.
18 Callis PR (1997) L-1(a) and L-1(b) transitions of trypto-
phan: Applications of theory and experimental observa-
tions to fluorescence of proteins. Methods Enzymol 278,
113–150.
19 Yamamoto Y & Tanaka J (1972) Polarized absorption-
spectra of crystals of indole and its related compounds.
Bull Chem Soc Jpn 45, 1362–1366.
20 Turoverov KK, Biktashev AG, Khaitlina SYu &
Kuznetzova IM (1999) The structure and dynamics of
partially folded actin. Biochemistry 38, 6261–6269.
21 Eftink MR, Wasylewsky Z & Chiron CA (1987)
Phase-resolved spectral measurements with several two
tryptophan containing proteins. Biochemistry 26, 8338–
8346.
22 Chen Y & Barkley MD (1998) Toward understanding
tryptophan fluorescence in proteins. Biochemistry 37,
9976–9982.
23 Wu P & Brand L (1994) Resonance energy-transfer –
Methods and applications. Anal Biochem 218, 1–13.
24 Cowgill RW (1967) Fluorescence and protein structure.
XI. Fluorescence quenching by disulfide and sulfhydryl
groups. Biochim Biophys Acta 140, 37–44.
25 Steinberg IZ (1971) Long-range nonradiative transfer
of electronic excitation energy in proteins and poly-
peptides. Annu Rev Biochem 40, 83–114.
26 Griep MA & McHenry CS (1990) Dissociation of the
DNA polymerase-III holoenzyme beta-2 subunits is
accompanied by conformational change at distal
cysteines-333. J Biol Chem 265, 20356–20363.
27 Ewbank JJ, Creighton TE, Hayer-Hartl MK & Ulrich
Hartl F (1995) What is the molten globule? Nat Struct
Biol 2, 10–11.
28 Grinvald A & Steinberg IZ (1976) Fluorescence decay
of tryptophan residues in native and denatured proteins.
Biochim Biophys Acta 427, 663–678.
S. Koutsopoulos et al. CD, fluorescence and anisotropy of LamA
FEBS Journal 272 (2005) 5484–5496 ª 2005 FEBS 5495
29 Werner TC & Forster LS (1979) Fluorescence of trypto-
phyl peptides. Photochem Photobiol 29, 905–914.
30 Chang MC, Petrich JW, McDonald DB & Fleming GR
(1983) Non-exponential fluorescence decay of trypto-
phan, tryptophylglycine, and glycyltryptophan. JAm
Chem Soc 105, 3819–3824.
31 Petrich JW, Chang MC, McDonald DB & Fleming GR
(1983) On the origin of non-exponential fluorescence
decay in tryptophan and its derivatives. J Am Chem Soc
105, 3824–3832.
32 Beechem JM & Brand L (1985) Time-resolved fluores-
cence of proteins. Annu Rev Biochem 54, 43–71.
33 Eftink MR (1994) The use of fluorescence methods to
monitor unfolding transitions in proteins. Biophys J 66,
482–501.
34 Willis KJ, Neugebauer W, Sikorska M & Szabo AG
(1994) Probing alpha-helical secondary structure at a
specific site in model peptides via restriction of trypto-
phan side-chain rotamer conformation. Biophys J 66,
1623–1630.
35 Dahms TD & Szabo AG (1995) Probing local secondary
structure by fluorescence – time-resolved and circular-
dichroism studies of highly purified neurotoxins.
Biophys J 69, 569–576.
36 Visser AJWG, van Hoek A, O’Kane DJ & Lee J (1989)
Time-resolved fluorescence spectroscopy of lumazine
protein from photobacterium-phosphoreum using
synchrotron radiation. Eur Biophys J 17, 75–85.
37 Tcherkasskaya O, Ptitsyn OB & Knutson JR (2000)
Nanosecond dynamics of tryptophans in different
conformational states of apomyoglobin proteins. Bio-
chemistry 39, 1879–1889.
38 Kemple MD, Buckley P, Yuan P & Predergast FG
(1997) Main chain and side chain dynamics of peptides
in liquid solution from C-13 NMR: Melittin as a model
peptide. Biochemistry 36, 1678–1688.
39 Wong KB, Freund SM & Fersht AR (1996) Cold dena-
turation of barstar: H-1, N-15 and C-13 NMR assign-
ment and characterisation of residual structure. J Mol
Biol 259, 805–818.
40 Mok YK, Kay CM, Kay LE & Forman-Kay JD (1999)
NOE data demonstrating a compact unfolded state for
an SH3 domain under non-denaturing conditions.
J Mol Biol 289, 619–638.
41 Shortle D & Ackerman MS (2001) Persistence of native-
like topology in a denatured protein in 8 m urea.
Science 293, 487–489.
42 Klein-Seetharaman J, Oikawa M, Grimshaw SB,
Wirmer J, Duchardt E, Ueda T, Imoto T, Smith LJ,
Dobson CM & Schwalbe H (2002) Long-range inter-
actions within a nonnative protein. Science 295, 1719–
1722.
43 Crowhurst KA, Tollinger M & Forman-Kay JD (2002)
Cooperative interactions and a non-native buried Trp in
the unfolded state of an SH3 domain. J Mol Biol 322,
163–178.
44 Pace CN, Shirley BA & Thomson JA (1990) Protein
Structure. A Practical Approach (Creighton TE, ed.),
chapter 13. IRL Press, Oxford.
45 Venyaminov SYu, Baikalov IA, Shen ZM, Wu C-SC &
Yang JT (1993) Circular dichroic analysis of denatured
proteins – inclusion of denatured proteins in the refer-
ence set. Anal Biochem 214, 17–24.
46 Provencher SW & Glo
¨
ckner J (1981) Estimation of
globular protein secondary structure from circular-
dichroism. Biochemistry 20, 33–37.
47 Greenfield NJ (1996) Methods to estimate the confor-
mation of proteins and polypeptides from circular
dichroism data. Anal Biochem 235, 1–10.
48 Vos K, van Hoek A & Visser AJWG (1987) Application
of a reference convolution method to tryptophan fluo-
rescence in proteins – A refined description of rotational-
dynamics. Eur J Biochem 165, 55–63.
49 van Hoek A & Visser AJWG (1985) Artefact and dis-
tortion sources in time correlated single photon count-
ing. Anal Instrument 14, 359–378.
50 Novikov EG, van Hoek A, Visser AJWG & Hofstraat
JW (1999) Linear algorithms for stretched exponential
decay analysis. Opt Commun 166, 189–199.
51 Digris AV, Skakun VV, Novikov EG, van Hoek A,
Claiborne A & Visser AJWG (1999) Thermal stability
of a flavoprotein assessed from associative analysis of
polarized time-resolved fluorescence spectroscopy. Eur
Biophys J 28, 526–531.
52 Belford GG, Belford RL & Weber G (1972) Dynamics
of fluorescence polarization in macromolecules. Proc
Natl Acad Sci USA 69, 1392–1393.
CD, fluorescence and anisotropy of LamA S. Koutsopoulos et al .
5496 FEBS Journal 272 (2005) 5484–5496 ª 2005 FEBS


![Tài liệu Báo cáo khoa học: Specific targeting of a DNA-alkylating reagent to mitochondria Synthesis and characterization of [4-((11aS)-7-methoxy-1,2,3,11a-tetrahydro-5H-pyrrolo[2,1-c][1,4]benzodiazepin-5-on-8-oxy)butyl]-triphenylphosphonium iodide doc](https://media.store123doc.com/images/document/14/br/vp/medium_vpv1392870032.jpg)