Báo cáo khoa học: "A new Approach to Improving Multilingual Summarization using a Genetic Algorithm" pptx
Bạn đang xem bản rút gọn của tài liệu. Xem và tải ngay bản đầy đủ của tài liệu tại đây (238.37 KB, 10 trang )
Proceedings of the 48th Annual Meeting of the Association for Computational Linguistics, pages 927–936,
Uppsala, Sweden, 11-16 July 2010.
c
2010 Association for Computational Linguistics
A new Approach to Improving Multilingual Summarization using a
Genetic Algorithm
Marina Litvak
Ben-Gurion University
of the Negev
Beer Sheva, Israel
Mark Last
Ben-Gurion University
of the Negev
Beer Sheva, Israel
Menahem Friedman
Ben-Gurion University
of the Negev
Beer Sheva, Israel
Abstract
Automated summarization methods can
be defined as “language-independent,” if
they are not based on any language-
specific knowledge. Such methods can
be used for multilingual summarization
defined by Mani (2001) as “processing
several languages, with summary in the
same language as input.” In this pa-
per, we introduce MUSE, a language-
independent approach for extractive sum-
marization based on the linear optimiza-
tion of several sentence ranking measures
using a genetic algorithm. We tested our
methodology on two languages—English
and Hebrew—and evaluated its perfor-
mance with ROUGE-1 Recall vs. state-
of-the-art extractive summarization ap-
proaches. Our results show that MUSE
performs better than the best known multi-
lingual approach (TextRank
1
) in both lan-
guages. Moreover, our experimental re-
sults on a bilingual (English and Hebrew)
document collection suggest that MUSE
does not need to be retrained on each lan-
guage and the same model can be used
across at least two different languages.
1 Introduction
Document summaries should use a minimum
number of words to express a document’s main
ideas. As such, high quality summaries can sig-
nificantly reduce the information overload many
professionals in a variety of fields must contend
1
We evaluated several summarizers—SUMMA, MEAD,
Microsoft Word Autosummarize and TextRank—on the DUC
2002 corpus. Our results show that TextRank performed
best. In addition, TextRank can be considered language-
independent as long as it does not perform any morphological
analysis.
with on a daily basis (Filippova et al., 2009), as-
sist in the automated classification and filtering of
documents, and increase search engines precision.
Automated summarization methods can
use different levels of linguistic analysis:
morphological, syntactic, semantic and dis-
course/pragmatic (Mani, 2001). Although the
summary quality is expected to improve when
a summarization technique includes language
specific knowledge, the inclusion of that knowl-
edge impedes the use of the summarizer on
multiple languages. Only systems that perform
equally well on different languages without
language-specific knowledge (including linguistic
analysis) can be considered language-independent
summarizers.
The publication of information on the Internet
in an ever-increasing variety of languages
2
dic-
tates the importance of developing multilingual
summarization approaches. There is a particu-
lar need for language-independent statistical tech-
niques that can be readily applied to text in any
language without depending on language-specific
linguistic tools. In the absence of such techniques,
the only alternative to language-independent sum-
marization would be the labor-intensive transla-
tion of the entire document into a common lan-
guage.
Here we introduce MUSE (MUltilingual Sen-
tence Extractor), a new approach to multilingual
single-document extractive summarization where
summarization is considered as an optimization or
a search problem. We use a Genetic Algorithm
(GA) to find an optimal weighted linear combina-
tion of 31 statistical sentence scoring methods that
are all language-independent and are based on ei-
ther a vector or a graph representation of a docu-
ment, where both representations are based on a
2
Gulli and Signorini (2005) used Web searches in 75 dif-
ferent languages to estimate the size of the Web as of the end
of January 2005.
927
word segmentation.
We have evaluated our approach on two mono-
lingual corpora of English and Hebrew documents
and, additionally, on one bilingual corpora com-
prising English and Hebrew documents. Our eval-
uation experiments sought to
- Compare the GA-based approach for single-
document extractive summarization (MUSE) to
the best known sentence scoring methods.
- Determine whether the same weighting model is
applicable across two different languages.
This paper is organized as follows. The next
section describes the related work in statistical
extractive summarization. Section 3 introduces
MUSE, the GA-based approach to multilingual
single-document extractive summarization. Sec-
tion 4 presents our experimental results on mono-
lingual and bilingual corpora. Our conclusions
and suggestions for future work comprise the fi-
nal section.
2 Related Work
Extractive summarization is aimed at the selec-
tion of a subset of the most relevant fragments
from a source text into the summary. The frag-
ments can be paragraphs (Salton et al., 1997), sen-
tences (Luhn, 1958), keyphrases (Turney, 2000)
or keywords (Litvak and Last, 2008). Statisti-
cal methods for calculating the relevance score
of each fragment can be categorized into sev-
eral classes: cue-based (Edmundson, 1969), key-
word- or frequency-based (Luhn, 1958; Edmund-
son, 1969; Neto et al., 2000; Steinberger and
Jezek, 2004; Kallel et al., 2004; Vanderwende et
al., 2007), title-based (Edmundson, 1969; Teufel
and Moens, 1997), position-based (Baxendale,
1958; Edmundson, 1969; Lin and Hovy, 1997;
Satoshi et al., 2001) and length-based (Satoshi et
al., 2001).
Considered the first work on sentence scoring
for automated text summarization, Luhn (1958)
based the significance factor of a sentence on the
frequency and the relative positions of signifi-
cant words within a sentence. Edmundson (1969)
tested different linear combinations of four sen-
tence ranking scoring methods—cue, key, title and
position—to identify that which performed best
on a training corpus. Linear combinations of sev-
eral statistical sentence ranking methods were also
applied in the MEAD (Radev et al., 2001) and
SUMMA (Saggion et al., 2003) approaches, both
of which use the vector space model for text repre-
sentation and a set of predefined or user-specified
weights for a combination of position, frequency,
title, and centroid-based (MEAD) features. Gold-
stein et al. (1999) integrated linguistic and statisti-
cal features. In none of these works, however, did
the researchers attempt to find the optimal weights
for the best linear combination.
Information retrieval and machine learning
techniques were integrated to determine sentence
importance (Kupiec et al., 1995; Wong et al.,
2008). Gong and Liu (2001) and Steinberger and
Jezek (2004) used singular value decomposition
(SVD) to generate extracts. Ishikawa et al. (2002)
combined conventional sentence extraction and a
trainable classifier based on support vector ma-
chines.
Some authors reduced the summarization pro-
cess to an optimization or a search problem. Has-
sel and Sjobergh (2006) used a standard hill-
climbing algorithm to build summaries that max-
imize the score for the total impact of the sum-
mary. A summary consists of first sentences from
the document was used as a starting point for the
search, and all neighbours (summaries that can
be created by simply removing one sentence and
adding another) were examined, looking for a bet-
ter summary.
Kallel et al. (2004) and Liu et al. (2006b)
used genetic algorithms (GAs), which are known
as prominent search and optimization meth-
ods (Goldberg, 1989), to find sets of sentences that
maximize summary quality metrics, starting from
a random selection of sentences as the initial pop-
ulation. In this capacity, however, the high com-
putational complexity of GAs is a disadvantage.
To choose the best summary, multiple candidates
should be generated and evaluated for each docu-
ment (or document cluster).
Following a different approach, Turney (2000)
used a GA to learn an optimized set of parame-
ters for a keyword extractor embedded in the Ex-
tractor tool.
3
Or
˘
asan et al. (2000) enhanced the
preference-based anaphora resolution algorithms
by using a GA to find an optimal set of values for
the outcomes of 14 indicators and apply the opti-
mal combination of values from data on one text
to a different text. With such approach, training
may be the only time-consuming phase in the op-
eration.
3
/>928
Today, graph-based text representations are be-
coming increasingly popular, due to their abil-
ity to enrich the document model with syntactic
and semantic relations. Salton et al. (1997) were
among the first to make an attempt at using graph-
based ranking methods in single document ex-
tractive summarization, generating similarity links
between document paragraphs and using degree
scores in order to extract the important paragraphs
from the text. Erkan and Radev (2004) and Mi-
halcea (2005) introduced algorithms for unsuper-
vised extractive summarization that rely on the
application of iterative graph-based ranking algo-
rithms, such as PageRank (Brin and Page, 1998)
and HITS (Kleinberg, 1999). Their methods rep-
resent a document as a graph of sentences inter-
connected by similarity relations. Various sim-
ilarity functions can be applied: cosine similar-
ity as in (Erkan and Radev, 2004), simple over-
lap as in (Mihalcea, 2005), or other functions.
Edges representing the similarity relations can be
weighted (Mihalcea, 2005) or unweighted (Erkan
and Radev, 2004): two sentences are connected if
their similarity is above some predefined threshold
value.
3 MUSE – MUltilingual Sentence
Extractor
In this paper we propose a learning approach
to language-independent extractive summariza-
tion where the best set of weights for a linear com-
bination of sentence scoring methods is found by
a genetic algorithm trained on a collection of doc-
ument summaries. The weighting vector thus ob-
tained is used for sentence scoring in future sum-
marizations. Since most sentence scoring methods
have a linear computational complexity, only the
training phase of our approach is time-consuming.
3.1 Sentence scoring methods
Our work is aimed at identifying the best linear
combination of the 31 sentence scoring methods
listed in Table 1. Each method description in-
cludes a reference to the original work where the
method was proposed for extractive summariza-
tion. Methods proposed in this paper are denoted
by new. Formulas incorporate the following nota-
tion: a sentence is denoted by S, a text document
by D, the total number of words in S by N, the to-
tal number of sentences in D by n, the sequential
number of S in D by i, and the in-document term
frequency of the term t by tf(t). In the LUHN
method, W
i
and N
i
are the number of keywords
and the total number of words in the i
th
cluster, re-
spectively, such that clusters are portions of a sen-
tence bracketed by keywords, i.e., frequent, non-
common words.
4
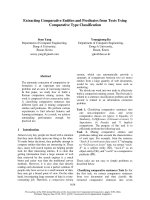
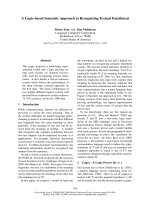
Figure 1 demonstrates the taxonomy of the
methods listed in Table 1. Methods that require
pre-defined threshold values are marked with a
cross and listed in Table 2 together with the aver-
age threshold values obtained after method eval-
uation on English and Hebrew corpora. Each
method was evaluated on both corpora, with dif-
ferent threshold t ∈ [0, 1] (only numbers with one
decimal digit were considered). Threshold val-
ues resulted in the best ROUGE-1 scores, were
selected. A threshold of 1 means that all terms
are considered, while a value of 0 means that
only terms with the highest rank (tf, degree, or
pagerank) are considered. The methods are di-
vided into three main categories—structure-, vec-
tor-, and graph-based—according to the text rep-
resentation model, and each category is divided
into sub-categories.
Section 3.3 describes our application of a GA to
the summarization task.
Table 2: Selected thresholds for threshold-based
scoring methods
Method Threshold
LUHN 0.9
LUHN
DEG 0.9
LUHN
PR 0.0
KEY [0.8, 1.0]
KEY
DEG [0.8, 1.0]
KEY
PR [0.1, 1.0]
COV 0.9
COV
DEG [0.7, 0.9]
COV
PR 0.1
3.2 Text representation models
The vector-based scoring methods listed in Ta-
ble 1 use tf or tf-idf term weights to evaluate
sentence importance. In contrast, representation
used by the graph-based methods (except for Tex-
tRank) is based on the word-based graph represen-
tation models described in (Schenker et al., 2004).
Schenker et al. (2005) showed that such graph
representations can outperform the vector space
model on several document categorization tasks.
In the graph representation used by us in this work
4
Luhn’s experiments suggest an optimal limit of 4 or 5
non-significant words between keywords.
929
Table 1: Sentence scoring metrics
Name Description Source
POS F Closeness to the beginning of the document:
1
i
(Edmundson, 1969)
POS L Closeness to the end of the document: i (Baxendale, 1958)
POS B Closeness to the borders of the document: max(
1
i
,
1
n−i+1
)
(Lin and Hovy, 1997)
LEN W Number of words in the sentence (Satoshi et al., 2001)
LEN CH Number of characters in the sentence
5
LUHN max
i∈{clusters(S)}
{CS
i
}, CS
i
=
W
2
i
N
i
(Luhn, 1958)
KEY Sum of the keywords frequencies:
t∈{Keywords(S)}
tf(t)
(Edmundson, 1969)
COV Ratio of keywords number (Coverage):
|Keywords(S)|
|Keywords(D)|
(Liu et al., 2006a)
TF Average term frequency for all sentence words:
t∈S
tf (t)
N
(Vanderwende et al., 2007)
TFISF
t∈S
tf(t) × isf(t), isf (t) = 1 −
log(n(t))
log(n)
,
(Neto et al., 2000)
n(t) is the number of sentences containing t
SVD Length of a sentence vector in Σ
2
· V
T
after computing Singular Value (Steinberger and Jezek, 2004)
Decomposition of a term by sentences matrix A = UΣV
T
TITLE O Overlap similarity
6
to the title: sim(S, T ) =
|S∩T |
min{|S|,|T |}
(Edmundson, 1969)
TITLE J Jaccard similarity to the title: sim(S, T ) =
|S∩T |
|S∪T |
TITLE C Cosine similarity to the title: sim(
S,
T ) = cos(
S,
T ) =
S•
T
|
S
|
•
|
T
|
D COV O Overlap similarity to the document complement new
sim(S, D − S) =
|S∩T |
min{|S|,|D−S|}
D COV J Jaccard similarity to the document complement sim(S, D − S) =
|S∩T |
|S∪D−S|
D COV C Cosine similarity to the document complement cos(
S,
D − S) =
S•
D−S
|
S
|
•
|
D−S
|
LUHN DEG Graph-based extensions of LUHN, KEY and COV measures respectively.
KEY DEG Node degree is used instead of a word frequency: words are considered
COV DEG significant if they are represented by nodes having a degree higher
than a predefined threshold
DEG Average degree for all sentence nodes:
i∈{words(S)}
Deg
i
N
GRASE Frequent sentences from bushy paths are selected. Each sentence in the bushy
path gets a domination score that is the number of edges with its label in the
path normalized by the sentence length. The relevance score for a sentence
is calculated as a sum of its domination scores over all paths.
LUHN PR Graph-based extensions of LUHN, KEY and COV measures respectively.
KEY PR Node PageRank score is used instead of a word frequency: words are considered
COV PR significant if they are represented by nodes having a PageRank score higher
than a predefined threshold
PR Average PageRank for all sentence nodes:
t∈S
P R(t)
N
TITLE E O Overlap-based edge matching between title and sentence graphs
TITLE E J Jaccard-based edge matching between title and sentence graphs
D COV E O Overlap-based edge matching between sentence and a document complement
graphs
D COV E J Jaccard-based edge matching between sentence and a document complement
graphs
ML TR Multilingual version of TextRank without morphological analysis: (Mihalcea, 2005)
Sentence score equals to PageRank (Brin and Page, 1998) rank of its node:
W S(V
i
) = (1 − d) + d ∗
V
j
∈In(V
i
)
w
ji
V
k
∈Out(V
j
)
w
jk
W S(V
j
)
nodes represent unique terms (distinct words) and
edges represent order-relationships between two
terms. There is a directed edge from A to B if an A
term immediately precedes the B term in any sen-
tence of the document. We label each edge with
the IDs of sentences that contain both words in the
specified order.
3.3 Optimization—learning the best linear
combination
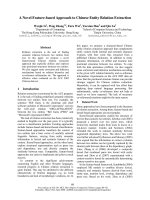
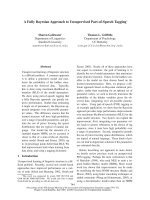
We found the best linear combination of the meth-
ods listed in Table 1 using a Genetic Algorithm
(GA). GAs are categorized as global search heuris-
tics. Figure 2 shows a simplified GA flowchart.
A typical genetic algorithm requires (1) a genetic
representation of the solution domain, and (2) a
fitness function to evaluate the solution domain.
We represent the solution as a vector of weights
930
Language-independent sentence
scoringmethods
Structure-
based
Vector-
based
Graph-
based
Position
Length Frequency Similarity Degree SimilarityPagerank
Title Document
POS_F
POS_L
POS_B
LEN_W
LEN_CH
LUHN
KEY
COV
TF
TFIISF
SVD
TITLE_O
TITLE_J
TITLE_C
D_COV_O*
D_COV_J*
D_COV_C*
LUHN_DEG*
KEY_DEG*
COV_DEG*
DEG*
GRASE*
LUHN_PR*
KEY_PR*
COV_PR*
PR*
ML_TR
Title Document
TITLE_E_O*
TITLE_E_J*
D_COV_E_O*
D_COV_E_J*
Figure 1: Taxonomy of language-independent sentence scoring methods
Selection
Mating
Crossover
Mutation
Terminate?
Best
gene
yes
no
Initialization
Mating
Crossover
Mutation
Reproduction
Figure 2: Simplified flowchart of a Genetic Algo-
rithm
for a linear combination of sentence scoring
methods—real-valued numbers in the unlimited
range normalized in such a way that they sum up
to 1. The vector size is fixed and it equals to the
number of methods used in the combination.
Defined over the genetic representation, the fit-
ness function measures the quality of the repre-
sented solution. We use ROUGE-1 Recall (Lin
and Hovy, 2003) as a fitness function for mea-
suring summarization quality, which is maximized
during the optimization procedure.
Below we describe each phase of the optimiza-
tion procedure in detail.
Initialization GA will explore only a small part
of the search space, if the population is too small,
whereas it slows down if there are too many solu-
tions. We start from N = 500 randomly gener-
ated genes/solutions as an initial population, that
empirically was proven as a good choice. Each
gene is represented by a weighting vector v
i
=
w
1
, . . . , w
D
having a fixed number of D ≤ 31 ele-
ments. All elements are generated from a standard
normal distribution, with µ = 0 and σ
2
= 1, and
normalized to sum up to 1. For this solution rep-
resentation, a negative weight, if it occurs, can be
considered as a “penalty” for the associated met-
ric.
Selection During each successive generation, a
proportion of the existing population is selected to
breed a new generation. We use a truncation se-
lection method that rates the fitness of each so-
lution and selects the best fifth (100 out of 500)
of the individual solutions, i.e., getting the maxi-
mal ROUGE value. In such manner, we discard
“bad” solutions and prevent them from reproduc-
tion. Also, we use elitism—method that prevents
losing the best found solution in the population by
copying it to the next generation.
Reproduction In this stage, new
genes/solutions are introduced into the popu-
lation, i.e., new points in the search space are
explored. These new solutions are generated
from those selected through the following genetic
operators: mating, crossover, and mutation.
In mating, a pair of “parent” solutions is ran-
domly selected, and a new solution is created us-
ing crossover and mutation, that are the most im-
portant part of a genetic algorithm. The GA per-
formance is influenced mainly by these two opera-
tors. New parents are selected for each new child,
and the process continues until a new population
of solutions of appropriate size N is generated.
Crossover is performed under the assumption
931
that new solutions can be improved by re-using
the good parts of old solutions. However it is
good to keep some part of population from one
generation to the next. Our crossover operator in-
cludes a probability (80%) that a new and different
offspring solution will be generated by calculat-
ing the weighted average of two “parent” vectors
according to (Vignaux and Michalewicz, 1991).
Formally, a new vector v will be created from
two vectors v
1
and v
2
according to the formula
v = λ ∗ v
1
+ (1 − λ) ∗ v
2
(we set λ = 0.5). There
is a probability of 20% that the offspring will be a
duplicate of one of its parents.
Mutation in GAs functions both to preserve the
existing diversity and to introduce new variation.
It is aimed at preventing GA from falling into lo-
cal extreme, but it should not be applied too often,
because then GA will in fact change to random
search. Our mutation operator includes a proba-
bility (3%) that an arbitrary weight in a vector will
be changed by a uniformly randomized factor in
the range of [−0.3, 0.3] from its original value.
Termination The generational process is re-
peated until a termination condition—a plateau of
solution/combination fitness such that successive
iterations no longer produce better results—has
been reached. The minimal improvement in our
experiments was set to ǫ = 1.0E − 21.
4 Experiments
4.1 Overview
The MUSE summarization approach was eval-
uated using a comparative experiment on two
monolingual corpora of English and Hebrew texts
and on a bilingual corpus of texts in both lan-
guages. We intentionally chose English and He-
brew, which belong to distinct language families
(Indo-European and Semitic languages, respect-
fully), to ensure that the results of our evaluation
would be widely generalizable. The specific goals
of the experiment are to:
- Evaluate the optimal sentence scoring models in-
duced from the corpora of summarized documents
in two different languages.
- Compare the performance of the GA-based mul-
tilingual summarization method proposed in this
work to the state-of-the-art approaches.
- Compare method performance on both lan-
guages.
- Determine whether the same sentence scoring
model can be efficiently used for extractive sum-
marization across two different languages.
4.2 Text preprocessing
Crucial to extractive summarization, proper sen-
tence segmentation contributes to the quality of
summarization results. For English sentences,
we used the sentence splitter provided with the
MEAD summarizer (Radev et al., 2001). A sim-
ple splitter that can split the text at periods, excla-
mation points, or question marks was used for the
Hebrew text.
7
4.3 Experiment design
The English text material we used in our experi-
ments comprised the corpus of summarized doc-
uments available to the single document summa-
rization task at the Document Understanding Con-
ference, 2002 (DUC, 2002). This benchmark
dataset contains 533 news articles, each accompa-
nied by two to three human-generated abstracts of
approximately 100 words each.
For the Hebrew language, however, to the best
of our knowledge, no summarization benchmarks
exist. To generate a corpus of summarized Hebrew
texts, therefore, we set up an experiment where
human assessors were given 50 news articles of
250 to 830 words each from the Website of the
Haaretz newspaper.
8
All assessors were provided
with the Tool Assisting Human Assessors (TAHA)
software tool
9
that enables sentences to be easily
selected and stored for later inclusion in the doc-
ument extract. In total, 70 undergraduate students
from the Department of Information Systems En-
gineering, Ben Gurion University of the Negev
participated in the experiment. Each student par-
ticipant was randomly assigned ten different doc-
uments and instructed to (1) spend at least five
minutes on each document, (2) ignore dialogs and
quotations, (3) read the whole document before
beginning sentence extraction, (4) ignore redun-
dant, repetitive, and overly detailed information,
and (5) remain within the minimal and maximal
summary length constraints (95 and 100 words, re-
spectively). Summaries were assessed for quality
by comparing each student’s summary to those of
all the other students using the ROUGE evalua-
7
Although the same set of splitting rules may be used for
many different languages, separate splitters were used for En-
glish and Hebrew because the MEAD splitter tool isrestricted
to European languages.
8
9
TAHA can be provided upon request
932
tion toolkit adapted to Hebrew
10
and the ROUGE-
1 metric (Lin and Hovy, 2003). We filtered all the
summaries produced by assessors that received av-
erage ROUGE score below 0.5, i. e. agreed with
the rest of assessors in less than 50% of cases.
Finally, our corpus of summarized Hebrew texts
was compiled from the summaries of about 60%
of the most consistent assessors, with an aver-
age of seven extracts per single document
11
. The
ROUGE scores of the selected assessors are dis-
tributed between 50 and 57 percents.
The third, bilingual, experimental corpus was
assembled from documents in both languages.
4.4 Experimental Results
We evaluated English and Hebrew summaries us-
ing ROUGE-1, 2, 3, 4, L, SU and W metrics, de-
scribed in (2004). In agreement with Lin’s (2004)
conclusion, our results for the different metrics
were not statistically distinguishable. However,
ROUGE-1 showed the largest variation across the
methods. In the following comparisons, all results
are presented in terms of the ROUGE-1 Recall
metric.
We estimated the ROUGE metric using 10-fold
cross validation. The results of training and testing
comprise the average ROUGE values obtained for
English, Hebrew, and bilingual corpora (Table 3).
Since we experimented with a different number of
English and Hebrew documents (533 and 50, re-
spectively), we have created 10 balanced bilingual
corpora, each with the same number of English
and Hebrew documents, by combining approxi-
mately 50 randomly selected English documents
with all 50 Hebrew documents. Each corpus was
then subjected to 10-fold cross validation, and the
average results for training and testing were calcu-
lated.
We compared our approach (1) with a
multilingual version of TextRank (denoted by
ML
TR) (Mihalcea, 2005) as the best known
multilingual summarizer, (2) with Microsoft
Word’s Autosummarize function
12
(denoted by
MS
SUM) as a widely used commercial summa-
10
The regular expressions specifying “word” were adapted
to Hebrew alphabet. The same toolkit was used for sum-
maries evaluation on Hebrew corpus.
11
Dataset is available at .
il/
˜
litvakm/research/
12
We reported the following bug to Microsoft: Microsoft
Word’s Document.Autosummarize Method returns different
results from the output of the AutoSummarize Dialog Box.
In our experiments, the Method results were used.
rizer, and (3) with the best single scoring method
in each corpus. As a baseline, we compiled sum-
maries created from the initial sentences (denoted
by POS
F). Table 4 shows the comparative re-
sults (ROUGE mean values) for English, Hebrew,
and bilingual corpora, with the best summarizers
on top. Pairwise comparisons between summa-
rizers indicated that all methods (except POS
F
and ML
TR in the English and bilingual corpora
and D
COV J and POS F in the Hebrew corpus)
were significantly different at the 95% confidence
level. MUSE performed significantly better than
TextRank in all three corpora and better than the
best single methods COV DEG in English and
D
COV J in Hebrew corpora respectively.
Two sets of features—the full set of 31 sen-
tence scoring metrics and the 10 best bilingual
metrics determined in our previous work
13
using
a clustering analysis of the methods results on
both corpora—were tested on the bilingual corpus.
The experimental results show that the optimized
combination of the 10 best metrics is not signif-
icantly distinguishable from the best single met-
ric in the multilingual corpus – COV
DEG. The
difference between the combination of all 31 met-
rics and COV
DEG is significant only with a one-
tailed p-value of 0.0798 (considered not very sig-
nificant). Both combinations significantly outper-
formed all the other summarizers that were com-
pared. Table 4 contains the results of MUSE-
trained weights for all 31 metrics.
Our experiments showed that the removal of
highly-correlated metrics (the metric with the
lower ROUGE value out of each pair of highly-
correlated metrics) from the linear combination
slightly improved summarization quality, but the
improvement was not statistically significant. Dis-
carding bottom ranked features (up to 50%), also,
did not affect the results significantly.
Table 5 shows the best vectors generated from
training MUSE on all the documents in the En-
glish, Hebrew, and multilingual (one of 10 bal-
anced) corpora and their ROUGE training scores
and number of GA iterations.
While the optimal values of the weights are ex-
pected to be nonnegative, among the actual re-
sults are some negative values. Although there
is no simple explanation for this outcome, it may
be related to a well-known phenomenon from Nu-
merical Analysis called over-relaxation (Friedman
13
submitted to publication
933
and Kandel, 1994). For example, Laplace equa-
tion φ
xx
+ φ
yy
= 0 is iteratively solved over a
grid of points as follows: At each grid point let
φ
(n)
,
φ
(n)
denote the n
th
iteration as calculated
from the differential equation and its modified fi-
nal value, respectively. The final value is chosen
as ωφ
(n)
+ (1 − ω)
φ
(n−1)
. While the sum of the
two weights is obviously 1, the optimal value of ω,
which minimizes the number of iterations needed
for convergence, usually satisfies 1 < ω < 2
(i.e., the second weight 1 − ω is negative) and ap-
proaches 2 the finer the grid gets. Though some-
what unexpected, this surprising result can be rig-
orously proved (Varga, 1962).
Table 3: Results of 10-fold cross validation
ENG HEB MULT
Train 0.4483 0.5993 0.5205
Test 0.4461 0.5936 0.5027
Table 4: Summarization performance. Mean
ROUGE-1
Metric ENG HEB MULT
MUSE 0.4461 0.5921 0.4633
COV
DEG 0.4363 0.5679 0.4588
D
COV J 0.4251 0.5748 0.4512
POS
F 0.4190 0.5678 0.4440
ML
TR 0.4138 0.5190 0.4288
MS
SUM 0.3097 0.4114 0.3184
Assuming efficient implementation, most met-
rics have a linear computational complexity rela-
tive to the total number of words in a document
- O(n). As a result, MUSE total computation
time, given a trained model, is also linear (at fac-
tor of the number of metrics in a combination).
The training time is proportional to the number of
GA iterations multiplied by the number of indi-
viduals in a population times the fitness evaluation
(ROUGE) time. On average, in our experiments
the GA performed 5 − 6 iterations—selection and
reproduction—before reaching convergence.
5 Conclusions and future work
In this paper we introduced MUSE, a new, GA-
based approach to multilingual extractive sum-
marization. We evaluated the proposed method-
ology on two languages from different language
families: English and Hebrew. The experimen-
tal results showed that MUSE significantly out-
performed TextRank, the best known language-
Table 5: Induced weights for the best linear com-
bination of scoring metrics
Metric ENG HEB MULT
COV DEG 8.490 0.171 0.697
KEY
DEG 15.774 0.218 -2.108
KEY 4.734 0.471 0.346
COV
PR -4.349 0.241 -0.462
COV 10.016 -0.112 0.865
D
COV C -9.499 -0.163 1.112
D
COV J 11.337 0.710 2.814
KEY
PR 0.757 0.029 -0.326
LUHN
DEG 6.970 0.211 0.113
POS
F 6.875 0.490 0.255
LEN
CH 1.333 -0.002 0.214
LUHN -2.253 -0.060 0.411
LUHN
PR 1.878 -0.273 -2.335
LEN
W -13.204 -0.006 1.596
ML
TR 8.493 0.340 1.549
TITLE
E J -5.551 -0.060 -1.210
TITLE
E O -21.833 0.074 -1.537
D
COV E J 1.629 0.302 0.196
D
COV O 5.531 -0.475 0.431
TFISF -0.333 -0.503 0.232
DEG 3.584 -0.218 0.059
D
COV E O 8.557 -0.130 -1.071
PR 5.891 -0.639 1.793
TITLE
J -7.551 0.071 1.445
TF 0.810 0.202 -0.650
TITLE
O -11.996 0.179 -0.634
SVD -0.557 0.137 0.384
TITLE
C 5.536 -0.029 0.933
POS
B -5.350 0.347 1.074
GRASE -2.197 -0.116 -1.655
POS
L -22.521 -0.408 -3.531
Score 0.4549 0.6019 0.526
Iterations 10 6 7
independent approach, in both Hebrew and En-
glish using either monolingual or bilingual cor-
pora. Moreover, our results suggest that the same
weighting model is applicable across multiple lan-
guages. In future work, one may:
- Evaluate MUSE on additional languages and lan-
guage families.
- Incorporate threshold values for threshold-based
methods (Table 2) into the GA-based optimization
procedure.
- Improve performance of similarity-based metrics
in the multilingual domain.
- Apply additional optimization techniques like
Evolution Strategy (Beyer and Schwefel, 2002),
which is known to perform well in a real-valued
search space.
- Extend the search for the best summary to the
problem of multi-object optimization, combining
several summary quality metrics.
934
Acknowledgments
We are grateful to Michael Elhadad and Galina
Volk from Ben-Gurion University for providing
the ROUGE toolkit adapted to the Hebrew alpha-
bet, and to Slava Kisilevich from the University
of Konstanz for the technical support in evaluation
experiments.
References
P. B. Baxendale. 1958. Machine-made index for tech-
nical literaturean experiment. IBM Journal of Re-
search and Development, 2(4):354–361.
H G. Beyer and H P. Schwefel. 2002. Evolution
strategies: A comprehensive introduction. Journal
Natural Computing, 1(1):3–52.
S. Brin and L. Page. 1998. The anatomy of a large-
scale hypertextual web search engine. Computer
networks and ISDN systems, 30(1-7):107–117.
DUC. 2002. Document understanding conference.
.
H. P. Edmundson. 1969. New methods in automatic
extracting. ACM, 16(2).
G. Erkan and D. R. Radev. 2004. Lexrank: Graph-
based lexical centrality as salience in text summa-
rization. Journal of Artificial Intelligence Research,
22:457–479.
K. Filippova, M. Surdeanu, M. Ciaramita, and
H. Zaragoza. 2009. Company-oriented extractive
summarization of financial news. In Proceedings
of the 12th Conference of the European Chapter
of the Association for Computational Linguistics,
pages 246–254.
M. Friedman and A. Kandel. 1994. Fundamentals of
Computer Numerical Analysis. CRC Press.
D. E. Goldberg. 1989. Genetic algorithms in search,
optimization and machine learning. Addison-
Wesley.
J. Goldstein, M. Kantrowitz, V. Mittal, and J. Car-
bonell. 1999. Summarizing text documents: Sen-
tence selection and evaluation metrics. In Proceed-
ings of the 22nd Annual International ACM SIGIR
Conference on Research and Development in Infor-
mation Retrieval, pages 121–128.
Y. Gong and X. Liu. 2001. Generic text summarization
using relevance measure and latent semantic analy-
sis. In Proceedings of the 24th ACM SIGIR confer-
ence on Research and development in information
retrieval, pages 19–25.
A. Gulli and A. Signorini. 2005. The indexable web is
more than 11.5 billion pages. .
uiowa.edu/
˜
asignori/web-size/.
M. Hassel and J. Sjobergh. 2006. Towards holistic
summarization: Selecting summaries, not sentences.
In Proceedings of Language Resources and Evalua-
tion.
K. Ishikawa, S-I. ANDO, S-I. Doi, and A. Okumura.
2002. Trainable automatic text summarization using
segmentation of sentence. In Proceedings of 2002
NTCIR 3 TSC workshop.
F. J. Kallel, M. Jaoua, L. B. Hadrich, and A. Ben
Hamadou. 2004. Summarization at laris labora-
tory. In Proceedings of the Document Understand-
ing Conference.
J.M. Kleinberg. 1999. Authoritative sources in a
hyperlinked environment. Journal of the ACM
(JACM), 46(5):604–632.
J. Kupiec, J. Pedersen, and F Chen. 1995. A trainable
document summarizer. In Proceedings of the 18th
annual international ACM SIGIR conference, pages
68–73.
C.Y. Lin and E. Hovy. 1997. Identifying topics by po-
sition. In Proceedings of the fifth conference on Ap-
plied natural language processing, pages 283–290.
Chin-Yew Lin and Eduard Hovy. 2003. Auto-
matic evaluation of summaries using n-gram co-
occurrence statistics. In NAACL ’03: Proceedings of
the 2003 Conference of the North American Chapter
of the Association for Computational Linguistics on
Human Language Technology, pages 71–78.
Chin-Yew Lin. 2004. Rouge: A package for auto-
matic evaluation of summaries. In Proceedings of
the Workshop on Text Summarization Branches Out
(WAS 2004), pages 25–26.
M. Litvak and M. Last. 2008. Graph-based keyword
extraction for single-document summarization. In
Proceedings of the Workshop on Multi-source Multi-
lingual Information Extraction and Summarization,
pages 17–24.
D. Liu, Y. He, D. Ji, and H. Yang. 2006a. Genetic al-
gorithm based multi-document summarization. Lec-
ture Notes in Computer Science, 4099:1140.
D. Liu, Y. Wang, C. Liu, and Z. Wang. 2006b. Mul-
tiple documents summarization based on genetic
algorithm. Lecture Notes in Computer Science,
4223:355.
H. P. Luhn. 1958. The automatic creation of literature
abstracts. IBM Journal of Research and Develop-
ment, 2:159–165.
Inderjeet Mani. 2001. Automatic Summarization. Nat-
ural Language Processing, John Benjamins Publish-
ing Company.
Rada Mihalcea. 2005. Language independent extrac-
tive summarization. In AAAI’05: Proceedings of the
20th national conference on Artificial intelligence,
pages 1688–1689.
935
J.L. Neto, A.D. Santos, C.A.A. Kaestner, and A.A. Fre-
itas. 2000. Generating text summaries through the
relative importance of topics. Lecture Notes in Com-
puter Science, pages 300–309.
Constantin Or
˘
asan, Richard Evans, and Ruslan Mitkov.
2000. Enhancing preference-based anaphora res-
olution with genetic algorithms. In Dimitris
Christodoulakis, editor, Proceedings of the Second
International Conference on Natural Language Pro-
cessing, volume 1835, pages 185 – 195, Patras,
Greece, June 2– 4. Springer.
Dragomir Radev, Sasha Blair-Goldensohn, and Zhu
Zhang. 2001. Experiments in single and multidoc-
ument summarization using mead. First Document
Understanding Conference.
Horacio Saggion, Kalina Bontcheva, and Hamish Cun-
ningham. 2003. Robust generic and query-based
summarisation. In EACL ’03: Proceedings of the
tenth conference on European chapter of the Associ-
ation for Computational Linguistics.
G. Salton, A. Singhal, M. Mitra, and C. Buckley. 1997.
Automatic text structuring and summarization. In-
formation Processing and Management, 33(2):193–
207.
C. N. Satoshi, S. Satoshi, M. Murata, K. Uchimoto,
M. Utiyama, and H. Isahara. 2001. Sentence ex-
traction system assembling multiple evidence. In
Proceedings of 2nd NTCIR Workshop, pages 319–
324.
A. Schenker, H. Bunke, M. Last, and A. Kandel. 2004.
Classification of web documents using graph match-
ing. International Journal of Pattern Recognition
and Artificial Intelligence, 18(3):475–496.
A. Schenker, H. Bunke, M. Last, and A. Kandel. 2005.
Graph-theoretic techniques for web content mining.
J. Steinberger and K. Jezek. 2004. Text summarization
and singular value decomposition. Lecture Notes in
Computer Science, pages 245–254.
S. Teufel and M. Moens. 1997. Sentence extraction as
a classification task. In Proceedings of the Workshop
on Intelligent Scalable Summarization, ACL/EACL
Conference, pages 58–65.
Peter D. Turney. 2000. Learning algorithms
for keyphrase extraction. Information Retrieval,
2(4):303–336.
L. Vanderwende, H. Suzuki, C. Brockett, and
A. Nenkova. 2007. Beyond sumbasic: Task-
focused summarization with sentence simplification
and lexical expansion. Information processing and
management, 43(6):1606–1618.
R.S. Varga. 1962. Matrix Iterative Methods. Prentice-
Hall.
G. A. Vignaux and Z. Michalewicz. 1991. A ge-
netic algorithm for the linear transportation problem.
IEEE Transactions on Systems, Man and Cybernet-
ics, 21:445–452.
K.F. Wong, M. Wu, and W. Li. 2008. Extractive sum-
marization using supervised and semi-supervised
learning. In Proceedings of the 22nd International
Conference on Computational Linguistics-Volume 1,
pages 985–992.
936