Báo cáo khoa học: "A Comparative Study of Parameter Estimation Methods for Statistical Natural Language Processing" potx
Bạn đang xem bản rút gọn của tài liệu. Xem và tải ngay bản đầy đủ của tài liệu tại đây (478.96 KB, 8 trang )
Proceedings of the 45th Annual Meeting of the Association of Computational Linguistics, pages 824–831,
Prague, Czech Republic, June 2007.
c
2007 Association for Computational Linguistics
A Comparative Study of Parameter Estimation Methods for
Statistical Natural Language Processing
Jianfeng Gao
*
, Galen Andrew
*
, Mark Johnson
*&
, Kristina Toutanova
*
*
Microsoft Research, Redmond WA 98052, {jfgao,galena,kristout}@microsoft.com
&
Brown University, Providence, RI 02912,
Abstract
This paper presents a comparative study of
five parameter estimation algorithms on four
NLP tasks. Three of the five algorithms are
well-known in the computational linguistics
community: Maximum Entropy (ME) estima-
tion with L
2
regularization, the Averaged
Perceptron (AP), and Boosting. We also in-
vestigate ME estimation with L
1
regularization
using a novel optimization algorithm, and
BLasso, which is a version of Boosting with
Lasso (L
1
) regularization. We first investigate
all of our estimators on two re-ranking tasks: a
parse selection task and a language model
(LM) adaptation task. Then we apply the best
of these estimators to two additional tasks
involving conditional sequence models: a
Conditional Markov Model (CMM) for part of
speech tagging and a Conditional Random
Field (CRF) for Chinese word segmentation.
Our experiments show that across tasks, three
of the estimators — ME estimation with L
1
or
L
2
regularization, and AP — are in a near sta-
tistical tie for first place.
1 Introduction
Parameter estimation is fundamental to many sta-
tistical approaches to NLP. Because of the
high-dimensional nature of natural language, it is
often easy to generate an extremely large number of
features. The challenge of parameter estimation is
to find a combination of the typically noisy, re-
dundant features that accurately predicts the target
output variable and avoids overfitting. Intuitively,
this can be achieved either by selecting a small
number of highly-effective features and ignoring
the others, or by averaging over a large number of
weakly informative features. The first intuition
motivates feature selection methods such as
Boosting and BLasso (e.g., Collins 2000; Zhao and
Yu, 2004), which usually work best when many
features are completely irrelevant. L
1
or Lasso
regularization of linear models, introduced by
Tibshirani (1996), embeds feature selection into
regularization so that both an assessment of the
reliability of a feature and the decision about
whether to remove it are done in the same frame-
work, and has generated a large amount of interest
in the NLP community recently (e.g., Goodman
2003; Riezler and Vasserman 2004). If on the other
hand most features are noisy but at least weakly
correlated with the target, it may be reasonable to
attempt to reduce noise by averaging over all of the
features. ME estimators with L
2
regularization,
which have been widely used in NLP tasks (e.g.,
Chen and Rosenfeld 2000; Charniak and Johnson
2005; Johnson et al. 1999), tend to produce models
that have this property. In addition, the perceptron
algorithm and its variants, e.g., the voted or aver-
aged perceptron, is becoming increasingly popular
due to their competitive performance, simplicity in
implementation and low computational cost in
training (e.g., Collins 2002).
While recent studies claim advantages for L
1
regularization, this study is the first of which we are
aware to systematically compare it to a range of
estimators on a diverse set of NLP tasks. Gao et al.
(2006) showed that BLasso, due to its explicit use of
L
1
regularization, outperformed Boosting in the LM
adaptation task. Ng (2004) showed that for logistic
regression, L
1
regularization outperforms L
2
regu-
larization on artificial datasets which contain many
completely irrelevant features. Goodman (2003)
showed that in two out of three tasks, an ME esti-
mator with a one-sided Laplacian prior (i.e., L
1
regularization with the constraint that all feature
weights are positive) outperformed a comparable
estimator using a Gaussian prior (i.e., L
2
regulari-
zation). Riezler and Vasserman (2004) showed that
an L
1
-regularized ME estimator outperformed an
L
2
-regularized estimator for ranking the parses of a
stochastic unification-based grammar.
824
While these individual estimators are well de-
scribed in the literature, little is known about the
relative performance of these methods because the
published results are generally not directly compa-
rable. For example, in the parse re-ranking task,
one cannot tell whether the L
2
- regularized ME
approach used by Charniak and Johnson (2005)
significantly outperforms the Boosting method by
Collins (2000) because different feature sets and
n-best parses were used in the evaluations of these
methods.
This paper conducts a much-needed comparative
study of these five parameter estimation algorithms
on four NLP tasks: ME estimation with L
1
and L
2
regularization, the Averaged Perceptron (AP),
Boosting, and BLasso, a version of Boosting with
Lasso (L
1
) regularization. We first investigate all of
our estimators on two re-ranking tasks: a parse
selection task and a language model adaptation task.
Then we apply the best of these estimators to two
additional tasks involving conditional sequence
models: a CMM for POS tagging and a CRF for
Chinese word segmentation. Our results show that
ME estimation with L
2
regularization achieves the
best performing estimators in all of the tasks, and
AP achieves almost as well and requires much less
training time. L
1
(Lasso) regularization also per-
forms well and leads to sparser models.
2 Estimators
All the four NLP tasks studied in this paper are
based on linear models (Collins 2000) which re-
quire learning a mapping from inputs to
outputs . We are given:
Training samples (
,
) for = 1,
A procedure to generate a set of candi-
dates () for an input x,
A feature mapping Φ: ×
to map
each (, ) to a vector of feature values, and
A parameter vector
, which assigns a
real-valued weight to each feature.
For all models except the CMM sequence model for
POS tagging, the components , Φ and di-
rectly define a mapping from an input to an output
() as follows:
= arg max
Φ
,
.
(1)
In the CMM sequence classifier, locally normalized
linear models to predict the tag of each word token
are chained together to arrive at a probability esti-
mate for the entire tag sequence, resulting in a
slightly different decision rule.
Linear models, though simple, can capture very
complex dependencies because the features can be
arbitrary functions of the input/output pair. For
example, we can define a feature to be the log con-
ditional probability of the output as estimated by
some other model, which may in turn depend on
arbitrarily complex interactions of „basic‟ features.
In practice, with an appropriate feature set, linear
models achieve very good empirical results on
various NLP tasks. The focus of this paper however
is not on feature definition (which requires domain
knowledge and varies from task to task), but on
parameter estimation (which is generic across
tasks). We assume we are given fixed feature
templates from which a large number of features are
generated. The task of the estimator is to use the
training samples to choose a parameter vector ,
such that the mapping () is capable of correctly
classifying unseen examples. We will describe the
five estimators in our study individually.
2.1 ME estimation with L
2
regularization
Like many linear models, the ME estimator chooses
to minimize the sum of the empirical loss on the
training set and a regularization term:
= arg min
+
.
(2)
In this case, the loss term L(w) is the negative con-
ditional log-likelihood of the training data,
=
log
)
=1
, where
) =
exp
Φ
,
exp(Φ
,
′
)
′
and the regularizer term
=
2
is the
weighted squared L
2
norm of the parameters. Here,
is a parameter that controls the amount of regu-
larization, optimized on held-out data.
This is one of the most popular estimators,
largely due to its appealing computational proper-
ties: both
and () are convex and differen-
tiable, so gradient-based numerical algorithms can
be used to find the global minimum efficiently.
In our experiments, we used the limited memory
quasi-Newton algorithm (or L-BFGS, Nocedal and
Wright 1999) to find the optimal because this
method has been shown to be substantially faster
than other methods such as Generalized Iterative
Scaling (Malouf 2002).
825
Because for some sentences there are multiple
best parses (i.e., parses with the same F-Score), we
used the variant of ME estimator described in
Riezler et al. (2002), where
is defined as the
likelihood of the best parses () relative to
the n-best parser output
, (i.e.,
()):
=
log
(
|
)
(
)
=1
.
We applied this variant in our experiments of
parse re-ranking and LM adaptation, and found that
on both tasks it leads to a significant improvement
in performance for the L
2
-regularied ME estimator
but not for the L
1
-regularied ME estimator.
2.2 ME estimation with L
1
regularization
This estimator also minimizes the negative condi-
tional log-likelihood, but uses an L
1
(or Lasso)
penalty. That is, () in Equation (2) is defined
according to
=
. L
1
regularization
typically leads to sparse solutions in which many
feature weights are exactly zero, so it is a natural
candidate when feature selection is desirable. By
contrast, L
2
regularization produces solutions in
which most weights are small but non-zero.
Optimizing the L
1
-regularized objective function
is challenging because its gradient is discontinuous
whenever some parameter equals zero. Kazama and
Tsujii (2003) described an estimation method that
constructs an equivalent constrained optimization
problem with twice the number of variables.
However, we found that this method is impracti-
cally slow for large-scale NLP tasks. In this work
we use the orthant-wise limited-memory qua-
si-Newton algorithm (OWL-QN), which is a mod-
ification of L-BFGS that allows it to effectively
handle the discontinuity of the gradient (Andrew
and Gao 2007). We provide here a high-level de-
scription of the algorithm.
A quasi-Newton method such as L-BFGS uses
first order information at each iterate to build an
approximation to the Hessian matrix, , thus mod-
eling the local curvature of the function. At each
step, a search direction is chosen by minimizing a
quadratic approximation to the function:
=
1
2
0
′
0
+
0
′
(
0
)
where
0
is the current iterate, and
0
is the func-
tion gradient at
0
. If is positive definite, the
minimizing value of can be computed analytically
according to:
=
0
1
0
.
L-BFGS maintains vectors of the change in gradient
1
from the most recent iterations, and uses
them to construct an estimate of the inverse Hessian
. Furthermore, it does so in such a way that
1
0
can be computed without expanding out the
full matrix, which is typically unmanageably large.
The computation requires a number of operations
linear in the number of variables.
OWL-QN is based on the observation that when
restricted to a single orthant, the L
1
regularizer is
differentiable, and is in fact a linear function of .
Thus, so long as each coordinate of any two con-
secutive search points does not pass through zero,
() does not contribute at all to the curvature of
the function on the segment joining them. There-
fore, we can use L-BFGS to approximate the Hes-
sian of
alone, and use it to build an approxi-
mation to the full regularized objective that is valid
on a given orthant. To ensure that the next point is in
the valid region, we project each point during the
line search back onto the chosen orthant.
1
At each
iteration, we choose the orthant containing the
current point and into which the direction giving the
greatest local rate of function decrease points.
This algorithm, although only a simple modifi-
cation of L-BFGS, works quite well in practice. It
typically reaches convergence in even fewer itera-
tions than standard L-BFGS takes on the analogous
L
2
-regularized objective (which translates to less
training time, since the time per iteration is only
negligibly higher, and total time is dominated by
function evaluations). We describe OWL-QN more
fully in (Andrew and Gao 2007). We also show that
it is significantly faster than Kazama and Tsujii‟s
algorithm for L
1
regularization and prove that it is
guaranteed converge to a parameter vector that
globally optimizes the L
1
-regularized objective.
2.3 Boosting
The Boosting algorithm we used is based on Collins
(2000). It optimizes the pairwise exponential loss
(ExpLoss) function (rather than the logarithmic loss
optimized by ME). Given a training sample
(
,
), for each possible output
(
), we
1
This projection just entails zeroing-out any coordinates
that change sign. Note that it is possible for a variable to
change sign in two iterations, by moving from a negative
value to zero, and on a the next iteration moving from
zero to a positive value.
826
define the margin of the pair (
,
) with respect to
as
,
= Φ
,
Φ
,
.
Then ExpLoss is defined as
ExpLoss
= exp My
i
, y
j
(3)
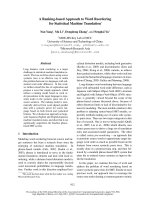
Figure 1 summarizes the Boosting algorithm we
used. It is an incremental feature selection proce-
dure. After initialization, Steps 2 and 3 are repeated
T times; at each iteration, a feature is chosen and its
weight is updated as follows.
First, we define Upd(, , ) as an updated
model, with the same parameter values as with
the exception of
, which is incremented by :
Upd
, ,
= (
1
, ,
+ , ,
)
Then, Steps 2 and 3 in Figure 1 can be rewritten as
Equations (4) and (5), respectively.
,
= arg min
,
ExpLoss(Upd
, ,
)
(4)
= Upd(
1
,
,
)
(5)
Because Boosting can overfit we update the weight
of
by a small fixed step size
, as in Equation (6),
following the FSLR algorithm (Hastie et al. 2001).
= Upd(
1
,
, × sign
)
(6)
By taking such small steps, Boosting imposes a
kind of implicit regularization, and can closely
approximate the effect of L
1
regularization in a local
sense (Hastie et al. 2001). Empirically, smaller
values of lead to smaller numbers of test errors.
2.4 Boosted Lasso
The Boosted Lasso (BLasso) algorithm was origi-
nally proposed in Zhao and Yu (2004), and was
adapted for language modeling by Gao et al. (2006).
BLasso can be viewed as a version of Boosting with
L
1
regularization. It optimizes an L
1
-regularized
ExpLoss function:
LassoLoss
= ExpLoss() + ()
(7)
where
=
.
BLasso also uses an incremental feature selec-
tion procedure to learn parameter vector , just as
Boosting does. Due to the explicit use of the regu-
larization term (), however, there are two major
differences from Boosting.
At each iteration, BLasso takes either a forward
step or a backward step. Similar to Boosting, at
each forward step, a feature is selected and its
weight is updated according to Eq. (8) and (9).
,
=
,=±
ExpLoss(Upd
, ,
)
(8)
= Upd(
1
,
, × sign
)
(9)
There is a small but important difference between
Equations (8) and (4). In Boosting, as shown in
Equation (4), a feature is selected by its impact on
reducing the loss with its optimal update
. By
contrast, in BLasso, as shown in Equation (8),
rather than optimizing over for each feature, the
loss is calculated with an update of either + or ,
i.e., grid search is used for feature weight estima-
tion. We found in our experiments that this mod-
ification brings a consistent improvement.
The backward step is unique to BLasso. At each
iteration, a feature is selected and the absolute value
of its weight is reduced by if and only if it leads to
a decrease of the LassoLoss, as shown in Equations
(10) and (11), where
is a tolerance parameter.
= arg min
:
0
ExpLoss(Upd(, , sign
)
(10)
= Upd(
1
,
,sign(
) × )
(11)
if LassoLoss
1
,
1
LassoLoss
,
>
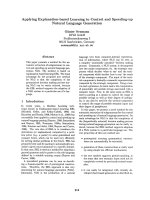
Figure 2 summarizes the BLasso algorithm we
used. After initialization, Steps 4 and 5 are repeated
T times; at each iteration, a feature is chosen and its
weight is updated either backward or forward by a
fixed amount . Notice that the value of is adap-
tively chosen according to the reduction of ExpLoss
during training. The algorithm starts with a large
initial , and then at each forward step the value of
decreases until ExpLoss stops decreasing. This is
intuitively desirable: it is expected that most highly
effective features are selected in early stages of
training, so the reduction of ExpLoss at each step in
early stages are more substantial than in later stages.
These early steps coincide with the Boosting steps
most of the time. In other words, the effect of
backward steps is more visible at later stages. It can
be proved that for a finite number of features and
=0, the BLasso algorithm shown in Figure 2
converges to the Lasso solution when 0. See
Gao et al. (2006) for implementation details, and
Zhao and Yu (2004) for a theoretical justification
for BLasso.
1
Set w
0
= argmin
w0
ExpLoss(w); and w
d
= 0 for d=1…D
2
Select a feature f
k*
which has largest estimated
impact on reducing ExpLoss of Equation (3)
3
Update λ
k*
λ
k*
+ δ*,
and return to Step 2
Figure 1: The boosting algorithm
827
2.5 Averaged Perceptron
The perceptron algorithm can be viewed as a form
of incremental training procedure (e.g., using sto-
chastic approximation) that optimizes a minimum
square error (MSE) loss function (Mitchell, 1997).
As shown in Figure 3, it starts with an initial pa-
rameter setting and updates it for each training
example. In our experiments, we used the Averaged
Perceptron algorithm of Freund and Schapire
(1999), a variation that has been shown to be more
effective than the standard algorithm (Collins
2002). Let
,
be the parameter vector after the
th
training sample has been processed in pass over
the training data. The average parameters are de-
fined as
=
,
where T is the number of
epochs, and N is the number of training samples.
3 Evaluations
From the four tasks we consider, parsing and lan-
guage model adaptation are both examples of
re-ranking. In these tasks, we assume that we have
been given a list of candidates () for each
training or test sample
,
, generated using a
baseline model. Then, a linear model of the form in
Equation (1) is used to discriminatively re-rank the
candidate list using additional features which may
or may not be included in the baseline model. Since
the mapping from to by the linear model may
make use of arbitrary global features of the output
and is performed “all at once”, we call such a linear
model a global model.
In the other two tasks (i.e., Chinese word seg-
mentation and POS tagging), there is no explicit
enumeration of (). The mapping from to
is determined by a sequence model which aggre-
gates the decisions of local linear models via a
dynamic program. In the CMM, the local linear
models are trained independently, while in the CRF
model, the local models are trained jointly. We call
these two linear models local models because they
dynamically combine the output of models that use
only local features.
While it is straightforward to apply the five es-
timators to global models in the re-ranking
framework, the application of some estimators to
the local models is problematic. Boosting and
BLasso are too computationally expensive to be
applied to CRF training and we compared the other
three better performing estimation methods for this
model. The CMM is a probabilistic sequence model
and the log-loss used by ME estimation is most
natural for it; thus we limit the comparison to the
two kinds of ME models for CMMs. Note that our
goal is not to compare locally trained models to
globally trained ones; for a study which focuses on
this issue, see (Punyakanok et al. 2005).
In each task we compared the performance of
different estimators using task-specific measures.
We used the Wilcoxon signed rank test to test the
statistical significance of the difference among the
competing estimators. We also report other results
such as number of non-zero features after estima-
tion, number of training iterations, and computation
time (in minutes of elapsed time on an XEON
TM
MP
3.6GHz machine).
3.1 Parse re-ranking
We follow the experimental paradigm of parse
re-ranking outlined in Charniak and Johnson
(2005), and fed the features extracted by their pro-
gram to the five rerankers we developed. Each uses
a linear model trained using one of the five esti-
mators. These rerankers attempt to select the best
parse for a sentence from the 50-best list of
possible parses
for the sentence. The li-
near model combines the log probability calculated
by the Charniak (2000) parser as a feature with
1,219,272 additional features. We trained the fea-
1
Initialize w
0
: set w
0
= argmin
w0
ExpLoss(w), and w
d
= 0
for d=1…D.
2
Take a forward step according to Eq. (8) and (9), and
the updated model is denoted by w
1
3
Initialize
= (ExpLoss(w
0
)-ExpLoss(w
1
))/
4
Take a backward step if and only if it leads to a de-
crease of LassoLoss according to Eq. (10) and (11),
where
= 0; otherwise
5
Take a forward step according to Eq. (8) and (9);
update
= min(
, (ExpLoss(w
t-1
)-ExpLoss(w
t
))/
);
and return to Step 4.
Figure 2: The BLasso algorithm
1
Set w
0
= 1 and w
d
= 0 for d=1…D
2
For t = 1…T (T = the total number of iterations)
3
For each training sample (x
i
, y
i
), i = 1…N
4
= arg max
_
,
Choose the best candidate z
i
from GEN(x
i
) using
the current model w,
5
w = w + η((x
i
, y
i
) – (x
i
, z
i
)), where η is the size of
learning step, optimized on held-out data.
Figure 3: The perceptron algorithm
828
ture weights w on Sections 2-19 of the Penn Tree-
bank, adjusted the regularizer constant to max-
imize the F-Score on Sections 20-21 of the Tree-
bank, and evaluated the rerankers on Section 22.
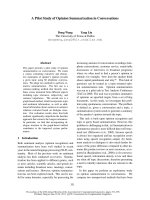
The results are presented in Tables 1
2
and 2, where
Baseline results were obtained using the parser by
Charniak (2000).
The ME estimation with L
2
regularization out-
performs all of the other estimators significantly
except for the AP, which performs almost as well
and requires an order of magnitude less time in
training. Boosting and BLasso are feature selection
methods in nature, so they achieve the sparsest
models, but at the cost of slightly lower perfor-
mance and much longer training time. The
L
1
-regularized ME estimator also produces a rela-
tively sparse solution whereas the Averaged Per-
ceptron and the L
2
-regularized ME estimator assign
almost all features a non-zero weight.
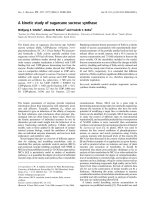
3.2 Language model adaptation
Our experiments with LM adaptation are based on
the work described in Gao et al. (2006). The va-
riously trained language models were evaluated
according to their impact on Japanese text input
accuracy, where input phonetic symbols are
mapped into a word string . Performance of the
application is measured in terms of character error
2
The result of ME/L2 is better than that reported in
Andrew and Gao (2007) due to the use of the variant of
L
2
-regularized ME estimator, as described in Section 2.1.
CER
# features
time (min)
#train iter
Baseline
10.24%
MAP
7.98%
ME/L2
6.99%
295,337
27
665
ME/L1
7.01%
53,342
25
864
AP
7.23%
167,591
6
56
Boost
7.54%
32,994
175
71,000
BLasso
7.20%
33,126
238
250,000
Table 3. Performance summary of estimators
(lower is better) on language model adaptation
ME/L2
ME/L1
AP
Boost
BLasso
ME/L2
~
>>
>>
>>
ME/L1
~
>>
>>
>>
AP
<<
<<
>>
~
Boost
<<
<<
<<
<<
BLasso
<<
<<
~
>>
Table 4. Statistical significance test results.
rate (CER), which is the number of characters
wrongly converted from divided by the number of
characters in the correct transcript.
Again we evaluated five linear rerankers, one for
each estimator. These rerankers attempt to select the
best conversions for an input phonetic string
from a 100-best list ()of possible conver-
sions proposed by a baseline system. The linear
model combines the log probability under a trigram
language model as base feature and additional
865,190 word uni/bi-gram features. These
uni/bi-gram features were already included in the
trigram model which was trained on a background
domain corpus (Nikkei Newspaper). But in the
linear model their feature weights were trained
discriminatively on an adaptation domain corpus
(Encarta Encyclopedia). Thus, this forms a cross
domain adaptation paradigm. This also implies that
the portion of redundant features in this task could
be much larger than that in the parse re-ranking
task, especially because the background domain is
reasonably similar to the adaptation domain.
We divided the Encarta corpus into three sets
that do not overlap. A 72K-sentences set was used
as training data, a 5K-sentence set as development
data, and another 5K-sentence set as testing data.
The results are presented in Tables 3 and 4, where
Baseline is the word-based trigram model trained
on background domain corpus, and MAP (maxi-
mum a posteriori) is a traditional model adaptation
method, where the parameters of the background
model are adjusted so as to maximize the likelihood
of the adaptation data.
F-Score
# features
time (min)
# train iter
Baseline
0.8986
ME/L2
0.9176
1,211,026
62
129
ME/L1
0.9165
19,121
37
174
AP
0.9164
939,248
2
8
Boosting
0.9131
6,714
495
92,600
BLasso
0.9133
8,085
239
56,500
Table 1: Performance summary of estimators on
parsing re-ranking (ME/L2: ME with L
2
regulari-
zation; ME/L1: ME with L
1
regularization)
ME/L2
ME/L1
AP
Boost
BLasso
ME/L2
>>
~
>>
>>
ME/L1
<<
~
>
~
AP
~
~
>>
>
Boost
<<
<
<<
~
Blasso
<<
~
<
~
Table 2: Statistical significance test results (“>>”
or “<<” means P-value < 0.01; > or < means 0.01 <
P-value 0.05; “~” means P-value > 0.05)
829
The results are more or less similar to those in
the parsing task with one visible difference: L
1
regularization achieved relatively better perfor-
mance in this task. For example, while in the
parsing task ME with L
2
regularization significantly
outperforms ME with L
1
regularization, their per-
formance difference is not significant in this task.
While in the parsing task the performance differ-
ence between BLasso and Boosting is not signifi-
cant, BLasso outperforms Boosting significantly in
this task. Considering that a much higher propor-
tion of the features are redundant in this task than
the parsing task, the results seem to corroborate the
observation that L
1
regularization is robust to the
presence of many redundant features.
3.3 Chinese word segmentation
Our third task is Chinese word segmentation
(CWS). The goal of CWS is to determine the
boundaries between words in a section of Chinese
text. The model we used is the hybrid Mar-
kov/semi- Markov CRF described by Andrew
(2006), which was shown to have state-of-the-art
accuracy. We tested models trained with the various
estimation methods on the Microsoft Research Asia
corpus from the Second International Chinese Word
Segmentation, and we used the same train/test split
used in the competition. The model and experi-
mental setup is identical with that of Andrew (2006)
except for two differences. First, we extracted
features from both positive and negative training
examples, while Andrew (2006) uses only features
that occur in some positive training example.
Second, we used the last 4K sentences of the
training data to select the weight of the regularizers
and to determine when to stop perceptron training.
We compared three of the best performing es-
timation procedures on this task: ME with L
2
regu-
larization, ME with L
1
regularization, and the Av-
eraged Perceptron. In this case, ME refers to mi-
nimizing the negative log-probability of the correct
segmentation, which is globally normalized, while
the perceptron is trained using at each iteration the
exact maximum-scoring segmentation with the
current weights. We observed the same pattern as in
the other tasks: the three algorithms have nearly
identical performance, while L
1
uses only 6% of the
features, and the Averaged Perceptron requires
significantly fewer training iterations. In this case,
L
1
was also several times faster than L
2
. The results
are summarized in Table 5.
3
We note that all three algorithms performed
slightly better than the model used by Andrew
(2006), which also used L
2
regularization (96.84
F
1
). We believe the difference is due to the use of
features derived from negative training examples.
3.4 POS tagging
Finally we studied the impact of the regularization
methods on a Maximum Entropy conditional
Markov Model (MEMM, McCallum et al. 2000) for
POS tagging. MEMMs decompose the conditional
probability of a tag sequence given a word sequence
as follows:
1
1
= (
|
1
,
1
)
=1
where the probability distributions for each tag
given its context are ME models. Following pre-
vious work (Ratnaparkhi, 1996), we assume that the
tag of a word is independent of the tags of all pre-
ceding words given the tags of the previous two
words (i.e., =2 in the equation above). The local
models at each position include features of the
current word, the previous word, the next word, and
features of the previous two tags. In addition to
lexical identity of the words, we used features of
word suffixes, capitalization, and number/special
character signatures of the words.
We used the standard splits of the Penn Treebank
from the tagging literature (Toutanova et al. 2003)
for training, development and test sets. The training
set comprises Sections 0-18, the development set —
Sections 19-21, and the test set — Sections 22-24.
We compared training the ME models using L
1
and
L
2
regularization. For each of the two types of
regularization we selected the best value of the
regularization constant using grid search to optim-
ize the accuracy on the development set. We report
final accuracy measures on the test set in Table 6.
The results on this task confirm the trends we
have seen so far. There is almost no difference in
3
Only the L2 vs. AP comparison is significant at a 0.05
level according to the Wilcoxon signed rank test.
Test F
1
# features
# train iter
ME/L2
0.9719
8,084,086
713
ME/L1
0.9713
317,146
201
AP
0.9703
1,965,719
162
Table 5. Performance summary of estimators on
CWS
830
accuracy of the two kinds of regularizations, and
indeed the differences were not statistically signif-
icant. Estimation with L
1
regularization required
considerably less time than estimation with L
2
, and
resulted in a model which is more than ten times
smaller.
4 Conclusions
We compared five of the most competitive para-
meter estimation methods on four NLP tasks em-
ploying a variety of models, and the results were
remarkably consistent across tasks. Three of the
methods — ME estimation with L
2
regularization,
ME estimation with L
1
regularization, and the Av-
eraged Perceptron — were nearly indistinguishable
in terms of test set accuracy, with ME estimation
with L
2
regularization perhaps enjoying a slight
lead. Meanwhile, ME estimation with L
1
regulari-
zation achieves the same level of performance while
at the same time producing sparse models, and the
Averaged Perceptron provides an excellent com-
promise of high performance and fast training.
These results suggest that when deciding which
type of parameter estimation to use on these or
similar NLP tasks, one may choose any of these
three popular methods and expect to achieve com-
parable performance. The choice of which to im-
plement should come down to other considerations:
if model sparsity is desired, choose ME estimation
with L
1
regularization (or feature selection methods
such as BLasso); if quick implementation and
training is necessary, use the Averaged Perceptron;
and ME estimation with L
2
regularization may be
used if it is important to achieve the highest ob-
tainable level of performance.
References
Andrew, G. 2006. A hybrid Markov/semi-Markov condi-
tional random field for sequence segmentation. In EMNLP,
465-472.
Andrew, G. and Gao, J. 2007. Scalable training of
L
1
-regularized log-linear models. In ICML.
Charniak, E. 2000. A maximum-entropy-inspired parser. In
NAACL, 132-139.
Charniak, E. and Johnson, M. 2005. Coarse-to-fine n-best
parsing and MaxEnt discriminative re-ranking. In ACL.
173-180.
Chen, S.F., and Rosenfeld, R. 2000. A survey of smoothing
techniques for ME models. IEEE Trans. On Speech and Audio
Processing, 8(2): 37-50.
Collins, M. 2000. Discriminative re-ranking for natural
language parsing. In ICML, 175-182.
Collins, M. 2002. Discriminative training methods for hid-
den Markov models: Theory and experiments with per-
ceptron algorithms. In EMNLP, 1-8.
Freund, Y, R. Iyer, R. E. Schapire, and Y. Singer. 1998. An
efficient boosting algorithm for combining preferences. In
ICML’98.
Freund, Y. and Schapire, R. E. 1999. Large margin classifica-
tion using the perceptron algorithm. In Machine Learning,
37(3): 277-296.
Hastie, T., R. Tibshirani and J. Friedman. 2001. The elements of
statistical learning. Springer-Verlag, New York.
Gao, J., Suzuki, H., and Yu, B. 2006. Approximation lasso
methods for language modeling. In ACL.
Goodman, J. 2004. Exponential priors for maximum entropy
models. In NAACL.
Johnson, M., Geman, S., Canon, S., Chi, Z., and Riezler, S.
1999. Estimators for stochastic “Unification-based”
grammars. In ACL.
Kazama, J. and Tsujii, J. 2003. Evaluation and extension of
maximum entropy models with inequality constraints. In
EMNLP.
Malouf, R. 2002. A comparison of algorithms for maximum
entropy parameter estimation. In HLT.
McCallum A, D. Freitag and F. Pereira. 2000. Maximum
entropy markov models for information extraction and
segmentation. In ICML.
Mitchell, T. M. 1997. Machine learning. The McGraw-Hill
Companies, Inc.
Ng, A. Y. 2004. Feature selection, L
1
vs. L
2
regularization,
and rotational invariance. In ICML.
Nocedal, J., and Wright, S. J. 1999. Numerical Optimization.
Springer, New York.
Punyakanok, V., D. Roth, W. Yih, and D. Zimak. 2005.
Learning and inference over constrained output. In IJCAI.
Ratnaparkhi, A. 1996. A maximum entropy part-of-speech
tagger. In EMNLP.
Riezler, S., and Vasserman, A. 2004. Incremental feature
selection and L
1
regularization for relax maximum entro-
py modeling. In EMNLP.
Riezler, S., King, T. H., Kaplan, R. M., Crouch, R., Maxwell, J.,
and Johnson, M. 2002. Parsing the wall street journal using
a lexical-functional grammar and discriminative estima-
tion techniques. In ACL. 271-278.
Tibshirani, R. 1996. Regression shrinkage and selection via
the lasso. J. R. Statist. Soc. B, 58(1): 267-288.
Toutanova, K., Klein, D., Manning, C. D., and Singer, Y.
2003. Feature-rich Part-of-Speech tagging with a cyclic
dependency network. In HLT-NAACL, 252-259.
Zhao, P. and B. Yu. 2004. Boosted lasso. Tech Report, Statistics
Department, U. C. Berkeley.
Accuracy (%)
# features
# train iter
MEMM/L2
96.39
926,350
467
MEMM/L1
96.41
84,070
85
Table 6. Performance summary of estimators on
POS tagging
831