Báo cáo khoa học: "An Extensive Empirical Study of Collocation Extraction Methods" ppt
Bạn đang xem bản rút gọn của tài liệu. Xem và tải ngay bản đầy đủ của tài liệu tại đây (431.83 KB, 6 trang )
Proceedings of the ACL Student Research Workshop, pages 13–18,
Ann Arbor, Michigan, June 2005.
c
2005 Association for Computational Linguistics
An Extensive Empirical Study of Collocation Extraction Methods
Pavel Pecina
Institute of Formal and Applied Linguistics
Charles University, Prague, Czech Republic
Abstract
This paper presents a status quo of an
ongoing research study of collocations –
an essential linguistic phenomenon hav-
ing a wide spectrum of applications in
the field of natural language processing.
The core of the work is an empirical eval-
uation of a comprehensive list of auto-
matic collocation extraction methods us-
ing precision-recall measures and a pro-
posal of a new approach integrating mul-
tiple basic methods and statistical classi-
fication. We demonstrate that combining
multiple independent techniques leads to
a significant performance improvement in
comparisonwith individualbasic methods.
1 Introduction and motivation
Natural language cannot be simply reduced to lex-
icon and syntax. The fact that individual words
cannot be combined freely or randomly is common
for most natural languages. The ability of a word
to combine with other words can be expressed ei-
ther intensionally or extensionally. The former case
refers to valency. Instances of the latter case are
called collocations (
ˇ
Cermák and Holub, 1982). The
term collocation has several other definitions but
none of them is widely accepted. Most attempts
are based on a characteristic property of colloca-
tions: non-compositionality. Choueka (1988) de-
fines a collocational expression as “a syntactic and
semantic unit whose exact and unambiguous mean-
ing or connotation cannot be derived directly from
the meaning or connotation of its components”.
The term collocation has both linguistic and lexi-
cographic character. It covers a wide range of lexical
phenomena, such as phrasal verbs, light verb com-
pounds, idioms, stock phrases, technological ex-
pressions, and proper names. Collocations are of
high importance for many applications in the field
of NLP. The most desirable ones are machine trans-
lation, word sense disambiguation, language genera-
tion, and information retrieval. The recent availabil-
ity of large amounts of textual data has attracted in-
terest in automatic collocation extraction from text.
In the last thirty years a number of different methods
employing various association measures have been
proposed. Overview of the most widely used tech-
niques is given e.g. in (Manning and Schütze, 1999)
or (Pearce, 2002). Several researches also attempted
to compare existing methods and suggested different
evaluation schemes, e.g Kita (1994) or Evert (2001).
A comprehensive study of statistical aspects of word
cooccurrences can be found in (Evert, 2004).
In this paper we present a compendium of 84
methods for automatic collocation extraction. They
came from different research areas and some of them
have not been used for this purpose yet. A brief
overview of these methods is followed by their com-
parative evaluation against manually annotated data
by the means of precision and recall measures. In
the end we propose a statistical classification method
for combining multiple methods and demonstrate a
substantial performance improvement.
In our research we focus on two-word (bigram)
collocations, mainly for the reason that experiments
with longer expressions would require processing of
much larger amounts of data and limited scalability
of some methods to high order n-grams. The exper-
iments are performed on Czech data.
13
2 Collocation extraction
Most methods for collocation extraction are based
on verification of typical collocation properties.
These properties are formally described by mathe-
matical formulas that determine the degree of as-
sociation between components of collocation. Such
formulas are called association measures and com-
pute an association score for each collocation candi-
date extracted from a corpus. The scores indicate a
chance of a candidate to be a collocation. They can
be used for ranking or for classification – by setting
a threshold. Finding such a threshold depends on the
intended application.
The most widely tested property of collocations is
non-compositionality: If words occur together more
often than by a chance, then this is the evidence that
they have a special function that is not simply ex-
plained as a result of their combination (Manning
and Schütze, 1999). We think of a corpus as a ran-
domly generated sequence of words that is viewed as
a sequence of word pairs. Occurrence frequencies
of these bigrams are extracted and kept in contin-
gency tables (Table1a). Values from these tables are
used in several association measures that reflect how
much the word coocurrence is accidental. A list of
such measures is given in Table 2 and includes: es-
timation of bigram and unigram probabilities (rows
3–5), mutual information and derived measures (6–
11), statistical tests of independence (12–16), likeli-
hood measures (17–18), and various other heuristic
association measures and coefficients (19–57).
Another frequently tested property is taken di-
rectly from the definition that a collocation is a syn-
tactic andsemanticunit. For each bigram occurring
in the corpus, information of its empiricalcontext
(frequencies of open-class words occurring within
a specified context window) and left and right im-
mediate contexts (frequencies of words immediately
preceding or following the bigram) is extracted (Ta-
ble 1b). By determining the entropy of the im-
mediate contexts of a word sequence, the associa-
tion measures rank collocations according to the as-
sumption that they occur as units in a (information-
theoretically) noisy environment (Shimohata et al.,
1997) (58–62). By comparing empirical contexts of
a word sequence and its components, the associa-
tion measures rank collocations according to the as-
a)
a =f(xy) b =f (x¯y ) f (x∗)
c =f(¯xy) d =f(¯x¯y) f(¯x∗)
f(∗y) f(∗¯y) N
b)
C
w
empirical context of w
C
xy
empirical context of xy
C
l
xy
left immediate context of xy
C
r
xy
right immediate context of xy
Table 1: a) A contingency table with observed frequencies and
marginal frequencies for a bigram xy; ¯w stands for any word
except w; ∗ stands for any word; N is a total number of bi-
grams. The table cells are sometimes referred as f
ij
. Statistical
tests of independence work with contingency tables of expected
frequencies
ˆ
f(xy)=f(x∗)f(∗y)/N . b) Different notions of em-
pirical contexts.
sumption that semantically non-compositional ex-
pressions typically occur in different contexts than
their components (Zhai, 1997). Measures (63–76)
have information theory background and measures
(77–84) are adopted from the field of information
retrieval. Context association measures are mainly
used for extracting idioms.
Besides all the association measures described
above, we also take into account other recommended
measures (1–2) (Manning and Schütze, 1999) and
some basic linguistic characteristics used for filter-
ing non-collocations (85–87). This information can
be obtained automatically from morphological tag-
gers and syntactic parsers available with reasonably
high accuracy for many languages.
3 Empirical evaluation
Evaluation of collocation extraction methods is a
complicated task. On one hand, different applica-
tions require different setting of association score
thresholds. On the other hand, methods give differ-
ent results within different ranges of their associa-
tion scores. We need a complex evaluation scheme
covering all demands. In such a case, Evert (2001)
and other authors suggest using precision and recall
measures on a full reference data or on n-best lists.
Data. All the presented experiments were per-
formed on morphologically and syntactically anno-
tated Czech text from the Prague Dependency Tree-
bank (PDT) (Haji
ˇ
c et al., 2001). Dependency trees
were broken down into dependency bigrams consist-
ing of: lemmas and part-of-speech of the compo-
nents, and type of dependence between the compo-
nents.
For each bigram type we counted frequencies in
its contingency table, extracted empirical and imme-
diate contexts, and computed all the 84 association
measures from Table2. We processed 81 614 sen-
14
# Name Formula
1. Mean component offset
1
n
P
n
i=1
d
i
2. Variance component offset
1
n−1
P
n
i=1
`
d
i
−
¯
d
´
2
3. Joint probability P (xy)
4. Conditional probability P (y|x)
5. Reverse conditional prob. P (x|y)
6. Pointwise mutual inform. log
P (xy)
P (x∗)P (∗y)
7. Mutual dependency (MD) log
P (xy)
2
P (x∗)P (∗y)
8. Log frequency biased MD log
P (xy)
2
P (x∗)P (∗y)
+log P (xy)
9. Normalized expectation
2f(xy)
f(x∗)+f(∗y)
10. Mutual expectation
2f(xy)
f(x∗)+f(∗y)
·P (xy)
11. Salience log
P (xy)
2
P (x∗)P (∗y)
· logf (xy)
12. Pearson’s χ
2
test
P
i,j
(f
ij
−
ˆ
f
ij
)
2
ˆ
f
ij
13. Fisher’s exact test
f(x∗)!f(¯x∗)!f(∗y)!f (∗¯y)!
N!f(xy)!f (x¯y)!f (¯xy)!f (¯x ¯y)!
14. t test
f(xy)−
ˆ
f(xy)
√
f(xy)(1−(f (xy)/N ))
15. z score
f(xy)−
ˆ
f(xy)
√
ˆ
f(xy)(1−(
ˆ
f(xy)/N))
16. Poison significance measure
ˆ
f(xy)−f (xy) log
ˆ
f(xy)+logf (xy)!
logN
17. Log likelihood ratio −2
P
i,j
f
ij
log
f
ij
ˆ
f
ij
18. Squared log likelihood ratio −2
P
i,j
logf
ij
2
ˆ
f
ij
Association coefficients:
19. Russel-Rao
a
a+b+c+d
20. Sokal-Michiner
a+d
a+b+c+d
21. Rogers-Tanimoto
a+d
a+2b+2c+d
22. Hamann
(a+d)−(b+c)
a+b+c+d
23. Third Sokal-Sneath
b+c
a+d
24. Jaccard
a
a+b+c
25. First Kulczynsky
a
b+c
26. Second Sokal-Sneath
a
a+2(b+c)
27. Second Kulczynski
1
2
(
a
a+b
+
a
a+c
)
28. Fourth Sokal-Sneath
1
4
(
a
a+b
+
a
a+c
+
d
d+b
+
d
d+c
)
29. Odds ratio
ad
bc
30. Yulle’s ω
√
ad−
√
bc
√
ad+
√
bc
31. Yulle’s Q
ad−bc
ad+bc
32. Driver-Kroeber
a
√
(a+b)(a+c)
33. Fifth Sokal-Sneath
ad
√
(a+b)(a+c)(d+b)(d+c)
34. Pearson
ad−bc
√
(a+b)(a+c)(d+b)(d+c)
35. Baroni-Urbani
a+
√
ad
a+b+c+
√
ad
36. Braun-Blanquet
a
max(a+b,a+c)
37. Simpson
a
min(a+b,a+c)
38. Michael
4(ad−bc)
(a+d)
2
+(b+c)
2
39. Mountford
2a
2bc+ab+ac
40. Fager
a
√
(a+b)(a+c)
−
1
2
max(b, c)
41. Unigram subtuples log
ad
bc
−3.29
q
1
a
+
1
b
+
1
c
+
1
d
42. U cost log(1+
min(b,c)+a
max(b,c)+a
)
43. S cost log(1+
min(b,c)
a+1
)
−
1
2
44. R cost log(1+
a
a+b
)·log(1+
a
a+c
)
45. T combined cost
√
U ×S×R
46. Phi
P (xy)−P (x∗)P (∗y)
√
P (x∗)P (∗y)(1−P (x∗))(1−P (∗y))
47. Kappa
P (xy)+P (¯x¯y)−P (x∗)P(∗y)−P (¯x∗)P (∗¯y)
1−P (x∗)P (∗y)−P ( ¯x∗)P (∗¯y)
48. J measure max[P (xy)log
P (y|x)
P (∗y)
+P (x¯y)log
P (¯y|x)
P (∗¯y)
,
P (xy)log
P (x|y)
P (x∗)
+P (¯xy)log
P (¯x|y)
P (¯x∗)
]
# Name Formula
49. Gini index max[P (x∗)(P (y|x)
2
+P (¯y|x)
2
)−P (∗y)
2
+P (
¯
x∗)(P (y|¯x)
2
+P (¯y|¯x)
2
)−P (∗¯y)
2
,
P (∗y)(P (x|y)
2
+P (¯x|y)
2
)−P (x∗)
2
+P (∗¯y)(P (x|¯y)
2
+P (¯x|¯y)
2
)−P (¯x∗)
2
]
50. Confidence max[P (y|x), P (x|y)]
51. Laplace max[
NP (xy)+1
NP (x∗)+2
,
NP (xy)+1
NP (∗y)+2
]
52. Conviction max[
P (x∗)P (∗y)
P (x ¯y)
,
P (¯x∗)P (∗y)
P (¯xy)
]
53. Piatersky-Shapiro P (xy)−P (x∗)P (∗y)
54. Certainity factor max[
P (y|x)−P (∗y)
1−P (∗y)
,
P (x|y)−P (x∗)
1−P (x∗)
]
55. Added value (AV) max[P (y|x)−P (∗y), P(x|y)−P(x∗)]
56. Collective strength
P (xy)+P (¯x¯y)
P (x∗)P (y)+P (¯x∗)P (∗y)
·
1−P (x∗)P (∗y)−P (¯x∗)P (∗y)
1−P (xy)−P (¯x¯y)
57. Klosgen
p
P (xy) ·AV
Context measures:
58. Context entropy −
P
w
P (w|C
xy
) logP (w|C
xy
)
59. Left context entropy −
P
w
P (w|C
l
xy
) logP (w|C
l
xy
)
60. Right context entropy
−
P
w
P (w|C
r
xy
) logP (w|C
r
xy
)
61. Left context divergence P (x∗) logP (x∗)
−
P
w
P (w|C
l
xy
) logP (w|C
l
xy
)
62. Right context divergence P (∗y) logP (∗y)
−
P
w
P (w|C
r
xy
) logP (w|C
r
xy
)
63. Cross entropy −
P
w
P (w|C
x
) log P (w|C
y
)
64. Reverse cross entropy −
P
w
P (w|C
y
) log P (w|C
x
)
65. Intersection measure
2|C
x
∩C
y
|
|C
x
|+|C
y
|
66. Euclidean norm
q
P
w
(P (w|C
x
)−P (w|C
y
))
2
67. Cosine norm
P
w
P (w|C
x
)P (w|C
y
)
P
w
P (w|C
x
)
2
·
P
w
P (w|C
y
)
2
68. L1 norm
P
w
|P (w|C
x
)−P (w|C
y
)|
69. Confusion probability
P
w
P (x|C
w
)P (y|C
w
)P (w)
P (x∗)
70. Reverse confusion prob.
P
w
P (y|C
w
)P (x|C
w
)P (w)
P (∗y)
71. Jensen-Shannon diverg.
1
2
[D(p(w|C
x
)||
1
2
(p(w|C
x
)+p(w|C
y
)))
+D(p(w|C
y
)||
1
2
(p(w|C
x
)+p(w|C
y
)))]
72. Cosine of pointwise MI
P
w
MI(w,x)M I(w,y)
√
P
w
MI(w,x)
2
·
√
P
w
MI(w,y)
2
73. KL divergence
P
w
P (w|C
x
) log
P (w|C
x
)
P (w|C
y
)
74. Reverse KL divergence
P
w
P (w|C
y
) log
P (w|C
y
)
P (w|C
x
)
75. Skew divergence D(p(w|C
x
)||α(w|C
y
)+(1−α)p(w|C
x
))
76. Reverse skew divergence D(p(w|C
y
)||αp(w|C
x
)+(1−α)p(w|C
y
))
77. Phrase word coocurrence
1
2
(
f(x|C
xy
)
f(xy)
+
f(y|C
xy
)
f(xy)
)
78. Word association
1
2
(
f(x|C
y
)−f(xy)
f(xy)
+
f(y|C
x
)−f(xy)
f(xy)
)
Cosine context similarity:
1
2
(cos(c
x
,c
xy
)+cos(c
y
,c
xy
))
c
z
= (z
i
); cos(c
x
,c
y
) =
P
x
i
y
i
√
P
x
i
2
·
√
P
y
i
2
79. in boolean vector space z
i
= δ(f(w
i
|C
z
))
80. in tf vector space z
i
= f (w
i
|C
z
)
81. in tf·idf vector space z
i
= f (w
i
|C
z
)·
N
df(w
i
)
; df(w
i
)= |{x: w
i
C
x
}|
Dice context similarity:
1
2
(dice(c
x
,c
xy
)+dice(c
y
,c
xy
))
c
z
= (z
i
); dice(c
x
,c
y
) =
2
P
x
i
y
i
P
x
i
2
+
P
y
i
2
82. in boolean vector space z
i
= δ(f(w
i
|C
z
))
83. in tf vector space z
i
= f (w
i
|C
z
)
84. in tf·idf vector space z
i
= f (w
i
|C
z
)·
N
df(w
i
)
; df(w
i
)= |{x: w
i
C
x
}|
Linguistic features:
85. Part of speech {Adjective:Noun, Noun:Noun, Noun:Verb, . }
86. Dependency type {Attribute, Object, Subject, . }
87. Dependency structure {, }
Table 2: Association measures and linguistic features used in bigram collocation extraction methods. denotes those selected by
the attribute selection method discussed in Section 4. References can be found at the end of the paper.
15
tences with 1 255 590 words and obtained a total of
202 171 different dependency bigrams.
Krenn (2000) argues that collocation extraction
methods should be evaluated against a reference set
of collocations manually extracted from the full can-
didate data from a corpus. However, we reduced the
full candidate data from PDT to 21597 bigram by
filtering out any bigrams which occurred 5 or less
times in the data and thus we obtained a reference
data set which fulfills requirements of a sufficient
size and a minimal frequency of observations which
is needed for the assumption of normal distribution
required by some methods.
We manually processed the entire reference data
set and extracted bigrams that were considered to be
collocations. At this point we applied part-of-speech
filtering: First, we identified POSpatterns that never
form a collocation. Second, all dependency bigrams
having such a POS pattern were removed from the
reference data and a final reference set of 8 904 bi-
grams was created. We no longer consider bigrams
with such patterns to be collocation candidates.
This data set contained 2 649 items considered to
be collocations. The a priori probability of a bi-
gram to be a collocation was 29.75 %. A strati-
fied one-third subsample of this data was selected
as test data and used for evaluation and testing pur-
poses in this work. The rest was taken apart and used
as training data in later experiments.
Evaluation metrics. Since we manually anno-
tated the entire reference data set we could use the
suggested precision and recall measures (and their
harmonic mean F-measure). A collocation extrac-
tion method using any association measure with a
given threshold can be considered a classifier and
the measures can be computed in the following way:
P recision =
# correctly cl assified collocations
# total predicted as collocations
Recall =
# correctly cl assified collocations
# total collocations
The higher these scores, the better the classifier is.
By changing the threshold we can tune the clas-
sifier performance and “trade” recall for precision.
Therefore, collocation extraction methods can be
thoroughly compared by comparing their precision-
-recall curves: The closer the curve to the top right
corner, the better the method is.
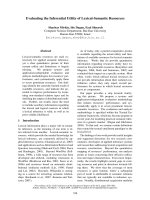
100
90
80
60
30
100806040200
Precision (%)
Recall (%)
baseline = 29.75 %
Pointwise mutual information
Pearson’s test
Mountford
Kappa
Left context divergence
Context intersection measure
Cosine context similarity in boolean VS
Figure 1: Precision-recall curves for selected assoc. measures.
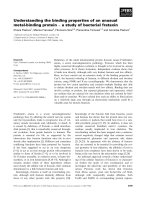
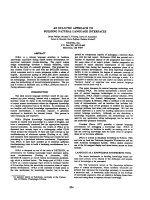
Results. Presenting individual results for all of
the 84 association measures is not possible in a paper
of this length. Therefore, we present precision-recall
graphs only for the best methods from each group
mentioned in Section2; see Figure 1. The baseline
system that classifies bigrams randomly, operates
with a precision of 29.75%. The overall best re-
sult was achieved by Pointwise mutual information:
30 % recall with 85.5% precision (F-measure 44.4),
60 % recall with 78.4% precision (F-measure 68.0),
and 90 % recall with 62.5 % precision (F-measure
73.8).
4 Statistical classification
In the previous section we mentioned that collo-
cation extraction is a classification problem. Each
method classifies instances of the candidate data set
according to the values of an association score. Now
we have several association scores for each candi-
date bigram and want to combine them together to
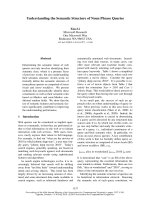
achieve better performance. A motivating example
is depicted in Figure 3: Association scores of Point-
wise mutual information and Cosine context simi-
larity are independent enough to be linearly com-
bined to provide better results. Considering all as-
sociation measures, we deal with a problem of high-
dimensional classification into two classes.
In our case, each bigram x is described by the
attributevector x = (x
1
, . . . , x
87
) consisting of lin-
guistic features and association scores from Table2.
Now we look for a function assigning each bigram
one class : f (x) →{collocation, non-collocation}.
The result of this approach is similar to setting a
threshold of the association score in methods us-
16
0.9
0.5
0.1
16.98.80.7
Cosine context similarity in boolean vector space
Pointwise mutual information
collocations
non-collocations
linear discriminant
Figure 2: Data visualization in two dimensions. The dashed line
denotes a linear discriminant obtained by logistic linear regres-
sion. By moving this boundary we can tune the classifier output
(a 5 % stratified sample of the test data is displayed).
ing one association measure, which is not very use-
full for our purpose. Some classification meth-
ods, however, output also the predicted probability
P (x is collocation) that can be considered a regular
association measure as described above. Thus, the
classification method can be also tuned by changing
a threshold of this probability and can be compared
with other methods by the same means of precision
and recall.
One of the basic classification methods that gives
a predicted probability is Logistic linearregression.
The model defines the predicted probability as:
P (x is collocation) =
exp
β
0
+β
1
x
1
+β
n
x
n
1 + exp
β
0
+β
1
x
1
+β
n
x
n
where the coefficients β
i
are obtained by the iter-
atively reweighted least squares (IRLS) algorithm
which solves the weighted least squares problem
at each iteration. Categorial attributes need to be
transformed to numeric dummy variables. It is also
recommended to normalize all numeric attributes to
have zero mean and unit variance.
We employed the datamining software Weka by
Witten and Frank (2000) in our experiments. As
training data we used a two-third subsample of the
reference data described above. The test data was
the same as in the evaluation of the basic methods.
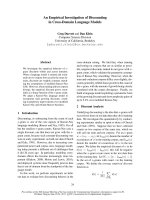
By combining all the 87 attributes, we achieved
the results displayed in Table3 and illustrated in Fig-
ure 3. At a recall level of 90 % the relative increase
in precision was 35.2 % and at a precision level of
90 % the relative increase in recall was impressive
242.3 %.
100
90
80
60
30
100806040200
Precision (%)
Recall (%)
baseline = 29.75 %
Logistic regression on all attributes
Logistic regression on 17 selected attributes
Figure 3: Precision-recall curves of two classifiers based on
i) logistic linear regression on the full set of 87 attributes and
ii) on the selected subset with 17 attributes. The thin unlabeled
curves refer to the methods from the 17 selected attributes
Attribute selection. In the final step of our exper-
iments, we attempted to reduce the attribute space of
our data and thus obtain an attribute subset with the
same prediction ability. We employed a greedy step-
wise search method with attribute subset evaluation
via logistic regression implemented in Weka. It per-
forms a greedy search through the space of attribute
subsets and iteratively merges subsets that give the
best results until the performance is no longer im-
proved.
We ended up with a subset consisting of the fol-
lowing 17 attributes: (6, 10, 21, 25, 31, 56, 58, 61, 71,
73, 74, 79, 82, 83, 84, 85, 86) which are also marked in
Table 2. The overview of achieved results is shown
in Table 3 and precision-recall graphs of the selected
attributes and their combinations are in Figure3.
5 Conclusions and future work
We implemented 84 automatic collocation extrac-
tion methods and performed series of experiments
on morphologically and syntactically annotated
data. The methods were evaluated against a refer-
ence set of collocations manually extracted from the
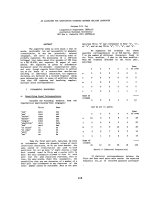
Recall Precision
30 60 90 70 80 90
P. mutual information 85.5 78.4 62.5 78.0 56.0 16.3
Logistic regression-17 92.6 89.5 84.5 96.7 86.7 55.8
Absolute improvement 7.1 11.1 22.0 17.7 30.7 39.2
Relative improvement 8.3 14.2 35.2 23.9 54.8 242.3
Table 3: Precision (the 3 left columns) and recall (the 3 right
columns) scores (in %) for the best individual method and linear
combination of the 17 selected ones.
17
same source. The best method (Pointwise mutual in-
formation) achieved 68.3 % recall with 73.0 % pre-
cision (F-measure 70.6) on this data. We proposed
to combine the association scores of each candidate
bigram and employed Logistic linear regression to
find a linear combination of the association scores
of all the basic methods. Thus we constructed a col-
location extraction method which achieved 80.8 %
recall with 84.8 % precision (F-measure 82.8). Fur-
thermore, we applied an attribute selection tech-
nique in order to lower the high dimensionality of
the classification problem and reduced the number
of regressors from 87 to 17 with comparable perfor-
mance. This result can be viewed as a kind of evalu-
ation of basic collocation extraction techniques. We
can obtain the smallest subset that still gives the best
result. The other measures therefore become unin-
teresting and need not be further processed and eval-
uated.
The reseach presented in this paper is in progress.
The list of collocation extraction methods and as-
sociation measures is far from complete. Our long
term goal is to collect, implement, and evaluate all
available methods suitable for this task, and release
the toolkit for public use.
In the future, we will focus especially on im-
proving quality of the training and testing data, em-
ploying other classification and attribute-selection
techniques, and performing experiments on English
data. A necessary part of the work will be a rigorous
theoretical study of all applied methods and appro-
priateness of their usage. Finally, we will attempt to
demonstrate contribution of collocations in selected
application areas, such as machine translation or in-
formation retrieval.
Acknowledgments
This research has been supported by the Ministry
of Education of the Czech Republic, project MSM
0021620838. I would also like to thank my advisor,
Dr. Jan Haji
ˇ
c, for his continued support.
References
Y. Choueka. 1988. Looking for needles in a haystack or lo-
cating interesting collocational expressions in large textual
databases. In Proceedings of the RIAO, pages 43–38.
I. Dagan, L. Lee, and F. Pereira. 1999. Similarity-based models
of word cooccurrence probabilities. Machine Learning, 34.
T. E. Dunning. 1993. Accurate methods for the statistics
of surprise and coincidence. Computational Linguistics,
19(1):61–74.
S. Evert and B. Krenn. 2001. Methods for the qualitative eval-
uation of lexical association measures. In Proceedings 39th
Annual Meeting of the Association for Computational Lin-
guistics, pages 188–195.
S. Evert. 2004. The Statistics of Word Cooccurrences: Word
Pairs and Collocations. Ph.D. thesis, University of Stuttgart.
J. Haji
ˇ
c, E. Haji
ˇ
cová, P. Pajas, J. Panevová, P. Sgall, and
B. Vidová-Hladká. 2001. Prague dependency treebank 1.0.
Published by LDC, University of Pennsylvania.
K. Kita, Y. Kato, T. Omoto, and Y. Yano. 1994. A comparative
study of automatic extraction of collocations from corpora:
Mutual information vs. cost criteria. Journal of Natural Lan-
guage Processing, 1(1):21–33.
B. Krenn. 2000. Collocation Mining: Exploiting Corpora for
Collocation Idenfication and Representation. In Proceedings
of KONVENS 2000.
L. Lee. 2001. On the effectiveness of the skew divergence
for statistical language analysis. Artificial Inteligence and
Statistics, pages 65–72.
C. D. Manning and H. Schütze. 1999. Foundations of Statis-
tical Natural Language Processing. The MIT Press, Cam-
bridge, Massachusetts.
D. Pearce. 2002. A comparative evaluation of collocation ex-
traction techniques. In Third International Conference on
language Resources and Evaluation, Las Palmas, Spain.
T. Pedersen. 1996. Fishing for exactness. In Proceedings of
the South Central SAS User’s Group Conference, pages 188–
200, Austin, TX.
S. Shimohata, T. Sugio, and J. Nagata. 1997. Retrieving col-
locations by co-occurrences and word order constraints. In
Proc. of the 35th Annual Meeting of the ACL and 8th Con-
ference of the EACL, pages 476–81, Madrid. Spain.
P. Tan, V. Kumar, and J. Srivastava. 2002. Selecting the right
interestingness measure for association patterns. In Proceed-
ings of the Eight A CM SIGKDD International Conference
on Knowledge Discovery and Data Mining.
A. Thanopoulos, N. Fakotakis, and G. Kokkinakis. 2002. Com-
parative evaluation of collocation extraction metrics. In 3rd
International Conference on Language Resources and Eval-
uation, volume 2, pages 620–625, Las Palmas, Spain.
F.
ˇ
Cermák and J. Holub. 1982. Syntagmatika a paradigmatika
ˇcesk eho slova: Valence a kolokabilita. Státní pedagogické
nakladatelství, Praha.
I. H. Witten and E. Frank. 2000. Data Mining: Practical
machine learning tools with Java implementations. Morgan
Kaufmann, San Francisco.
C. Zhai. 1997. Exploiting context to identify lexical atoms
– A statistical view of linguistic context. In International
and Interdisciplinary Conference on Modelling and Using
Context (CONTEXT-97).
18