Changes in the Economic Value of Variable Generation at High Penetration Levels: A Pilot Case Study of California pot
Bạn đang xem bản rút gọn của tài liệu. Xem và tải ngay bản đầy đủ của tài liệu tại đây (1.14 MB, 114 trang )
LBNL-5445E
Changes in the Economic Value of
Variable Generation at High
Penetration Levels: A Pilot Case
Study of California
Andrew Mills and Ryan Wiser
Environmental Energy
Technologies Division
June 2012
Download from
The work described in this paper was funded by the U.S. Department of Energy (Office
of Energy Efficiency and Renewable Energy and Office of Electricity Delivery and
Energy Reliability) under Contract No. DE-AC02-05CH11231.
ERNEST ORLANDO LAWRENCE
B
ERKELEY NATIONAL LABORATORY
Disclaimer
This document was prepared as an account of work sponsored by the United States Government. While
this document is believed to contain correct information, neither the United States Government nor any
agency thereof, nor The Regents of the University of California, nor any of their employees, makes any
warranty, express or implied, or assumes any legal responsibility for the accuracy, completeness, or usefulness
of any information, apparatus, product, or process disclosed, or represents that its use would not infringe
privately owned rights. Reference herein to any specific commercial product, process, or service by its trade
name, trademark, manufacturer, or otherwise, does not necessarily constitute or imply its endorsement,
recommendation, or favoring by the United States Government or any agency thereof, or The Regents of
the University of California. The views and opinions of authors expressed herein do not necessarily state or
reflect those of the United States Government or any agency thereof, or The Regents of the University of
California. Ernest Orlando Lawrence Berkeley National Laboratory is an equal opportunity employer.
LBNL-5445E
Changes in the Economic Value of Variable Generation
at High Penetration Levels: A Pilot Case Study of
California
Prepared for the
Office of Electricity Delivery and Energy Reliability
Research & Development Division and
Permitting, Siting and Analysis Division
U.S. Department of Energy
Washington, D.C.
and the
Office of Energy Efficiency and Renewable Energy
Wind and Hydropower Technologies Program and
Solar Energy Technologies Program
U.S. Department of Energy
Washington, D.C.
Principal Authors:
Andrew Mills and Ryan Wiser
Ernest Orlando Lawrence Berkeley National Laboratory
1 Cyclotron Road, MS 90R4000
Berkeley CA 94720-8136
June 2012
The work described in this report was funded by the Office of Electricity Delivery and Energy Reliability
(Research & Development Division and Permitting, Siting and Analysis Division) and by the Office of
Energy Efficiency and Renewable Energy (Wind and Hydropower Technologies Program and Solar Energy
Technologies Program) of the U.S. Department of Energy under Contract No. DE-AC02-05CH11231.
Acknowledgments
The work described in this paper was funded by the Office of Electricity Delivery and Energy Reliabil-
ity (Research & Development Division and Permitting, Siting and Analysis Division) and by the Office of
Energy Efficiency and Renewable Energy (Wind and Hydropower Technologies Program and Solar Energy
Technologies Program) of the U.S. Department of Energy under Contract No. DE-AC02-05CH11231. We
would particularly like to thank Lawrence Mansueti, Patrick Gilman, and Kevin Lynn of the U.S. Depart-
ment of Energy for their support of this work. For reviewing drafts of this report and/or for providing
comments that helped shape our early thinking on this project Antonio Alvarez (Pacific Gas & Electric),
Sam Baldwin (Department of Energy), Venkat Banunarayanan (DOE), Galen Barbose (Berkeley Lab), Mark
Bolinger (Berkeley Lab), Severin Borenstein (University of California at Berkeley), Audun Botterud (Argonne
National Laboratory), Duncan Callaway (UC Berkeley), Na¨ım Darghouth (Berkeley Lab), Paul Denholm
(National Renewable Energy Laboratory), Joe Eto (Berkeley Lab), Michael Goggin (American Wind Energy
Association), Richard Green (Imperial College), Udi Helman (Brightsource), Daniel Kammen (UC Berkeley),
Alan Lamont (Lawrence Livermore National Laboratory), Debbie Lew (NREL), Seungwook Ma (DOE), Trieu
Mai (NREL), Michael Milligan (NREL), Marco Nicolosi (Ecofys), Arne Olson (Energy and Environmental
Economics), Shmuel Oren (UC Berkeley), Anthony Papavasiliou (UC Berkeley), Ranga Pitchumani (DOE),
J. Charles Smith (Utility Variable Generation Integration Group), Steven Stoft (Independent Consultant),
and Patrick Sullivan (NREL). Of course, any remaining omissions or inaccuracies are our own.
Abstract
We estimate the long-run economic value of variable renewable generation with increasing penetration
using a unique investment and dispatch model that captures long-run investment decisions while also incor-
porating detailed operational constraints and hourly time resolution over a full year. High time resolution
and the incorporation of operational constraints are important for estimating the economic value of variable
generation, as is the use of a modeling framework that accommodates new investment decisions. The model
is herein applied with a case study that is loosely based on California in 2030. Increasing amounts of wind,
photovoltaics (PV), and concentrating solar power (CSP) with and without thermal energy storage (TES)
are added one at a time. The marginal economic value of these renewable energy sources is estimated and
then decomposed into capacity value, energy value, day-ahead forecast error cost, and ancillary services.
The marginal economic value, as defined here, is primarily based on the combination of avoided capital
investment cost and avoided variable fuel and operations and maintenance costs from other power plants
in the power system. Though the model only captures a subset of the benefits and costs of renewable en-
ergy, it nonetheless provides unique insights into how the value of that subset changes with technology and
penetration level.
Specifically, in this case study implementation of the model, the marginal economic value of all three solar
options is found to exceed the value of a flat-block of power (as well as wind energy) by $20–30/MWh at
low penetration levels, largely due to the high capacity value of solar at low penetration. Because the value
of CSP per unit of energy is found to be high with or without thermal energy storage at low penetration,
we find little apparent incremental value to thermal storage at low solar penetration in the present case
study analysis. The marginal economic value of PV and CSP without thermal storage is found to drop
considerably (by more than $70/MWh) as the penetration of solar increases toward 30% on an energy basis.
This is due primarily to a steep drop in capacity value followed by a decrease in energy value. In contrast,
the value of CSP with thermal storage drops much less dramatically as penetration increases. As a result,
at solar penetration levels above 10%, CSP with thermal storage is found to be considerably more valuable
relative to PV and CSP without thermal storage. The marginal economic value of wind is found to be
largely driven by energy value, and is lower than solar at low penetration. The marginal economic value
of wind drops at a relatively slower rate with penetration, however. As a result, at high penetration, the
value of wind can exceed the value of PV and CSP without thermal storage. Though some of these findings
may be somewhat unique to the specific case study presented here, the results: (1) highlight the importance
of an analysis framework that addresses long-term investment decisions as well as short-term dispatch and
operational constraints, (2) can help inform long-term decisions about renewable energy procurement and
supporting infrastructure, and (3) point to areas where further research is warranted.
Executive Summary
Overview
The variable and unpredictable nature of some renewable resources, particularly wind and solar, leads to
challenges in making resource procurement and investment decisions. Comparisons of generating technologies
are incomplete when simply based on the relative generating cost of those technologies (i.e., comparisons
based on levelized cost of energy (LCOE)). A missing part of simple cost comparisons is an evaluation of
the economic value, or “avoided costs”, of energy generated by different generating technologies. To better
understand the economic value of wind and solar and how it changes with increasing penetration, this report
uses a unique modeling framework to examine a subset of the economic benefits from adding wind, single-axis
tracking photovoltaics (PV), and concentrating solar power (CSP) with and without six hours of thermal
energy storage (CSP
6
and CSP
0
, respectively). These variable renewable generation (VG) technologies are
added one at a time, leaving examination of the benefits of adding combinations of VG technologies to a
future report. In addition to the VG technologies, a case where the penetration of a flat block of power that
delivers a constant amount of electricity on a 24 × 7 basis is increased in a manner similar to the VG cases
for comparison purposes.
The subset of the benefits of variable renewable generation examined in this report is termed the marginal
economic value of those resources. Benefits are primarily based on avoiding costs for other non-renewable
power plants in the power system including capital investment cost, variable fuel, and variable operations
and maintenance (O&M). These avoided costs are calculated while accounting for operational constraints on
conventional generators and the increased need for ancillary services when adding variable renewable gener-
ation. Furthermore, the economic value reported here is the marginal economic value based on the change
in benefits for a small change in the amount of variable renewable generation at a particular penetration
level (as opposed to the average economic value of all variable renewables up to that penetration level).
Transmission constraints, on the other hand, are not considered in this analysis, nor many other costs and
impacts that may be important. The costs and impacts that are not considered in this analysis include
monetary estimates of environmental impacts, transmission and distribution costs or benefits, effects related
to the lumpiness and irreversibility of investment decisions, and uncertainty in future fuel and investment
capital costs. The analysis also does not consider the capital cost of variable renewable generation, instead
focusing on the economic value of that generation and how it changes with increasing penetration: a full
comparison among generation technologies would, of course, also account for their relative cost.
Notwithstanding these caveats, understanding the economic value of variable generation—even as nar-
rowly defined here—is an important element in making long-term decisions about renewable procurement
and supporting infrastructure.
Approach
This report uses a long-run economic framework to evaluate the economic value of variable generation
that accounts for changes in the mix of generation resources due to new generation investments and plant
retirements for both technical reasons (i.e., when generators reach the end of an assumed technical service
life) or for economic reasons (i.e., when generation is not profitable enough to cover its on-going fixed O&M
costs). Variable renewable generation (VG) is added to the power system at various penetration levels and
a new long-run equilibrium is found in the rest of the system for that given penetration of VG. The new
investment options include natural gas combined cycle (CCGTs) and combustion turbine plants (CTs), as
well as coal, nuclear, and pumped hydro storage (PHS). The investment framework is based largely on the
idea that new investments in conventional generation will occur up to the point that the short-run profits of
that new generation (revenues less variable costs) are equal to the fixed investment and fixed O&M cost of
that generation.
A unique aspect of the long-run model used in this report is that it incorporates significant detail impor-
tant to power system operations and dispatch with variable generation, including hourly generation and load
profiles, unpredictability of variable generation, ancillary service requirements, and some of the important
3
limitations of conventional thermal generators including part-load inefficiencies, minimum generation limits,
ramp-rate limits, and start-up costs. As is explained in the main report, the operational detail is simplified
through committing and dispatching vintages of generation as a fleet rather than dispatching individual
generation plants. The investment decisions are similarly simplified by assuming that investments can occur
in continuous amounts rather than discrete individual generation plants.
Case Study
This long-run model is applied to a case study that loosely matches characteristics of California in terms of
generation profiles for variable generation, existing generation capacity, and the hourly load profile in 2030.
Thermal generation parameters and constraints (e.g., variable O&M costs, the cost of fuel consumed just to
have the plant online, the marginal variable fuel cost associated with producing energy, start-up costs, limits
on how much generation can ramp from one hour to the next, and minimum generation limits of generation
that is online) are largely derived from observed operational characteristics of thermal generation in the
Western Electricity Coordinating Council (WECC) region, averaged over generators within the same vintage.
Aside from fossil-fuel fired generation, the existing generation modeled in California includes geothermal,
hydropower, and pumped hydro storage. Fossil-fuel prices are based on the fuel prices in 2030 in the EIA’s
Annual Energy Outlook 2011 reference case forecast.
In each of the scenarios considered in this analysis, one VG technology is increased from a base case
with essentially no VG (the 0% case) to increasingly high penetration levels measured on an energy basis.
The amount of VG included in each case is defined by the scenario and is not a result of an economic
optimization. The scenarios are set up in this way to observe how the marginal economic value of VG
changes with increasing penetration across a wide range of penetration levels.
Aside from the reference scenario, four sensitivity scenarios are evaluated to show the relative importance
of: major fossil plant operational constraints; monetary valuation of the cost of emitting carbon dioxide;
reductions in the cost of resources that provide capacity (i.e., combustion turbines); and assumptions about
the retirement of existing thermal generation.
Results and Conclusions
Application of the framework to a case study of California results in investments in new CCGTs in addition
to the incumbent generation and, at least in the reference scenario, no retirement of incumbent generation
for economic reasons (generation that is older than its technical life is automatically assumed to retire and is
not included in the incumbent generation). Since the system is always assumed to be in long-run equilibrium,
the wholesale power prices in the market are such that the short-run profit of the new CCGTs is always
sufficient to cover its fixed cost of investment at any VG penetration level. One impact of adding VG is
to reduce the amount of new CCGTs that need to be built, though the amount avoided varies across VG
technologies and VG penetration levels. New CTs are not built in the reference scenario. Modestly lowering
CT capital costs in a sensitivity case results in a combination of CTs and CCGTs being built. The relative
proportion of new generation shifts more toward CTs with increasing penetration of wind, PV, and CSP
0
in the sensitivity case. The assumed costs of new coal, nuclear, and pumped hydro storage are too high to
result in investments in these technologies at any of the considered levels of VG penetration.
Additions of VG primarily displace energy from natural gas fired CCGTs. Though pollution emisssions
are not a focus of this analysis, emissions are a byproduct of the investment and dispatch decisions. Increasing
penetration of variable generation results in decreased CO
2
, NO
x
, and SO
2
, even after accounting for part-
loading and emissions during start-up for thermal generation. The rate of emissions reduction varies with
penetration level and variable generation technology.
The case study also shows that the marginal economic value of VG differs substantially among VG
technologies and changes with increasing penetration. The resulting marginal economic value of wind, PV,
CSP
0
, and CSP
6
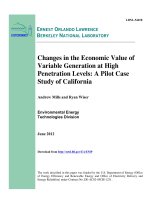
with increasing penetration of each VG technology is shown in Figure ES.1. For comparison,
also shown in the figure is the time-weighted average day-ahead wholesale power price at each penetration
level.
4
(a) Wind (b) PV
(c) CSP
0
(d) CSP
6
Note: Economic value in $/MWh is calculated using the total renewable energy that could be generated (energy
sold plus energy curtailed).
Figure ES.1: Marginal economic value of variable generation and an annual flat-block of power with
increasing penetration of variable generation in 2030.
The marginal economic value is calculated as the estimated short-run profit earned by VG from selling
power into a day-ahead and real-time power market that is in long-run equilibrium for the given VG pene-
tration. Because the system is in long-run equilibrium, the hourly market prices account for both the cost
of energy and capacity, similar to the few “energy-only” power markets in the U.S. and elsewhere. The
total revenue is calculated as the sum of the revenue earned by selling forecasted generation into the day-
ahead (DA) market at the DA price and the revenue earned by selling any deviations from the DA forecast
in the real-time (RT) market at the RT price. Variable generation is allowed to sell ancillary services (AS).
In the case of PV, CSP
0
, and wind only regulation down can be provided by the variable generators. Provi-
sion of regulation down by the variable generators only has a noticeable impact at high penetration levels.
Even at high penetration levels sales of regulation down change the value of variable generation by less than
$2/MWh. These generators are further charged for any assumed increase in the hourly AS requirements due
to increased short-term variability and uncertainty from VG. At all penetration levels, PV, CSP
0
, and wind
pay more for the additional AS requirements relative to revenue earned from selling regulation down.
In order to understand what drives the changes in marginal economic value with increasing penetration,
5
the economic value is decomposed into four separate components: capacity value, energy value, day-ahead
forecast error, and ancillary services. The resulting decomposition of the marginal economic value of each
VG technology and the same decomposition for increasing penetration of a flat block of power is shown in
Table ES.1. The components of the marginal economic value of VG with increasing penetration are shown
in $/MWh terms, where the denominator is based on the energy that could be generated by the VG (the
sum of the total energy sold and the total energy curtailed). The capacity value is also shown in $/kW-yr
terms to illustrate the annual capacity value per unit of nameplate capacity.
• Capacity Value ($/MWh): The portion of short-run profit earned during hours with scarcity prices
(defined to be greater than or equal to $500/MWh).
• Energy Value ($/MWh): The portion of short-run profit earned in hours without scarcity prices,
assuming the DA forecast exactly matches the RT generation.
• Day-ahead Forecast Error ($/MWh): The net earnings from RT deviations from the DA schedule.
• Ancillary Services ($/MWh): The net earnings from selling AS in the market from VG and paying for
increased AS due to increased short-term variability and uncertainty from VG.
The first key conclusion from this analysis is that the marginal economic value of all three solar options
considered here is high, higher than the marginal economic value of a flat block of power, in California at low
levels of solar penetration. This high value at low penetration is largely due to the ability of solar resources
to reduce the amount of new non-renewable capacity that is built, leading to a high capacity value. The
magnitude of the capacity value of solar resources depends on the coincidence of solar generation with times
of high system need, the cost of generation resources that would otherwise be built, and decisions regarding
the retirement of older, less efficient conventional generation.
Since the value of CSP at low solar penetration levels in California is found to be high with or without
thermal energy storage, we find that there is little apparent incremental value to thermal storage at low solar
penetration when the power system is in long-run equilibrium. Thermal energy storage may be justified for
other reasons, but there is no clear evidence in the present case study analysis that it is required in order to
maximize economic value at low solar penetration.
Without any mitigation strategies to stem the decline in the value of solar, however, the marginal economic
value of PV and CSP
0
are found to drop considerably with increasing solar penetration. For penetrations
of 0% to 10% the primary driver of the decline is the decrease in capacity value with increasing solar
generation: additional PV and CSP
0
are less effective at avoiding new non-renewable generation capacity
at high penetration than at low penetration. For penetrations of 10% and higher the primary driver of the
decline is the decrease in the energy value: at these higher penetration levels, additional PV and CSP
0
start
to displace generation with lower variable costs. At 20% solar penetration and above, there are increasingly
hours where the price for power drops to very low levels, reducing the economic incentive for adding additional
PV or CSP
0
. Eventually a portion of the energy generated by those solar technologies is curtailed. This
decline in the marginal economic value of PV and CSP without thermal storage is not driven by the cost of
increasing AS requirements and is not strongly linked to changes in the cost of DA forecast errors.
The marginal economic value of CSP
6
also decreases at higher penetration levels, but not to the extent
that the value of PV and CSP
0
decline. As a result, at higher penetration levels the value of CSP with thermal
storage is found to be considerably greater than the value of PV or CSP
0
at the same high penetration level.
The capacity value of CSP
6
remains high up to penetration levels of 15% and beyond because the thermal
energy storage is able to reduce the peak net load even at higher penetration levels.
The marginal economic value of wind is found to be significantly lower than solar at low penetration due
to the lack of correlation or slightly negative correlation between wind and demand. This lower value of
wind is largely due to the lower capacity value of wind. The decline in the total marginal economic value of
wind with increasing penetration is found to be, at least for low to medium penetrations of wind, largely a
result of further reductions in capacity value. The energy value of wind is found to be roughly similar to the
energy value of a flat block of power (and similar to the fuel and variable O&M cost of natural gas CCGT
6
Table ES.1: Decomposition of the marginal economic value of variable generation in 2030 with in-
creasing penetration.
Component Penetration of a Flat Block
($/MWh) 0% 5% 10% 15% 20% 30% 40%
Capacity Value
a
(170) 20 (180) 20 (170) 20 (180) 20 (180) 20 (180) 20 (140) 16
Energy Value 50 50 50 50 50 50 49
DA Forecast Error 0 0 0 0 0 0 0
Ancillary Services 0 0 0 0 0 0 0
Marginal Economic Value 70 70 70 70 70 70 65
Component Penetration of Wind
($/MWh) 0% 5% 10% 15% 20% 30% 40%
Capacity Value
a
(69) 17 (37) 12 (30) 10 (30) 10 (28) 9 (25) 8 (25) 8
Energy Value 50 49 48 48 48 46 39
DA Forecast Error -0.2 -3 -4 -2 -2 -3 -6
Ancillary Services -0.4 -0.2 -0.2 -0.2 -0.2 -0.2 -0.2
Marginal Economic Value 67 57 54 55 54 50 40
Component Penetration of PV
($/MWh) 0% 2.5% 5% 10% 15% 20% 30%
Capacity Value
a
(120) 37 (110) 34 (82) 27 (39) 13 (24) 8 (11) 4 (4) 1
Energy Value 54 53 52 49 45 41 27
DA Forecast Error -0.2 -5 -4 -6 -5 -4 -3
Ancillary Services -0.9 -0.8 -0.7 -0.4 -0.2 -0.1 -0.0
Marginal Economic Value 89 81 73 55 47 41 25
Component Penetration of CSP
0
($/MWh) 0% 2.5% 5% 10% 15% 20% 30%
Capacity Value
a
(110) 47 (84) 36 (54) 24 (22) 10 (11) 5 (6) 3 (5) 2
Energy Value 56 54 52 46 41 33 16
DA Forecast Error -2 -5 -5 -6 -5 -4 -4
Ancillary Services -1.1 -0.8 -0.5 -0.2 -0.1 -0.1 -0.1
Marginal Economic Value 100 84 70 50 41 32 14
Component Penetration of CSP
6
($/MWh) 0% 2.5% 5% 10% 15% 20% 30%
Capacity Value
a
(150) 37 (160) 37 (150) 37 (150) 35 (100) 24 (85) 20 (61) 15
Energy Value 55 55 55 55 58 53 52
DA Forecast Error -0.1 -1 -1 -1 -1 -2 -3
Ancillary Services 1.4 1.4 1.3 1.2 1.0 0.7 0.1
Marginal Economic Value 94 93 92 90 83 71 64
a - Capacity value in parentheses is reported in $/kW-yr terms and reported to two significant digits.
7
resources operating at full load). Only at very high penetration levels does the energy value of wind start
to drop in the California case study presented here. The DA forecast error costs have little influence on the
value of wind at low penetration and remain fairly manageable, on average less than $7/MWh, even at high
penetration levels. AS costs are not found to have a large impact on the economic value of wind as modeled
in this analysis.
At high penetration levels, the marginal economic value of wind is found to exceed the value of PV and
CSP without thermal storage. While the marginal economic value of solar exceeds the value of wind at low
penetration, at around 10% penetration the capacity value of PV and CSP
0
is found to be substantially
reduced leading to the total marginal economic value of PV and CSP
0
being similar to the value of wind. At
still higher penetrations, wind is found to have a higher marginal economic value than PV and CSP
0
. This
is due to the energy value of PV and CSP
0
falling faster than the energy value of wind while the capacity
value of wind remains slightly higher than the capacity value of PV and CSP
0
at high penetration levels.
As is explained in Section 5, the decline in the capacity value of PV and CSP
0
at high penetration is largely
due to the time with high net load and high wholesale power prices shifting from the late afternoon, when
solar production is high, to early evening hours when the sun is setting. The decline in the energy value is
due to a combination of increased part-loading of CCGTs, increased displacement of the small amount of
incumbent coal generation, and increased curtailment of PV and CSP
0
. These factors all impact the energy
value of wind in a similar way, though the impacts occur at relatively higher wind penetration levels. CSP
6
,
on the other hand, is found to have a considerably higher value than wind at all penetration levels.
Though some of these results may be somewhat unique to the specific case study presented here, and
the model only captures a subset of the benefits and costs of renewable energy, the findings provide unique
insight into how the value of that subset changes with technology and penetration level. Moreover, the
magnitude of these variations in value across technologies and at different penetration levels suggest that
resource planners, policy makers, and investors should carefully consider the economic value and relative
differences in the economic value among renewable energy technologies when conducting broader analyses of
the costs and benefits of renewable energy. The findings also show the importance of an analysis framework
that addresses long-term investment decisions as well as short-term dispatch and operational constraints,
and point to areas where future research is warranted. For example, though this study focused on California
and just one variable generation technology at a time, the same framework can be used to understand the
economic value of variable generation in other regions and with different combinations of renewable energy.
In a future report, the same framework will be used to evaluate how changes in the power system, like
price responsive demand, more flexible thermal generation, and lower cost bulk power storage, might impact
the value of variable generation. Each of these “mitigation strategies” might help slow the decline in the
marginal economic value of variable generation found in this report.
8
Contents
1 Introduction 13
2 Background 15
2.1 Role of Economic Value in Renewable Procurement Decisions . . . . . . . . . . . . . . . . . . 15
2.2 Modeling the Long-Run Impact of Variable Renewables at Varying Penetration Levels . . . . 16
2.3 Existing Studies of the Economic Value of Variable Renewables . . . . . . . . . . . . . . . . . 18
3 Methodology 20
3.1 Dispatch . . . . . . . . . . . . . . . . . . . . . . . . . . . . . . . . . . . . . . . . . . . . . . . . 22
3.1.1 Commitment Approach . . . . . . . . . . . . . . . . . . . . . . . . . . . . . . . . . . . 23
3.1.2 Storage and Hydro Resource Dispatch . . . . . . . . . . . . . . . . . . . . . . . . . . . 24
3.1.3 Scarcity Prices . . . . . . . . . . . . . . . . . . . . . . . . . . . . . . . . . . . . . . . . 24
3.1.4 Revenues . . . . . . . . . . . . . . . . . . . . . . . . . . . . . . . . . . . . . . . . . . . 25
3.1.5 Low Price Periods and Curtailment . . . . . . . . . . . . . . . . . . . . . . . . . . . . 26
3.1.6 Virtual Load . . . . . . . . . . . . . . . . . . . . . . . . . . . . . . . . . . . . . . . . . 26
3.2 Investment . . . . . . . . . . . . . . . . . . . . . . . . . . . . . . . . . . . . . . . . . . . . . . 28
3.3 Implied Capacity Credit . . . . . . . . . . . . . . . . . . . . . . . . . . . . . . . . . . . . . . . 30
3.4 Estimation of Long-run Value . . . . . . . . . . . . . . . . . . . . . . . . . . . . . . . . . . . . 30
3.4.1 Decomposition of Marginal Economic Value . . . . . . . . . . . . . . . . . . . . . . . . 31
4 Data and Assumptions 32
4.1 Variable Generation . . . . . . . . . . . . . . . . . . . . . . . . . . . . . . . . . . . . . . . . . 33
4.2 Load . . . . . . . . . . . . . . . . . . . . . . . . . . . . . . . . . . . . . . . . . . . . . . . . . . 34
4.3 Hydropower and Pumped Hydro Storage . . . . . . . . . . . . . . . . . . . . . . . . . . . . . . 34
4.4 Thermal Generation Vintages and Technical Life . . . . . . . . . . . . . . . . . . . . . . . . . 35
4.5 Incumbent Generation Capacity . . . . . . . . . . . . . . . . . . . . . . . . . . . . . . . . . . . 35
4.6 Generation Operational Parameters . . . . . . . . . . . . . . . . . . . . . . . . . . . . . . . . 35
4.7 Fuel Costs . . . . . . . . . . . . . . . . . . . . . . . . . . . . . . . . . . . . . . . . . . . . . . . 37
4.8 New Investments . . . . . . . . . . . . . . . . . . . . . . . . . . . . . . . . . . . . . . . . . . . 37
4.9 Ancillary Service Requirements . . . . . . . . . . . . . . . . . . . . . . . . . . . . . . . . . . . 37
5 Results 38
5.1 Investment and Dispatch Impacts . . . . . . . . . . . . . . . . . . . . . . . . . . . . . . . . . . 38
5.1.1 Nameplate Capacity of Generation . . . . . . . . . . . . . . . . . . . . . . . . . . . . . 38
5.1.2 Energy Production . . . . . . . . . . . . . . . . . . . . . . . . . . . . . . . . . . . . . . 43
5.1.3 Avoided Emissions . . . . . . . . . . . . . . . . . . . . . . . . . . . . . . . . . . . . . . 47
5.1.4 Curtailment . . . . . . . . . . . . . . . . . . . . . . . . . . . . . . . . . . . . . . . . . . 51
5.2 Marginal Economic Value . . . . . . . . . . . . . . . . . . . . . . . . . . . . . . . . . . . . . . 54
5.3 Decomposition of Marginal Economic Value . . . . . . . . . . . . . . . . . . . . . . . . . . . . 57
5.4 Sensitivity Cases . . . . . . . . . . . . . . . . . . . . . . . . . . . . . . . . . . . . . . . . . . . 65
5.4.1 No Operational Constraints . . . . . . . . . . . . . . . . . . . . . . . . . . . . . . . . . 66
5.4.2 Carbon Cost . . . . . . . . . . . . . . . . . . . . . . . . . . . . . . . . . . . . . . . . . 66
5.4.3 Cost of Capacity . . . . . . . . . . . . . . . . . . . . . . . . . . . . . . . . . . . . . . . 68
5.4.4 No Retirements . . . . . . . . . . . . . . . . . . . . . . . . . . . . . . . . . . . . . . . . 70
6 Conclusions 70
A Overview of the Model 82
9
B Detailed Description of Investment Search Procedure 84
B.1 Simplification of Investment and Operation Problem . . . . . . . . . . . . . . . . . . . . . . . 84
B.2 Approximation of the Investment Problem . . . . . . . . . . . . . . . . . . . . . . . . . . . . . 85
B.3 Estimating the Change in Social Surplus with Installed Capacity . . . . . . . . . . . . . . . . 86
B.3.1 Convergence Criteria . . . . . . . . . . . . . . . . . . . . . . . . . . . . . . . . . . . . . 86
B.4 Implementation . . . . . . . . . . . . . . . . . . . . . . . . . . . . . . . . . . . . . . . . . . . . 87
C Commitment and Dispatch Model Formulation 88
D Model Parameters 94
E Decomposition Tables for Sensitivity Scenarios 105
E.1 No Operational Constraints . . . . . . . . . . . . . . . . . . . . . . . . . . . . . . . . . . . . . 105
E.2 Carbon Cost . . . . . . . . . . . . . . . . . . . . . . . . . . . . . . . . . . . . . . . . . . . . . 106
E.3 Cost of Capacity . . . . . . . . . . . . . . . . . . . . . . . . . . . . . . . . . . . . . . . . . . . 107
E.4 No Retirements . . . . . . . . . . . . . . . . . . . . . . . . . . . . . . . . . . . . . . . . . . . . 108
F Scarcity Pricing and Loss of Load Expectation 109
F.1 Overview . . . . . . . . . . . . . . . . . . . . . . . . . . . . . . . . . . . . . . . . . . . . . . . 109
F.2 Illustration . . . . . . . . . . . . . . . . . . . . . . . . . . . . . . . . . . . . . . . . . . . . . . 109
F.3 Implications . . . . . . . . . . . . . . . . . . . . . . . . . . . . . . . . . . . . . . . . . . . . . . 111
10
List of Figures
ES.1 Marginal economic value with increasing VG penetration . . . . . . . . . . . . . . . . . . . . 5
1 Framework for evaluating long-run economic value . . . . . . . . . . . . . . . . . . . . . . . . 19
2 Dependence of short-run profit on total nameplate capacity . . . . . . . . . . . . . . . . . . . 29
3 Capacity and energy with increasing penetration of a flat block . . . . . . . . . . . . . . . . . 39
4 Nameplate capacity with increasing VG penetration . . . . . . . . . . . . . . . . . . . . . . . 42
5 Energy generation with increasing VG penetration . . . . . . . . . . . . . . . . . . . . . . . . 44
6 CO
2
emissions with increasing VG penetration . . . . . . . . . . . . . . . . . . . . . . . . . . 48
7 NO
x
emissions with increasing VG penetration . . . . . . . . . . . . . . . . . . . . . . . . . . 49
8 SO
2
emissions with increasing VG penetration . . . . . . . . . . . . . . . . . . . . . . . . . . 50
9 Curtailment of generation with increasing VG penetration . . . . . . . . . . . . . . . . . . . . 53
10 Marginal economic value with increasing VG penetration . . . . . . . . . . . . . . . . . . . . 56
11 Net load and energy prices on peak days with increasing PV . . . . . . . . . . . . . . . . . . . 63
12 Net load and energy prices on peak days with increasing CSP
6
. . . . . . . . . . . . . . . . . 64
13 Change in marginal economic value when operational constraints are ignored . . . . . . . . . 67
14 Change in marginal economic value with a $32/tonne CO
2
carbon cost . . . . . . . . . . . . . 67
15 Change in marginal economic value with a lower cost of capacity . . . . . . . . . . . . . . . . 69
16 Change in marginal economic value without retirements of existing generation . . . . . . . . . 69
List of Tables
ES.1 Decomposition of marginal economic value of variable generation . . . . . . . . . . . . . . . . 7
1 Duration of price spikes . . . . . . . . . . . . . . . . . . . . . . . . . . . . . . . . . . . . . . . 40
2 Unmet load as a percentage of total annual load . . . . . . . . . . . . . . . . . . . . . . . . . 41
3 Short-run profit of investment options with and without VG . . . . . . . . . . . . . . . . . . . 41
4 Effective incremental capacity credit of VG . . . . . . . . . . . . . . . . . . . . . . . . . . . . 44
5 Capacity factor of incumbent CCGT resources . . . . . . . . . . . . . . . . . . . . . . . . . . 46
6 Average load factor of incumbent CCGT resources . . . . . . . . . . . . . . . . . . . . . . . . 46
7 Average heat rate of incumbent CCGT resources . . . . . . . . . . . . . . . . . . . . . . . . . 47
8 Avoided CO
2
emissions . . . . . . . . . . . . . . . . . . . . . . . . . . . . . . . . . . . . . . . 52
9 Avoided NO
x
emissions . . . . . . . . . . . . . . . . . . . . . . . . . . . . . . . . . . . . . . . 52
10 Avoided SO
2
emissions . . . . . . . . . . . . . . . . . . . . . . . . . . . . . . . . . . . . . . . 52
11 Decomposition of marginal economic value of variable generation . . . . . . . . . . . . . . . . 59
12 Generator vintages . . . . . . . . . . . . . . . . . . . . . . . . . . . . . . . . . . . . . . . . . . 94
13 Assumed retirement age . . . . . . . . . . . . . . . . . . . . . . . . . . . . . . . . . . . . . . . 95
14 Incumbent generator capacity . . . . . . . . . . . . . . . . . . . . . . . . . . . . . . . . . . . . 95
15 Generator operational characteristics . . . . . . . . . . . . . . . . . . . . . . . . . . . . . . . . 97
16 Generator blocks . . . . . . . . . . . . . . . . . . . . . . . . . . . . . . . . . . . . . . . . . . . 98
17 Generator incremental heat rate . . . . . . . . . . . . . . . . . . . . . . . . . . . . . . . . . . 99
18 Generator start-up emissions . . . . . . . . . . . . . . . . . . . . . . . . . . . . . . . . . . . . 100
19 Generator NO
x
emissions . . . . . . . . . . . . . . . . . . . . . . . . . . . . . . . . . . . . . . 101
20 Generator SO
2
emissions . . . . . . . . . . . . . . . . . . . . . . . . . . . . . . . . . . . . . . . 102
21 Generator costs . . . . . . . . . . . . . . . . . . . . . . . . . . . . . . . . . . . . . . . . . . . . 103
22 Fuel costs and CO
2
emission rate . . . . . . . . . . . . . . . . . . . . . . . . . . . . . . . . . . 103
23 Monthly hydro generation budget and min-flow . . . . . . . . . . . . . . . . . . . . . . . . . . 104
24 Storage characteristics . . . . . . . . . . . . . . . . . . . . . . . . . . . . . . . . . . . . . . . . 104
25 Decomposition of marginal economic value of VG when operational constraints are ignored . 105
26 Decomposition of marginal economic value of VG with $32/tonne CO2 carbon cost . . . . . . 106
27 Decomposition of marginal economic value of VG with lower capacity cost . . . . . . . . . . . 107
28 Decomposition of marginal economic value of VG with no retirements . . . . . . . . . . . . . 108
11
Acronyms
AS Ancillary services
CAISO California Independent System Operator
CCGT Combined cycle gas turbine
CEMS Continuous Emissions Monitoring System
CSP Concentrating solar power
CT Combustion turbine
DA Day ahead
EIA Energy Information Administration
EPA Environmental Protection Agency
EUE Expected Unserved Energy
LCOE Levelized cost of energy
LOLP Loss of load probability
LOLE Loss of load expectation
NERC North American Electric Reliability Corporation
NREL National Renewable Energy Laboratory
O&M Operations and maintence
PHS Pumped hydro storage
PPA Power purchase agreement
PTC Production tax credit
PV Photovoltaic
REC Renewable energy credit
RPS Renewables portfolio standard
RT Real time
SAM System Advisor Model
T&D Transmission and distribution
TES Thermal energy storage
WECC Western Electricity Coordinating Council
WREZ Western Renewable Energy Zone Initiative
WWSIS Western Wind and Solar Integration Study
VG Variable generation
VOLL Value of lost load
12
1 Introduction
Long term decisions regarding how much renewable energy to procure, what type of renewable energy to
procure, and what supporting infrastructure to build are made difficult by the variable and unpredictable
nature of some renewable resources, in particular wind and solar. In order for decisions to be made on an
economic basis, the costs of procuring variable renewables needs to be compared to the benefits of those
renewables. The costs side of the equation considers metrics like the levelized cost of energy (LCOE) or the
cost of a power purchase agreement (PPA) (Wiser and Bolinger, 2011; Barbose et al., 2011; Fischedick et al.,
2011). The costs can also include the contribution of renewables in expanding the need for infrastructure,
like the bulk transmission network, to deliver renewables supply to electric loads (Holttinen et al., 2011; Mills
et al., 2011, 2012). The benefits side, also called the “avoided costs”, can include a wide range of factors
including hedging against fossil fuel price fluctuation, reducing environmental impacts from other sources
of electricity, and avoiding fuel, operations and capital cost expenditures from operating other power plants
(Angeliki, 2008). Renewable resources that are sited on the distribution system near electric loads have
further potential benefits of reducing electrical losses and avoiding expenditures related to transmission and
distribution (T&D) system infrastructure. The potential benefits depend on a wide range of factors including
penetration level, generation profile, and network characteristics (Passey et al., 2011; Cossent et al., 2011).
This report only focuses on quantifying the benefits side of this equation and it further only focuses on
a subset of the benefits. The objective of the research is to quantitatively examine the marginal economic
benefits of additional variable renewables in avoiding the capital investment cost and variable fuel and oper-
ations and maintenance (O&M) costs from other power plants in a power system while including operational
constraints on conventional generators and the increased need for ancillary services from additional variable
renewables. This subset of the benefits of renewables will be referred to as the “marginal economic value”
in this paper, though it is recognized that this narrow definition of marginal economic value focuses only on
certain direct cost savings of renewable energy in wholesale electricity markets and does not include many
other impacts that renewable energy sellers, purchasers, and policymakers might and do consider. The anal-
ysis does not include impacts to the transmission and distribution system so the potential benefits or costs of
distributed generation are excluded from this report. This report also does not consider externalities, public
benefits, or renewable energy costs in evaluating the narrowly defined economic value.
The primary focus of this research is in determining how the economic value of variable renewables
changes with increasing penetration levels. The economic value with increasing penetration levels is compared
between four renewable technologies: wind, single-axis tracking photovoltaics (PV),
1
concentrating solar
power (CSP) without thermal storage (CSP
0
), and CSP with 6 hours of thermal storage (CSP
6
).
2
The
purpose of comparing four different technologies at many different penetration levels is to highlight the
drivers of changes and differences in the value of variable renewables along with areas where further research
is warranted. In addition to examining the changes in the value of variable renewables with increasing
penetration, a case where the penetration of a flat block of power that delivers electricity on a 24 × 7 basis
is increased in a manner similar to the variable generation cases for comparison purposes.
This report loosely uses California as a case study to explore these impacts, and relies on an investment
and dispatch model that simultaneously considers long-run investment decisions and short-run operational
constraints using hourly data over a full year. The dispatch model does not include transmission constraints
1
Deployment of PV is currently a mix of fixed PV with various orientations, single-axis tracking PV, dual axis tracking
PV, and concentrating PV. This report only evaluates single-axis tracking PV tilted at an angle equivalent to the latitude of
the PV site. Though the exact numerical results will likely differ across the different PV technologies or combinations of PV
technologies, analysis of the value of PV at low penetration demonstrates that the value of PV differs by less than $10/MWh
between fixed PV tilted at the latitude and oriented toward the south and tracking PV. Between single-axis tracking at zero
tilt, single-axis tracking at latitude tilt, and dual axis tracking the differences in the marginal economic value at low penetration
are less than $3/MWh.
2
This report does not consider the potential for natural gas firing in the steam generator of a CSP plant nor does it consider
hybrid solar-conventional plants where steam from the solar field is injected into the feedwater system of a conventional thermal
plant (e.g. the steam cycle of a CCGT or a coal plant). Furthermore, thermal storage for CSP, which is dispatched based on
system needs within the dispatch model, is limited to 6 hours in the majority of the scenarios except one test of the economic
value of CSP with 10 hours of thermal storage at 20% penetration. These potential mitigation options for CSP could be
considered in future research.
13
nor does it consider the potential for generation outside of the case study area (California in this report) to
be displaced or to provide flexibility in managing increased variable generation. Variable generation that is
sited outside of California, however, is assumed to be able to be dynamically scheduled into California, such
that all of the variability and uncertainty is managed within California. The model was designed to quickly
evaluate the economic value of variable renewable resources over a wide range of penetration levels and a
variety of sensitivity scenarios.
Absent from this analysis is an evaluation of several strategies that might be available to reduce any decline
in economic value of variable renewables with increasing penetration. These strategies, including technology
diversity (i.e., combinations of VG technologies), more flexible thermal generation, price responsive demand
through real-time pricing programs, and low cost bulk power storage, may increase in value with increasing
penetration of variable renewables and in turn, may increase the economic value of variable renewables
at higher penetration levels. A future report will use the same framework presented here to evaluate the
impact of these strategies in more detail. In addition, assumptions regarding the interaction of California
with generation and loads in the rest of the Western Electricity Coordinating Council (WECC) could be
examined in the future since excluding the rest of WECC from this analysis is potentially an important
assumption.
3
The remainder of this report begins by reviewing the existing literature regarding the economic value
of variable renewables and changes in that value with increasing penetration levels. The review focuses on
describing the importance of the long-run economic value of variable energy generation while also considering
operational constraints in conventional power systems. The following section outlines the methodology used
in this report to evaluate the economic value of variable generation (VG) with increasing penetration levels,
including a description of how investment decisions in non-VG resources are made in the model, how those
resources are dispatched, and how long-run wholesale electricity prices are calculated. The methodology
section also explains the implied capacity credit of variable generation and how the economic value of variable
generation is decomposed into several different components. The data and assumptions section provides
further detail on the quantitative input values used in the case study presented in this report of increasing
penetration of variable generation for 2030 in California. The results section then summarizes the long-run
dispatch and investment results for different penetration levels of variable generation to help understand the
long-run economic value of variable generation. The long-run value of wind, PV, and CSP with and without
thermal storage are then compared with increasing penetration and that value is then decomposed into
several constituent parts. Sensitivity cases that include relaxing thermal and hydro operational constraints,
adding a carbon tax, reducing the cost of resources that primarily provide capacity (i.e., combustion turbine
peaker plants), and assuming that no thermal plants retire for technical life reasons by 2030 are then used
to better understand the factors that impact the economic value of variable generation. Key findings from
the results are then summarized in the final concluding section. The appendices provide an overview and
detailed description of the model developed for and used in this report, numeric values for parameters used
to characterize thermal and hydro generation, and additional results from the sensitivity scenarios.
3
Regarding the marginal economic value of variable generation the assumption that the rest of WECC is ignored may
understate the value at high penetration levels for the following reasons:
• If the rest of WECC has low VG penetration then the effective penetration considering all of WECC will be lower than
the effective penetration considering only California.
• The rest of WECC has additional incumbent sources of flexibility including large hydro resources and additional pumped
hydro storage that are not included. Furthermore additional thermal generation may be able to help manage variability
and uncertainty so that California generators do not need to provide as much flexibility.
• Some loads in the rest of WECC have peak periods that correspond with heating loads in the winter evening which may
increase the capacity value of wind.
This assumption may also overstate the value at high penetration levels for the following reasons:
• WECC has additional generation with low variable costs or limited flexibility, including incumbent coal and nuclear
generation. Expanding the analysis footprint to all of WECC would increase the overall proportion of these resources
thereby decreasing the energy value and increasing the curtailment of variable generation.
Without more detailed analysis it is not possible to say with certainty which of these factors would have the biggest impact on
the marginal value of variable generation at high penetration levels.
14
2 Background
Before describing the methodology used to evaluate the economic value of variable generation with increasing
penetration levels in Section 3, this section first provides motivation for the detailed focus on the economic
value of variable renewables, outlines approaches for estimating long-run economic value, and identifies
previous studies of the economic value of variable renewables. The majority of the existing literature that
covers the economic value of variable generation focuses on wind, though more recent studies have begun to
evaluate the economic value of solar. This section again only focuses on literature that covers the limited
definition of economic value used in this report, which covers direct investment costs, fuel costs, O&M costs
for conventional generators and excludes investment costs for variable generators, T&D impacts, and other
public benefits. This narrow focus does not provide a full cost/benefit analysis of variable generation, but it
does allow clear exploration of a subset of the issues that would drive a full cost/benefit analysis.
2.1 Role of Economic Value in Renewable Procurement Decisions
The need to better understand the economic value of variable renewables was recently highlighted by Joskow
(2011) and Borenstein (2012). Joskow argues that it is inappropriate to make economic comparisons of
variable generation resources based only on life cycle costs or LCOE metrics. The reason that comparisons
based on LCOE alone are inappropriate is that the economic value of a unit of energy depends on the time
when the energy is generated, or more specifically, the conditions of the power market during that time. The
value of energy, as captured by wholesale power market prices, can vary by orders of magnitude depending on
whether the power system has ample low cost generation available or little generation of any sort available.
Energy that is generated during times when prices are high is much more valuable than energy generated
during times when prices are low. Economic comparisons between different generating technologies need to
therefore account for how well correlated generation is with these times. Since LCOE comparisons do not
account for differences in value depending on when energy is generated, these comparisons do not reflect
differences in the value of a resource to a power system.
An alternative to comparing resources simply based on LCOE metrics or PPA prices is to compare them
based on their relative total net benefits. The total net benefit in this case might be estimated by subtracting
the total costs of a resource from the total revenues it would earn by selling its power into a wholesale power
market with time varying prices. This is also called the “market test” by Borenstein (2012). Analogously,
this test can be restated as: does the short-run profit of a resource exceed its fixed costs of investment and
operations, where the short-run profit is the difference between the total revenues earned if power were sold at
prevailing wholesale market prices and the generator’s variable costs (i.e., fuel, wear & tear, and O&M).
4
As
noted by Borenstein, there is active debate regarding the extent to which variable renewables impose costs
that cannot be reflected in energy market prices because the costs are due to actions that power system
operators take outside of the normal market timelines. In particular, system operators may need to add
additional operating reserves or some other form of non-energy market product (e.g. a “ramping product”)
to accommodate variability and uncertainty that is not resolved within the timelines of the power market
(e.g., reserves to manage sub-hourly variability and uncertainty in a market where the shortest scheduling
interval is hourly). In this case, the market test can be modified by further subtracting any estimated share
of additional costs due to the variable generators from the short-run profit.
This comparison can be carried out for any potential generation investment. Those resources whose
short-run profits exceed fixed costs are the resources that are economic, not considering the other factors
that might impact decisions mentioned earlier. Those resources whose short-run profits fall short of fixed
costs require additional sources of revenue or a reduction in costs in order to also be economic. The required
4
Often individual renewable energy plants sell their output directly to a load serving entity through a long-term contract
based on a fixed price per unit of energy. In this case, the net benefit can be calculated from the perspective of the purchaser
where the total cost is represented by the price paid for the power (the PPA price) and benefits are the time-varying avoided
costs from not needing to buy the same amount of power from the wholesale power market at that time. In this fashion the
perspective shifts from the resource owner to the resource purchaser, but the net benefits of the resource remain quantitatively
similar.
15
increase in revenue or decrease in costs depends on the size of the gap between the short-run profit and the
fixed costs. The idea of “grid parity” for any resource could similarly be interpreted as the point where the
fixed cost of the resource equals the short-run profit of that resource in a power market.
Previous analysis of the sensitivity of renewable resource procurement decisions and transmission expan-
sion in the Western Interconnection (Mills et al., 2011) used a similar framework to the approach advocated
by Joskow and Borenstein. The analysis used a simplified framework where different renewable resource op-
tions were compared based on the delivered cost of the renewables net the market value of these renewables
to load zones throughout the western United States. The analysis found that resource procurement and
transmission expansion decisions in the Southwest were sensitive to factors affecting the cost of generating
renewable energy (the bus-bar costs), the costs of delivering renewable resources to loads (the transmission
costs), and the economic value of the renewables to loads (the market value). Depending on the scenario,
resources would shift between wind and solar and transmission needs would similarly shift between high
quality solar resource regions in the Southwest and various high quality wind resource locations throughout
the West. The base solar technology assessed in the previous analysis was CSP
6
; PV and CSP
0
were included
in sensitivity cases. For a 33% renewable energy target, the solar penetration, in terms of the total amount
of energy generated by solar as a percentage of the annual demand,
5
was found to vary between 4–13% and
the wind penetration was found to vary between 12–21% depending on the scenario.
One of the simplifying assumptions in the screening tools used in that study was that the economic value
of the renewables did not change with penetration level. Part of the motivation of the present report was
to develop a better understanding of how the economic value of variable renewables changes at increasing
penetration levels. To develop this understanding a much more detailed investment and dispatch model was
required to evaluate the economic value component with increasing penetration levels. As will be explained,
one of the main findings of this analysis is that the marginal economic value of variable renewables does
change between low penetration and high penetration, particularly for PV and CSP
0
.
Projections of high future penetration levels of variable renewables are common. Contributing to these
projections in the U.S. are the 29 states in the U.S. with renewable energy standards, including California
which is set at 33% renewables by 2020 (Wiser and Bolinger, 2011). In addition, the U.S. Congress has in the
past considered further supporting clean energy with federal standards. The European Union set an overall
binding share of gross final energy consumption of 20% renewables by 2020 (IEA, 2010). As a result of this
binding target, renewable electricity is expected to provide 37% of Europe’s electrcity in 2020 with wind
and solar both making substantial contributions (European Commission, 2011). Combined with interest in
variable renewables in other countries and operating experience in countries with high penetration of wind
energy, it is clear that there is strong interest in understanding the impacts of high penetration of renewable
energy.
There is also interest in high penetration of variable renewables in studies that focus on mitigating climate
change. In one assessment of 162 different climate mitigation and future energy scenarios, the percentage
of electricity from wind energy in aggressive mitigation scenarios by 2030 was around 10% in the median
scenario with the 75
th
percentile approaching 25% wind penetration. The percentage of electricity from PV
in the aggressive mitigation scenarios by 2030 reached only around 1% in the median scenario and 7% in
the 75
th
percentile scenario though with more-sizable growth after 2030 (Krey and Clarke, 2011). Given the
range of variable renewable penetration levels that are being considered in these and other studies, as well as
the high levels of VG already experienced in some regions and to increasingly be expected in other regions it
is important to understand how the economic value of variable renewables might change over a wide range
of penetration levels.
2.2 Modeling the Long-Run Impact of Variable Renewables at Varying Pene-
tration Levels
One of the challenges of using wholesale power market prices to evaluate the economic value of variable
generation (to then compare to the fixed cost or PPA price of those technologies) is that wholesale prices
5
All penetration levels in this report similarly refer to penetration on an energy basis.
16
will change over the lifetime of a power plant. The current prices in this year or the prices in previous years
may not reflect trends that can affect future prices like fuel changes, increased emissions controls or other
environmental restrictions, and changes in the capital costs of new power plants. More importantly for the
focus of this report, wholesale power prices change with increasing penetration of variable generation (Ja-
cobsen and Zvingilaite, 2010; Woo et al., 2011; Podewils, 2011).
6
The recommendation that wholesale power
market prices be used to estimate the economic value of variable generation from Joskow and Borenstein
therefore requires the use of models to estimate future wholesale prices, particularly in the case of evaluating
the economic value of variable generation with increased penetration levels.
There are several options available for creating models of future wholesale prices with increasing pene-
tration of variable generation. As one approach, a number of studies have estimated the impact of variable
renewables on power system operations by simply adding increased variable generation to a static mix of
other generation capacity. In particular, a significant body of literature specifically evaluates the flexibility
of the conventional generation system and the technical feasibility of integrating wind energy into existing
power systems (Klobasa and Obersteiner, 2006; Smith et al., 2007; Strbac et al., 2007; Gross et al., 2007;
Ummels et al., 2007; Gransson and Johnsson, 2009; Maddaloni et al., 2009; Wiser and Bolinger, 2011; Holtti-
nen et al., 2011). The focus of this literature has primarily been based on the operations of the power system
with increased wind and has therefore generally assumed that existing conventional generation is dispatched
differently but that the installed capacity of that generation does not change with increased wind. The prices
generated by models used in this literature therefore reflect only the short-run economic value of wind and
not the long-run economic value of wind.
A short-run analysis, as used in these studies, is useful for a conservative assessment of operational
integration issues, such as evaluating the technical feasibility of managing variable generation. A short-run
analysis may be particularly useful for analyzing low levels of wind or solar penetration since low levels of
penetration would not significantly affect wholesale power market prices or the mix of generation resources.
Scenarios of high wind and solar penetration over a period long enough to make investments in (or
retirements of) other generating technologies, however, are better dealt with using a long-run analysis that
can allow for changes in the generation mix due to new investments and plant retirements. In addition,
answering questions about the impact of VG on investment incentives for conventional generation, investment
incentives for measures to better manage wind or solar energy variability and uncertainty like storage,
or impacts on consumer electricity prices all require understanding long-run dynamics. Some previous
analyses of these latter questions have instead used a short-run framework where wind penetration is changed
significantly and all other investments in the power system are kept the same irrespective of the wind
penetration level (Hirst and Hild, 2004; Olsina et al., 2007; Sensfuß et al., 2008; Sioshansi and Short, 2009;
Green and Vasilakos, 2010; Sioshansi, 2011; Traber and Kemfert, 2011): as a result, the conclusions from
these studies only reflect short-run impacts and do not address important questions about the long-term
impact of variable generation.
In the long run, generation can retire for technical or economic reasons, load can grow necessitating
increased generation capacity, or new investments can be made based on the expected economic attractiveness
of building new generation. The nature of some of these changes can be impacted by the amount of VG
penetration. These long-run changes are therefore relevant for modeling future prices and for understanding
the value of variable generation over the lifetime of a power plant, especially at higher VG penetration levels.
As described in more detail later, the model used in this report for estimating the value of variable
generation is based on a long-run modeling framework that addresses investment and retirement decisions
while also accommodating important operating constraints for conventional generation, Text Box 1. A
product of the long-run modeling framework are hourly prices for energy and ancillary services that reflect
the long-run cost of meeting an additional unit of demand in any particular hour. These long-run hourly
6
Jacobsen and Zvingilaite (2010) reports lower prices and higher volatility with increasing wind in Denmark, while Woo
et al. (2011) reports the same for wind in ERCOT. Morthorst (2003) reports a relatively weak relationship between wholesale
market prices and wind, but a stronger relationship between wind generation and prices in imbalance markets. J´onsson et al.
(2010) shows that a stronger relationship exists between wholesale prices in the day-ahead market and day-ahead predictions of
wind power rather than day-ahead prices and actual wind generation. Podewils (2011) reports that mid-day day-ahead prices
in Germany are decreasing due to the addition of large amounts of photovoltaic generation.
17
prices in combination with generation profiles are used to estimate the economic impact of adding additional
variable generation resources.
2.3 Existing Studies of the Economic Value of Variable Renewables
Beyond the studies focused on operational integration challenges and studies of the economic value of VG at
high penetration that use a short-run analysis framework cited earlier, a number of studies have examined the
economic value of variable generation using either current prices or long-run prices generated in a scenario
with no or low amounts of variable generation. Borenstein (2008) used historic real-time prices and simulated
long-run equilibrium prices to estimate the economic value of PV in California at zero penetration. He showed
that the long-run value of PV can exceed the value estimated using only flat-rate retail tariffs by up to 30–
50% if fixed-axis PV panels were oriented toward the southwest. Mills et al. (2011) estimated market value
adjustment factors for a variety of renewable resources in the western U.S. and found that the per unit
of energy market value of solar technologies, particularly CSP
6
, generally exceeded the per unit of energy
market value of generation resources that were assumed to have flat generation profiles (e.g., biomass). The
market value of wind was found to be lower than the market value of biomass, depending on the combination
of wind generation profile and load center where the wind generation was delivered. Sioshansi and Denholm
(2010) used current wholesale power prices in the Southwestern U.S to evaluate the economic profitability
of CSP with and without thermal energy storage over a wide range of thermal storage and solar field size
combinations. Fripp and Wiser (2008) found relatively little correlation between historic wholesale prices
and different wind generation profiles in the western U.S. At low penetration the wholesale value of wind
power was found to be similar to or up to around 10% less than the value of a flat block of power, depending
on the wind site.
A growing body of literature provides significant insights into the long-run economic value of variable
generation considering long-term investment and retirement decisions with increasing penetration levels,
though with varying levels of temporal and geographic resolution. The models used in these studies are not
necessarily designed to just quantify the economic value of renewables with increasing penetration, but the
economic value of these resources is implicitly estimated in these models. In the U.S., the National Energy
Modeling System (NEMS) is used by the Energy Information Administration to create energy forecasts in
the Annual Energy Outlook. NEMS includes wind and solar energy in the mix of potential resources in their
long-run assessment of future energy markets. The temporal resolution of NEMS, however, allows for only
nine time periods per year and the geographic resolution is limited to thirteen supply regions (EIA, 2010).
The contribution of CSP to energy supply was investigated by Zhang et al. (2010) in the GCAM integrated
assessment model, a model used for assessing future climate change mitigation scenarios. The GCAM
model only used ten time slices over the year. Even with this low time resolution, Zhang et al. (2010)
found decreasing economic incentives to build additional CSP with increasing penetration, though higher
penetration levels were still attractive with the addition of a few hours of thermal storage.
The Renewable Energy Deployment System (ReEDS) model developed by the National Renewable Energy
Laboratory greatly increases the geographic resolution of load and renewable energy data, but still uses
relatively low temporal resolution of 17 time-periods per year. Several additional statistical correction
factors are included in ReEDS to address the relatively low temporal resolution.
7
The ReEDS model has
been used to evaluate investments in scenarios with 20% wind energy (DOE, 2008) and 20% solar (Brinkman
et al., 2011).
8
Comparison of dispatch and investment results depending on the level of temporal resolution used in
modeling high wind penetration scenarios indicates that temporal resolution can significantly impact esti-
mates of the long-run economic value of wind (Nicolosi et al., 2010; Ludig et al., 2011). As a result, when
practical computing constraints can be overcome, studies of the long-run economic value of VG are increas-
ingly seeking higher levels of temporal resolution, up to hourly with a full year or more of wind, solar and
7
/>8
In addition to developing generation investment decisions using 17 time-periods per year using the ReEDS model, Brinkman
et al. (2011) verify that the system built by ReEDS can be operated using an hourly production cost model. The results of the
hourly production cost model, however, are not fed back into the build-out and design of the system in ReEDS.
18
Text Box 1. Framework for evaluating long-run equilibrium
When a power system is in equilibrium, meaning that there is no economic incentive for existing units to
leave the market and no economic incentive for additional units to be built, and only small changes in the
system are investigated, short-run prices and long-run prices are similar. Major changes to a system, such as
the addition of large amounts of wind or solar energy, however, can lead to a significant divergence between
short-run prices and long-run prices. The long life of variable generation assets (>20 years) leaves time for
changes in the other generation resources (e.g., retirement and new investment) and makes long-run prices
more relevant for understanding the overall economic value of variable generation.
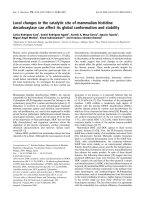
Stoft (2002) presents a simple framework for understanding the long-run dynamic response to changes in
power systems, Figure 1. The operation of generating resources in a power market impacts short-run profits
(again, defined as the difference between the total revenues earned from selling power in the market and the
variable costs from generating power). Potential new generators then determine whether they should enter
a market based on the expectation of the short-run profits the generation could earn in the market. If the
short-run profits are high enough to cover the fixed cost of investment in new capacity then new generation
will enter the market and add to the resources that can be dispatched.
The positive and negative symbols in Figure 1 indicate whether each step reinforces or dampens the
next step. High prices, for instance, lead to an increase in short-run profits (positive), which increases the
incentives to invest in new generation (positive) and can increase the amount of resources available in the
market (positive). An increase in the amount of resources in a market, however, will decrease the prices in
that market (negative). Overall, this feedback loop tends to be stable, meaning that it will push investments
and prices to an equilibrium point where there is no economic motivation for additional new investments and
no generator would retire for economic reasons. It also indicates that long-run equilibrium prices depend in
part on the capital cost of investment options. The long-run impact of adding variable generation or any
other resource to a power market depends on the impact the resource has on market prices, the change in
the short-run profits for generators, and the change in investments because of the addition of the resource.
Additional details of the long-run modeling approach used in this report are provided in Section 3.
Economic
SHORT‐RUNPROFIT
(+)
()
Economic
valueof
resources
(+)
(
+
)
INVESTMENTPRICES
Valuation
Planning
Long Run
Integration
Operations
Short Run
Long
Run
FixedCosts
Adequacy
Short
Run
VariableCosts
Security
RESOURCES
Mixofresources
availableto
RESOURCES
()
balancesupply
anddemand
(
+
)
(‐)
Figure 1: Framework for evaluating long-run economic value (adapted from Stoft (2002)).
19
load data. These studies often highlight the importance of geographic diversity, changes in the value of vari-
able renewables between high and low penetration, changes in the long-run mix of conventional generation
due to increased variable renewables, and the lower economic value for wind than an energy-equivalent flat
block of power (Grubb, 1991; DeCarolis and Keith, 2006; Fripp, 2008; Lamont, 2008; de Miera et al., 2008;
Bushnell, 2010).
Instead of focusing on the long-run value of wind, Swider and Weber (2007) use a long-run model with
several “day types” (12 day types, each day with 12 time segments) to demonstrate the difference in total
system costs when wind is variable and unpredictable compared to the costs if wind were to have a flat
generation profile across the entire year. Somewhat unique amongst the studies that consider longer term
impacts, their model includes more of the detailed operational constraints that impact the dispatch of
thermal power plants. De Jonghe et al. (2011) compare the long- run investments that would be made in a
power system with increasing penetration of wind energy using a method that includes several operational
constraints for thermal generation to those investments that would be made if a more simple method that
uses traditional screening curves without operational constraints were applied. Though they do not include
uncertainty in wind generation in the analysis, they find that the inclusion of operational constraints in
investment decisions leads to more baseload capacity being replaced by flexible mid-load generation in
scenarios with significant wind.
Aside from these latter two studies, much of the existing literature on the economic value and opera-
tional integration of variable generation with increasing penetration tends to either (1) focus on longer term
value but lack high temporal resolution and/or consideration of the operational constraints of conventional
resources in the power system or (2) have high temporal resolution and pay significant attention to opera-
tional constraints but assume a static mix of conventional generation even at high penetration levels thereby
focusing on short-run impacts and ignoring long-run dynamics.
3 Methodology
This report seeks to bridge the divide in the literature by incorporating hourly generation and load profiles,
unpredictability of variable generation and some of the important limitations of conventional thermal gen-
erators including part-load inefficiencies, minimum generation limits, ramp-rate limits, and start-up costs.
This detail is then used to calculate the long-run value of wind, PV, and CSP generation with increasing
penetration levels considering long-run dynamics of retirements and new investment decisions. While the
limitations of many of the earlier studies do not necessarily take away from the importance of their find-
ings, including both operational constraints and hourly time resolution in a long-run analysis framework
allows concerns about the uncertainty of variable generation and the limitations of thermal plant flexibility
for managing variability and uncertainty to be more directly addressed in the estimations of the long-run
economic value of variable generation.
The marginal economic value evaluated in this analysis is based on the avoided costs from conventional
generators including avoided fuel costs, start-up costs, O&M costs, and capital investment costs for an
additional increment of VG from a particular VG penetration level. In calculating the marginal economic
value, factors such as the ability of variable generation to reduce investment in conventional generation
capacity, the ability of VG to reduce consumption of different fuels at different times depending on current
system conditions, the impact of day-ahead forecast errors from VG, and the need to increase ancillary
services are all addressed to varying degrees. The new investment options in non-VG resources include CTs,
CCGTs, coal, nuclear, and pumped hydro storage.
The analysis does not consider many other costs and impacts that may be important in some cases. The
costs and impacts that are not considered in this analysis include environmental impacts, transmission and
distribution costs or benefits, effects related to the lumpiness and irreversibility of investment decisions, and
uncertainty in future fuel and investment capital costs. Similarly, the present analysis does not consider the
investment cost in VG resources. These costs and factors are excluded in order to provide clarity in the
drivers of the results of this analysis and to avoid the results being driven by specific local factors such as
distribution system design or time lags in transmission investments. Of course, actual investment and policy
20
decisions might reasonably consider these and other elements as well.
In each of the scenarios considered in this analysis, one VG technology is increased from a base case
with almost no VG (the 0% case)
9
to increasingly high penetration levels measured on an energy basis. The
amount of VG included in each case is defined by the scenario and is not a result of an economic optimization.
In other words, the VG is “forced in” to the market without consideration of the investment or operating
cost of the VG. The scenarios are set up in this way to observe how the marginal economic value of VG,
as narrowly defined in this report, changes with increasing penetration across a wide range of penetration
levels. The results provide a survey of the potential range of the marginal economic value of different VG
technologies and how it changes with increasing penetration. As is described in Section 4.1, the generation
profiles with increasing penetration to some degree capture the impact of geographic diversity by aggregating
additional sites with unique generation profiles. No scaling of variable generation profiles was used to model
higher penetration levels.
In this analysis the penetration of VG is increased for only one VG technology at a time. Combinations
of VG technologies, like wind and PV or PV and CSP with thermal storage, are not considered here.
Combinations of VG technologies will be addressed in a future paper as a form of “technological diversity”
that might stem the decrease in the economic value of VG at high penetration when only one technology is
deployed along with other strategies such as price responsive demand, more flexible thermal generation, and
low-cost bulk-power storage.
The high penetration cases include solar penetration levels that approach 30% of electricity. In the case of
wind energy it was decided to push the penetration even higher to just over 40% on an energy basis due to the
relatively smaller change in the marginal economic value of wind between 10% and 30% penetration relative
to solar, as will be described in the later sections.
10
There were no fundamental barriers that prevented
further increases in the penetration level beyond the levels examined here, although, as is shown later, VG
curtailment and decreased marginal economic value at high penetration reduce the incentives for increasing
penetration to higher levels.
The marginal economic value derived from each of these cases can be interpreted as the maximum
marginal investment and fixed O&M cost that a VG technology would need to have to justify additional
investment beyond the amount of VG considered in the case. In a case where the marginal value of VG is,
for instance, $70/MWh at 10% penetration then the marginal investment and fixed O&M cost of the VG
would need to be below $70/MWh to economically justify investment in additional VG. This interpretation,
of course, ignores the many factors that are excluded from this analysis that could change the absolute level
of the marginal value. The relative changes from low penetration to high penetration and the comparisons
across VG technologies are therefore the more relevant indicators of the drivers of the marginal economic
value rather than the absolute magnitudes.
California is chosen for this particular case study as an example of the application of the model and
framework used to estimate marginal economic value of VG with increasing penetration, though this study
is not designed or intended to exactly mimic all of the laws, policies, and various other factors that impact the
electricity market in California. That being said, California is chosen due to the recent aggressive Renewables
Portfolio Standard (RPS) of 33% by 2020 that was signed into law
11
and the diversity of renewable resources
that are actively being considered in renewable procurement in the state, including wind, PV, CSP with
and without thermal energy storage (TES), and some geothermal and biomass. Decisions that renewable
project developers, utilities, regulators, and system operators are making or will need to make in the near
future somewhat depend on the relative cost and benefits of these different renewable resources. Of particular
9
Every case includes at least 100 MW of wind, PV, and CSP in order to observe how the value of these technologies change
when the value of the other VG is increased to high penetration levels.
10
Note that the exact penetration level used to describe each of the cases varies from the case title. For example, the actual
penetration of PV in the “30% PV” case is 31.5%. The reason for the discrepancy is differences between the amount of annual
energy production across individual renewable energy project sites that are aggregated to create the overall VG generation
profile relative to the estimated amount of energy that would be generated by a typical site. The number of sites used to
generate the profiles for the different penetration levels was based on typical estimates of annual energy production rather than
site specific estimates. As a result the number of sites used in the “30% PV” case slightly exceeded the number of sites that
were needed to generate exactly 30% of the annual electricity in the study year.
11
/>21
importance has been the recent rapid decline in the cost of photovoltaics (Barbose et al., 2011). In California
this reduction in PV costs, among other factors, has led to a number of proposed renewable projects shifting
from CSP technology (often based on solar trough or parabolic dish technology) to PV as well as the addition
of thermal energy storage to some proposed CSP plants in order to boost their value to the power system.
Wind resources located in and out of California will also continue to compete with these solar technologies
in renewable procurement decisions. It is therefore important to quantitatively understand how the benefits,
including the economic value, compare across technologies and change with increasing penetration. Similar
questions regarding the relative economic value of renewable resources occur in many different regions, but
the marginal economic value of VG with increasing penetration may vary to some degree depending on the
characteristics of the conventional generation, VG resources, and electric loads.
The remainder of this section summarises the framework and model that is used to estimate the marginal
economic value of VG with increasing penetration, considering both long-run retirement of and investment
in non-VG generation resources as well as commitment and dispatch decisions that occur during operations
while accounting for the constraints that limit dispatch of conventional plants. The section first describes
how power plants are committed and dispatched in the model, and then describes how the decision to invest
in new non-renewable power plants is made. The method used for calculating the capacity credit of the VG
based on the change in total investments in new power plants is also described. The marginal economic value
of VG can then be calculated based on the dispatch results (i.e., wholesale power and ancillary service prices)
from the non-VG power plant investments that were previously found to lead to a market equilibrium in the
year 2030. The model itself is formulated for the purpose of this analysis in the mathematical programming
language called AMPL and is solved using the IBM ILOG CPLEX Optimizer. Additional details of the
model can be found starting in Appendix A.
3.1 Dispatch
The commitment and dispatch portion of the model used in this analysis (called the dispatch model) de-
termines schedules and dispatch for thermal generation, hydropower, pumped hydro storage, variable gen-
eration, and load using hourly data over a full year. The dispatch decisions are co-optimized with decisions
regarding which resources will provide ancillary services to meet reserve targets in each hour. The ancil-
lary service requirements include non-spinning, spinning, and regulation reserves which are differentiated
primarily by whether or not a resource must be online in order to provide reserves and by the time by which
the reserve must be able to be fully deployed. The thermal generation constraints and parameters include
variable O&M costs, the cost of fuel consumed just to have the plant online (called the no-load cost), the
marginal variable fuel cost associated with producing energy, start-up costs, limits on how much generation
can ramp from one hour to the next, and the minimum generation limit for online generation. The source
of the numerical values used for these parameters is discussed later in Section 4. Hydropower is limited
based on a monthly hydropower generation budget and an hourly minimum generation limit. Pumped hy-
dro storage is limited by the capacity of the storage converter and by the reservoir capacity. All variable
generation is assumed to be able to provide regulation-down, but CSP
6
is the only VG technology that can
provide regulation-up and spinning reserves. Transmission constraints are not included in the dispatch and
commitment decisions.
12
The dispatch model focuses on two primary time horizons, the day-ahead (DA) and real-time (RT). These
two time horizons correspond to the market time-lines used in many of the organized markets in the United
States, including the California Independent System Operator (CAISO).
In the DA process used in this model, forecasts of output from variable generation are used to determine
schedules for all generation that will maximize social welfare (consumer surplus plus supplier surplus) based
12
There is nothing inherent in this framework that requires transmission constraints to be excluded from the dispatch and
commitment model. With a more detailed dispatch model transmission constraints could explicitly be modeled. In the long-
run, however, transmission investments can also be made which would require including transmission investment options and
decisions regarding where to site new generation investment. These decisions are possible to include in the investment model
but would begin to rapidly increase the complexity of the model. For this pilot case study of California options relating to
transmission were ignored.
22