Rwanda Economic Update: SEEDS FOR HIGHER GROWTH doc
Bạn đang xem bản rút gọn của tài liệu. Xem và tải ngay bản đầy đủ của tài liệu tại đây (1.97 MB, 37 trang )
SEEDS FOR HIGHER GROWTH
Spring Edition
April 2011
The World Bank
Rwanda Economic Update
PREFACE
The Rwanda Economic Update reports and synthesizes key economic developments in the past
six months in Rwanda’s economy. It places them in a medium-term and regional context, and
will increasingly assess the implications of these developments and policies for the outlook of
Rwanda’s economy. The Update will cover in each edition a special feature on a selected topic.
It is intended for a wide audience, including policy makers, business leaders and other market
participants, and the community of analysts engaged in Rwanda’s economy.
The Rwanda Economic Update was prepared and compiled by the Poverty Reduction and
Economic Management team at the World Bank Country Office in Rwanda, under the
leadership of Birgit Hansl, Senior Economist: Peace Aimee Niyibizi (economic update section),
Loraine Ronchi and Valens Mwumvaneza (agriculture section). The report also benefited from
guidance and advice provided from Wolfgang Fengler, Lead Economist, Kathie L. Krumm, Sector
Manager and Omowunmi Ladipo, Country Manager. In addition, the report benefited from peer
reviewer inputs by Stephen Mink, Lead Economist and Anton Dobronogov, Senior Economist.
For more World Bank information on Rwanda:
For more information about the World Bank and its activities in Rwanda, please visit:
www.worldbank.org/rw
If you would like to be included into the email distribution list for this semi-annual series and
related publications, please contact For questions and comments
relating to this publication, please contact
iii | P a g e
ACRONYMS
BNR
Banque Nationale du Rwanda (Central Bank of Rwanda)
CAADP
Comprehensive Africa Agriculture Development Programme
CIP
Crop Intensification Program
COMESA
Common Market for Eastern and Southern Africa
CPI
Consumer Price Index
DRC
Democratic Republic of Congo
EAC
East African Community
EDPRS
Economic Development and Poverty Reduction Strategy
FWC
Fully Washed Coffee
GDP
Gross Domestic Product
ha
hectare
kcal
kilocalorie
kg
kilogram
LWH
Land Husbandry, Water Harvesting and Hillside Irrigation
NAP
National Agricultural Policy
NISR
National Institute of Statistics of Rwanda
PSTA
Strategic Plan for Transformation of Agriculture
Rwf
Rwandan Franc
RDA
Recommended Dietary Allowance
SSA
Sub-Saharan Africa
USAID
United States Agency for International Development
WDI
World Development Indicator
iv | P a g e
TABLE OF CONTENT
Preface ii
Acronyms iii
Table of content iv
List of figures v
List of Boxes v
List of tables v
Executive Summary vi
Part 1: Seeds for Higher Growth 1
1.1 Agriculure’s Strategic role 1
1.2 Agriculture Growth And Productivity 3
1.3 Food Crops and Food Security 4
1.3.1 Food Crops 4
1.3.2 Food Security 5
1.4 Export Crops 7
1.4.1 Horticulture 7
1.4.2 Tea 8
1.4.3 Coffee 9
1.5 Seeds for Growth 10
1.5.1 Soil Fertility and Erosion Issues 10
1.5.2 Irrigation Needs 11
1.5.3 Post Harvest Management 12
1.5.4 Access to Financial Services 12
Part 2: Recent Economic DevelopmentS 13
2.1. Real Sector Trends 13
2.2. Price Trends 15
2.3. Fiscal trends 16
2.4. External Sector Trends 19
2.5. Exchange Rate Trends 21
2.6. Monetary Policy and Credit Trends 22
Data Sources and References 24
Annex 1: Growth Trends in Foods Crops (2004-2010) 25
Annex 2. Gross Domestic Product by Activity at constant 2006 prices (Rwf billion) 27
Annex 3. Government Priority Areas of Spending 28
v | P a g e
LIST OF FIGURES
Figure 1. GDP Growth by Sector (Percent) vi
Figure 2. Rwanda’s Real Growth Compared to EAC and SSA (Percent) vii
Figure 3. GDP Composition (Percent) 3
Figure 4. Agricultural Productivity Trends in Rwanda 4
Figure 5. Growth and Productivity Comparison 4
Figure 6. Food Availability Indicators in Rwanda 6
Figure 7. Tea Export Values and Prices 8
Figure 8. Coffee Export Values and Prices 9
Figure 9. Growth in the Agriculture Sector (Percent) 14
Figure 10. Growth in the Services Sector (Percent) 15
Figure 11. Growth in the Industry Sector (Percent) 15
Figure 12. Inflation Trends 2007-2010 16
Figure 13. Domestic Fuel Price Trends in 2010 (Rwf) 16
Figure 14. Average Price of Rwanda Coffee, 2010 (US$) 19
Figure 15. External Developments (Percent of GPD) 21
Figure 16. Nominal Exchange Rate of Major Currencies, end March=100 22
Figure 17. Lending and Deposit Rates (Percent) 22
Figure 18. Money Market Operations (Billion of Rwf) 23
LIST OF BOXES
Box 1: CIP and Growth in Food Crops 5
Box 2: Coffee Production Cycle 10
LIST OF TABLES
Table 1. Employment Trends (Percent) 2
Table 2. Imports of Food Products (Percent) 7
Table 3. Insurance Activities in Rwanda (Billion of Rwf) 14
Table 4. Government Budget 2009/10 and 2010/11 (Billion of Rwf) 17
Table 5. Main Export Products (US$ Million) 19
Table 6. Informal Cross Border Trade (Million US$) 20
Table 7. Evolution of Imports by Economic Classification, Value in Million of US$ and Volume in Tons 20
Table 8. National Park Activities 21
Table 9. Variations of EAC Currencies/Rwandan Franc (+Appreciation/-Depreciation) in 2010 22
Table 10: Compound Growth in Food crops (Percent) 25
vi | P a g e
EXECUTIVE SUMMARY
The current edition of the Rwanda Economic
Update is titled Seeds for Higher Growth and
specially features the agriculture sector. The
importance of agriculture’s contribution to
growth in Rwanda remains considerable,
despite the emergence of other significant
growth drivers, such as services. Rwanda’s
agriculture sector will play an essential role
in attaining the country’s development
vision of sustainable growth and increased
poverty reduction, due to its employment
weight. The agriculture feature of this
Update edition outlines key channels
through which agriculture contributes to the
economy. The second part of the Update
provides the regular overview of recent
macroeconomic developments. While the
special feature on agriculture will analyze
the evolving role of the sector over the past
five years, the second part on recent
economic developments will focus on events
during 2010.
The vision of Rwanda is to transform itself
from a subsistence agricultural to a
knowledge-based economy by 2020. The
achievement of this vision will require an
intensification and market-orientation of
agriculture on the one hand and a
diversification of the economy through a
proliferation of non-agricultural sectors on
the other hand. This brief assesses progress
by Rwanda on both fronts.
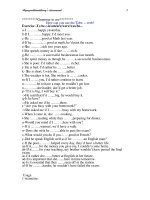
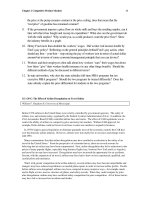
Agriculture is one of two key growth
engines for Rwanda. The agricultural sector
grew at an average of 4.9 percent over the
last five years (Figure 1), contributing about
36.0 percent to the overall Gross Domestic
Product (GDP). The sector occupies 79.5
percent of the labor force and generates
more than 45.0 percent of the country’s
export revenues. The services sector
established itself as a second growth engine,
registering double digit growth between
2004 and 2008-albeit from a very low base
before being affected by the global
slowdown. In recent years, services
marginally surpassed agriculture as the main
contributor to GDP.
Figure 1. GDP Growth by Sector (Percent)
Source: National Institute of Statistics of Rwanda (NISR)
Agriculture expenditure forms one of the
priority expenditures of the Government of
Rwanda’s annual budget with focus on
increasing productivity in the sector. Over
the past three years, allocations to the
agricultural sector have increased from 4.2
percent of the budget in 2008 to 6.6 percent
in the 2010/11 budget. Together with
agricultural related spending allocated to
other institutions, Rwanda now complies
with the 10 percent commitment made
3.0%
2.7%
6.4%
7.7%
4.9%
11.3%
9.1%
15.1%
1.4%
8.4%
13.4%
12.3%
14.7%
5.8%
9.6%
0.0%
4.0%
8.0%
12.0%
0%
20%
40%
60%
80%
100%
2006
2007
2008
2009
2010
Agriculture
Industry
Services
GDP (Right scale)
vii | P a g e
under the Africa Union’s Comprehensive
African Agriculture Development Program
(CAADP) compact, of which Rwanda was the
first signatory. The main recipient of the
agriculture budget shares were the
Government’s flagship programs, such as the
Crop Intensification Program (CIP) and the
Land Husbandry, Water Harvesting and
Hillside Irrigation (LWH) Project, the latter
being also supported with donor funds.
The strategic focus on agriculture, through
continued public investments, has
contributed to marked productivity
increases and solid agriculture growth rates
over recent years. However, in order to
sustain these productivity increases in the
future, and in order to fully realize the
growth potential for the agriculture sector, a
number of challenges would need to be
addressed. These challenges include the
need to stronger focus on: (i) Reducing
dependency on rain-fed agriculture through
greater use of different models of irrigation;
(ii) Better erosion control and integrated soil
fertility management; (iii) Diversifying
agriculture production, in particular
agricultural export goods, for example in
areas of horticulture and flowers, (iv)
Changing the skills profile of people
employed in agriculture, to foster the
creation of increased agricultural off-farm
employment such as agro-processing and
other value chain activities, and (v)
Developing a market-based food crop
distribution system to contribute to country-
wide food security. Continued agriculture
growth through the channels outlined above
will benefit agriculture growth and increase
food security, but most of all will sow the
seeds for higher overall economic activity.
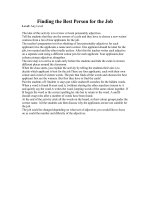
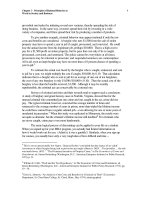
Overall, Rwanda’s economy is growing at a
healthy rate, 7.5 percent in 2010, two
percent higher than the East African
Community (EAC) and even more than Sub
Saharan Africa (SSA) (Figure 2). During 2010
the services and industrial sectors
progressed in their growth recovery, while
growth in the agricultural sector slowed
down marginally.
Figure 2. Rwanda’s Real Growth Compared to EAC and SSA
(Percent)
Source: World Development Indicator (WDI) and
International Monetary Fund
The country’s macroeconomic framework
was remarkably stable, given the difficult
external post-crisis environment and
Rwanda’s position as a highly import-
dependent land-locked country. This was
mainly achieved through a prudent fiscal
stance with strong focus on priority
expenditures, assisted by continued high
grant financing from donors. Government
followed a large public investment program
on a number of key strategic projects, all in
the infrastructure sector. But to date this is
largely financed with domestic revenues and
debt remains at manageable levels. Inflation
0.0
4.0
8.0
12.0
viii | P a g e
declined. The external sector benefited from
the recovery in international prices for
Rwanda’s key export goods, tea and coffee.
Tourism receipts recovered fully in 2010 and
reported record levels of non African tourist
arrivals. As a result the trade deficit
narrowed and reserves remained at
comfortable levels.
Rwanda made great progress in deepening
reforms, especially those designed to
improve the business environment to
support a private sector led development
model. The Doing Business 2011 report
included Rwanda in the list of the ten most-
improved economies. Despite Rwanda’s
success in having established a sound
investment climate foreign direct
investments remain at low levels. The
private sector is still nascent and would
profit much from access to technological
know-how and established distribution
channels abroad. Rwanda’s urbanization is
slowing down, despite high population
density. The major binding constraints to
accelerated growth, investments and
exports are the lack of economic
infrastructure and the limited skills base.
Rwanda is attributing high importance to
increased regional integration and is already
benefitting from the positive growth
momentum in East Africa. In comparison to
its East African peers, Rwanda fairs well and
confidently leads in growth terms. But large
growth potentials remain to be exploited,
such as benefitting from regional power
trade. Rwanda completed its alignment with
the budget calendar of the EAC, resulting in
a switch to the July-June fiscal year from
calendar year.
1
On July 1, 2010 the EAC
Common Market became effective, and
Rwanda implemented the EAC Common
External Tariff Framework. This reduced
revenues from trade taxes, but
reimbursement for these losses was
received from the Common Market of
Eastern and Southern Africa (COMESA).
The outlook for a full recovery of Rwanda’s
economy during 2011 is cautiously
optimistic. Rwanda’s projected growth rate
for 2011 is 7.0 percent, significantly higher
than the 5.5 percent predicted for SSA or the
5.9 percent predicted for the EAC. It is
expected that all sectors are likely to grow at
comparable pre-crisis levels again, but there
is reason for a cautious positive outlook. The
first 2011 harvest season was disappointing,
and agriculture growth might turn out to be
moderate. Services growth might be less
rapidly, as previously driving Government
spending for health, education and other
services is returning to pre-crisis levels.
Manufacturing remains in the mist of
recovery. Lead indicators for growth, like
credit to the private sector, performed in
2010 less well than expected, as was growth
in the construction sub-sector. Interest rates
remain high. The outlook also remains
dependant on effects of yet again increasing
international fuel and food prices. The
balance of payment continues to be
vulnerable to export shocks, due to the
dependence on a few export products.
1
Following a six-month mini budget in 2009, fiscal year 2009/10
was the first full fiscal year under the new budget calendar.
1 | P a g e
PART 1: SEEDS FOR HIGHER GROWTH
This feature outlines key channels through which agriculture contributes to the current
economy. Agriculture is at the heart of Rwanda’s economy. The sector occupies 79.5 percent of
the labor force, contributes one-third of GDP and generates more than 45.0 percent of the
country’s export revenues. Agriculture is also important for national food self-sufficiency,
accounting for well over 90.0 percent of all food consumed in the country. This part also
identifies challenges and a number of policies that address those challenges. The latter
represent important seeds for future agriculture and overall growth. In order to adequately
reflect trends this part will present, wherever possible, data for the past five years, 2006-2011.
Source: World Bank Archives Rwanda
1.1 AGRICULURE’S STRATEGIC ROLE
The agriculture sector
2
will play a key role
in realizing Rwanda’s vision of transforming
the country’s economy by 2020. Given its
predominant role in the economy,
agriculture is considered as a main catalyst
for sustainable growth and poverty
reduction. This is fundamentally linked to
2
When reference to agriculture is made in this document, it
includes production and its upstream (e.g. input provision)
and downstream (e.g. agro processing, trading, and
exporting) linkages.
the fact that agriculture is the primary
source of employment in Rwanda. In 2006,
more than two-thirds of the entire working
population, and 86.5 percent of rural
population, was employed in the agriculture
sector (Table 1). The achievement of
Rwanda’s growth and poverty reduction
targets will require to a large extend a rapid
intensification and increased market-
orientation of the agriculture sector.
2 | P a g e
Table 1. Employment Trends (Percent)
Source: NISR
Increasing agricultural productivity will
enable the sector to move from subsistence
to a commercial mode of production, while
ensuring food security and progressively
contributing to the creation of linkages to
other sectors.
In the short to medium term, off-farm
employment within the sector will need to
become an alternative source of rural
income. This includes areas such as agro-
processing packaging, storage, transport,
crops and input trade. Between 2001 and
2006But the share of waged workers
increased –doubling to 8.2 percent of all
agricultural jobs.
3
This might be an early
indicator for a trend away from subsistence
farming to other off-farm agricultural
employment. But major obstacles remain,
largely related to the low levels of skills
which limit productive opportunities outside
of agriculture.
Export crops are key contributors to
agriculture growth, but need to diversify in
the future. With the goal of stimulating
growth and increasing foreign exchange
3
Non waged farmers are subsistence and unpaid farmers.
earnings, there is a need of diversifying
commercial agriculture away from its
current heavy reliance on coffee and tea. For
this, increased efforts are needed to actively
invest in non-traditional export crops, for
example, horticultural crops such as fruits,
vegetables, and cut flowers; essential oils
such as petunia and geranium; macadamia
nuts; vanilla; and silk, and the production
infrastructure required for this.
In recent years a framework was set up for
the modernization of agriculture in
Rwanda. In 2004, a National Agricultural
Policy (NAP) was formulated and a Strategic
Plan for Agricultural Transformation (PSTA)
was developed and updated in 2009. The
updated PSTA II became the basis of the first
CAADP-approved Agricultural Sector
Investment Plan in Africa. In the
implementation of these frameworks,
programs were put in place, such as the
Crop Intensification Program, the One Cow
per Poor Family (GIRINKA program) and
later, the LWH Program. To date, results are
noticeable in terms of sustained agricultural
growth and increased productivity, as well as
improved land management.
Ensuring food security of the population is a
key aim of the Government’s Economic and
Development and Poverty Reduction
Strategy (EDPRS), alongside with raising
agricultural productivity. In this context,
basic food crop production is projected to
rise by 15 percent over the EDPRS period
and the average energy intake is projected
to increase from 1,734 kilocalories (kcals) to
2,100 kcals per person/day. It is expected
2000 2006
Employment by sector
Agriculture
89.5 79.5
Manufacturing
1.7 3.3
Services
8.7 17.2
Characteristics of agricultural employment
Waged farmers
3.7 8.2
Non-waged farmers
84.9 71.3
Subsistence farmers
35.8 31.6
Unpaid farm workers
49.1 39.7
% of working population
% of working population
3 | P a g e
that an increased and diversified household
income will significantly reduce rural poverty
and enhance the level of food security in
Rwanda.
1.2 AGRICULTURE GROWTH AND
PRODUCTIVITY
Agriculture constitutes the second biggest
component of GDP with 36.0 percent. But
only as recent as 2005 agriculture was the
main GDP contributor. The retreating
agriculture share was absorbed by the
services sector, while the industry sector
stagnated at around 13.9 percent of GDP
(Figure 3). However, agriculture remains the
main employer, especially of the poorer and
less educated segments of the population.
Figure 3. GDP Composition (Percent)
Source: NISR
Real agriculture growth averaged 4.9
percent between 2006 and 2010. During
this period the sector started to benefit from
large investments in fertilizers, improved
seeds and extension services through the
CIP. Being by nature highly dependent on
weather conditions, favorable climate during
2008 and 2009 also contributed to strong
growth. In 2009, agriculture growth reached
a record of 7.7 percent, surpassing all other
sectors. This reflects the continued
importance and dynamism of the sector. For
2010, agriculture growth stood at 4.6
percent.
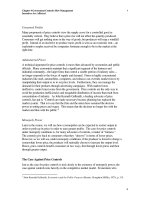
Agricultural productivity increased steadily
in the past decade (Figure 4). Land
productivity (agricultural valued
added/cultivated land in ha, henceforth ha)
increased dramatically in Rwanda. Indeed,
the country is leading compared to other
African countries with similar GDP shares of
agriculture (Figure 5).
4
The relatively high
level of land productivity reflects the
favorable agro-climatic potential resulting in
two harvest seasons, as well as the intensive
nature of the predominant agricultural
production systems.
5
In contrast, labor
productivity remains low compared to these
countries, albeit it increased over the last
decade. This is related to the fact that
Rwanda has the highest proportion of rural
population, most of them engaged in labor
intensive agriculture.
6
It appears that most
opportunities for future productivity gains
lay in the area of making agricultural
production less labor intensive, or in other
words less subsistence based.
4
For selected countries, Ivory Coast, Ghana, Kenya, Mali,
Mozambique, Rwanda, Uganda, Tanzania and Zambia,
agricultural GDP share was varying between 20 percent and
40 percent in 2007 (World Development Indicator - WDI
database).
5
World Bank. (2007). Promoting Pro Poor Agricultural
Growth in Rwanda: Challenges and Opportunities.
6
World Bank. (2008). World Development Report:
Agriculture for Development. Washington DC.
38.4
36.6
34.9
35.5
34.6
43.0
13.8
13.9
14.4
13.8
13.9
12.7
42.0
43.8
45.0
44.9
45.8
38.0
5.8
5.7
5.7
5.9
5.7
6.2
0% 20% 40% 60% 80% 100%
2006
2007
2008
2009
2010
2001-
2005
Agriculture
Industry
Services
Adjustments
4 | P a g e
Figure 4. Agricultural Productivity Trends in Rwanda
Source: WDI Database
1.3 FOOD CROPS AND FOOD SECURITY
1.3.1 FOOD CROPS
Food crops constitute 84.0 percent of
agriculture GDP, or 30.3 percent of overall
GDP.
Over the past five years, they
registered an average growth of 5.2 percent.
Food crops also dominate the cultivable land
with almost 67.1 percent (NISR 2010),
reflecting the subsistence nature of
Rwandan agriculture.
7
Since the formulation
of the NAP, the cultivated area increased by
only 2.0 percent from 2004 to 2010, while
food crop output registered an average
growth of 7.0 percent per year (see Annex
1).
8
This reflects good productivity growth
through intensification (rather than
environmentally unsustainable
extensification), which is desirable to
continue.
7
Roots and tubers constitute the largest share of food
crops’ harvest (51.2 percent) followed by bananas (27.1
percent), fruits and vegetables (10.1 percent), cereals (7.3
percent), and pulses including beans and peas (4.3
percent).
8
Even more dramatically, since 2007 output reported a
12.7 percent increase, on average, while the cultivated area
increased by 2.7 percent.
Figure 5. Growth and Productivity Comparison
In comparison to other African countries Rwanda’s
agricultural growth is high…
… as is land productivity…
… but labor productivity remains low.
Source: WDI Database
0.0
100.0
200.0
300.0
400.0
500.0
600.0
700.0
800.0
0.0
400.0
800.0
1,200.0
1,600.0
Rwanda, Current US$
Agric. VA (million)
Agric., VA/worker -Right Scale
Agric., VA/ha-Right Scale
0.0
4.0
8.0
12.0
Average Growth in Percent
2000-2005
2006-2009
0.0
200.0
400.0
600.0
800.0
Land productivity (US$/ha)
2000
2004
2008
0.0
300.0
600.0
900.0
Labor productivity
Constant 2000 US$/Active worker
2000
2004
2008
5 | P a g e
Strong growth in food crop production can
be partly attributed to the CIP (Box 1).
Complementary investments in marshland
irrigation, integrated soil fertility
management, farmer field schools have also
played a role, as well as favorable weather
conditions. The followings are some of key
accomplishments under the CIP: (i) the
increased use of improved seeds for maize
(by 61.8 percent), wheat (by 46.3 percent)
and Irish potato (by 16.3 percent); (ii) the
national average in use of fertilizer doubled
from 8.5kilogram (kg) per ha in 2006 to
around 16.0kg per ha in 2010,
9
and (iii) the
area under land use consolidation increased
nine folds from 28,000 ha in the first season
of 2008 to 254,448 ha in the first season of
2010.
Box 1: CIP and Growth in Food Crops
Source: Ministry of Agriculture
In 2007, Government embarked on the CIP with the main
objective to develop sustainable crop productivity through the
increased use of modern inputs, particularly seeds and fertilizer,
agricultural technologies and the consolidation of land. The use of
improved inputs by farmers could only be translated into profit by
mitigating land fragmentation, addressed through the land use
consolidation component. With substantial production gains
recorded for maize, rice, Irish potato and wheat, other food crops:
beans, banana, soya, peas and cassava, were added in the first
season of 2010.
9
These figures were computed based on figures from the
Common Performance Assessment Framework (mineral
fertilized used in tons) and the cultivated area (Ministry of
Agriculture, crop production files).
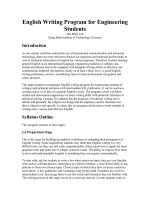
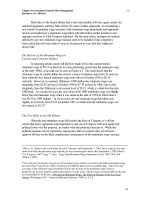
1.3.2 FOOD SECURITY
Increased food crop production led to
improved food availability. Rwanda’s food
balance sheet has been improving as the
country became self sufficient in 2009
(Figure 6a). There is also a continued
increase in terms of dietary allowances as
recommended by the Food and Agriculture
Organization. Overall, Rwanda experienced
an upward trend in availability of energy
(kcals/capita/day) since 2008, but with
disparities across provinces and over
seasons. Considering the stark regional
differences in food availability and food
security (Figure 6b), connected to
seasonality, it appears that a better market-
based food crop distribution system could
contribute significantly to country-wide food
security. Also, while substantial progress had
been made, World Health Organization
recommendations for proteins and lipid
availability are not yet being met (Figure 6c
and 6d). For example, the recommendation
for protein was met in 2009, but this could
not be sustained in 2010, when the country
faced a slightly lower harvest.
Better food availability was accompanied
with improved food and nutrition intake
across the country, despite regional
disparities. The results of the 2009
Comprehensive Food Security and
Vulnerability Analysis and Nutrition Survey
may reflect a trend towards better food
security. It found that 4.2 percent of
households had a low food consumption
score (compared to 6.7 percent in 2006),
17.4 percent had a borderline score (27.9
0.0
3,500.0
7,000.0
10,500.0
Annual yield
(,000 Tons)
Cereals:
15.3%
Roots &
tubers: 9.4%
Banana:
1.8%
Pulses:
10.2%
Vegetables &
fruits: 6.7%
CAGR
6 | P a g e
percent in 2006) and for 78.4 percent (65.4
percent in 2006), the score was acceptable.
The score is a composite score based on
dietary diversity, food frequency, and
relative nutritional importance of different
food groups and it is considered a good
proxy indicator for the access dimension of
food security and nutrition intake. The
Western Province was the most food
insecure province in 2009, followed by the
Southern Province.
Figure 6. Food Availability Indicators in Rwanda
1
6a The Food Balance Sheet recorded improvements.
6b Recommended Dietary Allowances (RDA) in terms of
energy were met since 2008. But disparities across
provinces and over seasons remain.
6c Nevertheless, RDA in terms of protein and …
6d … lipid are not being met countrywide yet.
Source: Ministry of Agriculture
2007B 2008A 2008B 2009A 2009B 2010A 2010B
I. AVAILABILITY =1+ 2+3+4 1,022.4 940.7 1,104.3 1,141.1 1,227.5 1,379.2 1,403.8
1. Stock 0.0 0.0 4.4 0.0 0.0 0.0 7.0
2. Crop production 1,022.4 1,161.6 1,208.3 1,406.2 1,345.1 1,529.1 1,467.5
2. Expected Crop production C n.a. n.a. n.a. n.a. n.a. n.a. 81.0
3. Animal production n.a. n.a. 72.9 na 84.2 79.5 80.6
4. Losses n.a. -220.8 -181.2 -265.0 -201.8 -229.4 -232.3
II. NEEDS = 5 1,123.5 1,121.2 1,156.0 1,153.7 1,189.6 1,228.1 1,245.6
5. Consumption 1,123.5 1,121.2 1,156.0 1,153.7 1,189.6 1,228.1 1,245.6
III. Balance/Deficit = I-II -101.1 -180.4 -51.7 -12.5 37.9 151.1 158.2
6. Imports 112.8 103.2 103.2 103.2 n.a. n.a. n.a.
7. Food aid 28.2 26.0 36.2 n.a. n.a. n.a. n.a.
IV. TOTAL = III + 6 + 7 39.9 -51.3 87.7 90.6 37.9 151.1 158.2
1,700
2,100
2,500
2,900
3,300
Kcals per capita per day
South
West
North
East
Countrywide
RDA
40.0
60.0
80.0
Protein per capita per day
South
West
North
East
Countrywide
RDA
0.0
15.0
30.0
45.0
Lipids per capita per day
South
West
North
East
Countrywide
7 | P a g e
At the same time, food imports, specifically
of rice and sugar, formed an increasing part
of overall imports (Table 2). In 2010 alone,
the value of food imports increased by 27.1
percent, accounting for 11.6 percent of total
import values and 36.1 percent of values of
consumer goods imports. This increase in
food imports is, however, not coinciding
with decreasing food security, as it
happened during successive good harvest
years. It appears to be rather related to a
shift in food consumption patterns, where
richer urban households increasingly
consume imported food products, such as
rice and sugar, while rural subsistence
households continue to consume traditional
staples, such as cassava and bananas.
Table 2. Imports of Food Products (Percent)
Source: Banque Nationale du Rwanda (BNR)
It is also noteworthy that food prices are
the most important driver of inflation in
Rwanda. Food consumption accounts for 35
percent of the total Consumer Price Index
(CPI) basket. Food prices declined during
2009 and 2010, following the height of the
global food crisis which impacted Rwanda
indirectly towards the end of 2008. From the
peak in food inflation of 30.9 percent in
December 2008, it declined persistently to
an average of 16.9 percent in 2009 and 1.8
percent in 2010. These trends reflect in
equal part local food market conditions and
price trends handed-through from world
food prices.
1.4 EXPORT CROPS
In the past five years export crops
contributed on average 48.1 percent to
Rwanda’s total export earnings. They
accounted during the same time for 1.1
percent of GDP. Coffee and tea are the
major export products, concentrating more
than 90.0 percent of the value of export
crops. While the Government started the
promotion of non-traditional export crops,
in order to stimulate growth and increase
foreign exchange earnings, the heavy
reliance on coffee and tea remained
unchanged to date.
1.4.1 HORTICULTURE
In an attempt to create a more-diversified
export sector, efforts are being made to
promote horticultural crops, including
fruits, vegetables, and cut flowers; essential
oils such as petunia and geranium;
macadamia nuts; vanilla; and silk. Given
favorable climate and soil conditions,
Rwanda has the potential to develop a
vibrant horticulture industry. High-value
export crops, such as passion fruit, desert
bananas, Japanese plums and Bird’s Eyes
Chilies could be produced by Rwanda and
are in high demand at the international
market. Other exotic fruits and vegetables
also have the potential to be grown in
Rwanda’s fertile and diverse terrain.
Volume Value FOB Volume Value FOB Volume Value FOB
CONSUMER GOODS 30.4 18.2 39.4 32.0
Food product 40.2 27.1 79.5 36.1 31.3 11.6
Meats and fish 41.9 56.1 1.5 1.0 0.6 0.3
Fats and oil of animal or plant origin
-4.0 -5.4 7.3 7.9 2.9 2.5
Vegetables, fruits and spices 10.0 43.7 6.1 1.3 2.4 0.4
Cereals, flours and seeds 78.4 33.7 42.9 11.2 16.9 3.6
Various food preparations -9.8 3.2 2.8 2.9 1.1 0.9
Salt 0.6 -12.9 7.8 0.8 3.1 0.3
Sugars and sweets 48.2 79.8 10.6 10.2 4.2 3.3
Imported products
Share of 2010
Consumer Goods
Share of 2010
Imports
2010 Growth
8 | P a g e
Overall, the production volume of
horticulture crops remains low as it is done
by groups of small-scale producers. Their
cooperative structures are yet unable to
establish the right incentives for addressing
the market expectations of producing at
high volumes with necessary quality
standards. As the production is capital
intensive, they also face challenges in
accessing the needed resources to sustain
the supply chain (input, production, post
harvest, processing and export).
Furthermore, Rwanda already experienced a
temporary ban on exports to the European
Union because of failure to comply with
phytosanitary standards.
Investments in horticulture did not
materialize yet as potential investors still
face a number of unresolved issues, such as
land shortage and inadequate infrastructure.
It appears that without more concerted
efforts to address investment challenges in
this promising export sector Rwanda is likely
to continue to depend on traditional export
crops of coffee and tea.
1.4.2 TEA
Rwanda produces one of the highest quality
teas in the world. In 2009 tea became
Rwanda’s main export by value, generating
US$48.2 million (and US$55.7 million in
2010). Total tea production increased on
average 14.0 percent per annum during
2006-2010. At the same time, tea exports by
volume nearly doubled, thanks to Rwanda
tea’s high quality. High quality is also the
reason for Rwanda tea regularly fetching
premium prices at the Mombasa auctions,
its main market destination. A significant
share of medium to high quality teas is sold
directly to retail stores in Europe.
Rwanda’s tea production and marketing
systems continue to be dominated by state-
owned companies. Tea is cultivated mainly
on large plantations, which are owned and
managed by about a dozen tea factories that
process green tea into black tea.
Approximately two-thirds of the tea
produced in Rwanda is grown on industrial
estates belonging to a state agency, OCIR
THE
10
and a few private investors. The
remaining one-third is grown by small-scale
private growers. Current tea plantations
total an area of 17,000 ha.
Figure 7. Tea Export Values and Prices
Source: BNR
Like the horticulture sector, the tea sector
faces difficulties in attracting investors that
could bring in new technologies and provide
access to established distribution chains. At
10
OCIR (Office des Cultures Industriels du Rwanda)-THE was
established by the Government to spearhead policy
development, regulation, promotion and smallholder
support in the sector.
1.0
2.0
3.0
0.0
20.0
40.0
60.0
USD/kg
Million USD
Export Values
Average Price, Right scale
9 | P a g e
the same time, there is a rapid increase in
demand for high quality and niche tea and
the global consumption of black tea is
quickly growing. It is in Rwanda’s interest to
further increase black tea production and to
diversify into higher value niches, such as
orthodox and green tea, aided by foreign
investments
1.4.3 COFFEE
Nowadays, Rwanda coffee is answering
growing demand for high quality bourbon
Arabica. In the 1990s, Rwandan coffee was
classed below Grade C, making it unsalable
on the global market and buyers paid
US$0.33 per kilogram. Rwanda coffee was
unknown in the specialty/high-value coffee
sector until in 2001 MARABA™ coffee
achieved high scores at international coffee
tasting competitions, placing it well above
the threshold level for a specialty coffee.
11
Since then, Rwanda coffee won praise by the
American and European specialty coffee
industry. Rwanda coffees have been
distributed in Europe (through Sainsbury’s in
the UK) and Starbuck’s in the US.
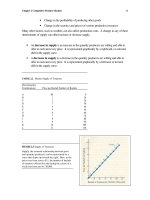
Rwanda coffee achieved record prices in
2010. Between 2006 and 2010 annual
average unit prices increased by 51.2
percent from US$2.03 to US$3.07 per
kilogram (Figure 8). This trend was mainly
driven by a growing share of fully washed
11
MARABA™ coffee is a bourbon variety of the Coffee
Arabica species which was processed by the first washing
station built at Maraba, in Southern Province in 2002. This
washing station was built with assistance from the
Partnership for Enhancing Agriculture in Rwanda through
Linkages, a project executed by Michigan State and Texas
A&M Universities.
coffee (FWC), owing to an increased number
of processing factories and washing stations,
(one in 2002, 74 in 2006 and 188 in 2010).
Whereas the FWC accounted for less than
one percent in 2002, it reached 12 percent
in 2006 and exceeded 20.0 percent of total
coffee production in 2010. However, that
share remains still far below the EDPRS
target of transforming 85.0 percent of coffee
production into FWC by 2012.
Figure 8. Coffee Export Values and Prices
Source: BNR
Production volatility threatens Rwanda’s
potential of becoming a key supplier of
high-quality coffee. First, volatility in coffee
production leads to the underutilization of
washing station capacity. Second, it also
contributes to insufficient levels of
production to attract global demand. This
makes Rwanda coffee invisible to the bulk
market. In 2009, washing stations utilized
only 43.0 percent of their capacity. At the
same time, Rwanda contributed less than
one percent to the worldwide exported
coffee. Rwanda’s coffee production needs to
be optimized by minimizing the oscillation of
the production cycle (Box 2).
2.0
2.5
3.0
3.5
0.0
20.0
40.0
60.0
US$/Kg
US$ million
Export Value
Average Price, Right Scale
10 | P a g e
Box 2: Coffee Production Cycle
Over the past decade, coffee exhibited large volatility in
production and foreign exchange earnings. Production also
remained below the levels of the early 1990s. Peaking at 26,291
tons in 2006, coffee production has been oscillating from year to
year, following a downward trend. Overall, coffee recorded a 27
percent drop in production from 2006 to 2010. This sharp
volatility is attributed to the natural coffee cycle: (i), the yield of
the coffee tree peaks after 5 to 7 years, and (ii) there is a 18 to
24 months lag between plantation and harvest. While the
investment response to price change is very quick, the output
response to investment is slow. As a result, the extra supply
might arrive on the market when prices are on the decline,
magnifying the downturn in the coffee cycle.
Source: OCIR-CAFÉ and BNR
Another challenge is linked to coffee quality
consistency and the need to better target
the high-value coffee market. Washing
stations must be more selective about the
coffee cherries they wash in order to
maintain and improve the overall quality of
Rwanda coffee. Fully washed low grade
cherries do not add any more value than
semi-washing the same cherries. Greater
coffee quality consistency would enable
companies to enter the specialty coffee
segment. This segment enjoy higher and
more stable prices, as compared to the
commercial coffee segment, which is to a
larger extend subject to global commodity
price swings.
1.5 SEEDS FOR GROWTH
In order to fully realize its strategic role, the
agriculture sector will need to address a
number of urgent challenges, including: (i)
preserving soil fertility and preventing soil
erosion, (ii) large irrigation needs, (iii) poor
post-harvest management, and (iv) limited
access to financial services. These could
impinge negatively on agricultural
productivity, despite the progress achieved
in recent years. Government, in partnership
with donors, started to put in place a series
of measures to deal with these challenges.
Most of these measures are being
undertaken under the second PSTA and they
truly represent seeds for higher future
agricultural and overall growth.
1.5.1 SOIL FERTILITY AND EROSION ISSUES
Heavy demographic pressure resulted in
many, very small and scattered farms. More
than 80.0 percent of households hold less
than 1.0 ha of land. This land is over-
cultivated, leading to the disappearance of
traditional techniques of soil fertility
regeneration such as fallowing practices. In
addition, the cultivation on slopes up to and
above 55 percent steep is unavoidable given
that 80 percent of arable land is on a slope
in Rwanda. Encroachment on marginal lands
on steeper slopes results in heavy erosion.
12
12
About 40.0 percent (800,000 ha.) of Rwanda’s land is
classified by the Food and Agriculture Organization as
having a very high erosion risk, 37.0 percent requires soil
retention measures before cultivation, and only 23.0
percent of the cultivated land is more or less free from risk
of erosion. Rwanda loses 1.4 million tons of soil per year,
80
100
120
140
160
180
Growth 2001=100
11 | P a g e
Government has started initiatives to reduce
soil erosion and restore soil fertility and
these are implemented through PSTA II.
Soil fertility
Under the CIP program, a land use
consolidation component encourages
farmers with adjacent land to grow the same
crop. This will enable farmers to make use of
economies of scale and increase access
quality inputs, such as improved seeds and
fertilizers. Government installed a fertilizer
voucher system for maize and wheat
farmers. After dealers deliver inputs to the
farmer at a predetermined subsidized price,
they are paid the subsidy on the agro-input
by microfinance institutions engaged by CIP.
In addition, the GIRINKA program will
increase the use of farm yard manure for soil
fertility improvement. Projects supported
both by the Dutch Government and United
States Agency for International
Development (USAID) support the Ministry
of Agriculture in these aspects, but many
Non-Governmental Organizations are also
active in this area such the One Acre Fund,
World Vision and Care International.
Soil erosion
Erosion control programs are being
aggressively applied, such as progressive or
radical terraces. For instance, the
Government’s LWH program, financed by
International Development Association and
other donors, uses a comprehensive
equivalent to a decline in the country’s capacity to feed
40,000 people per year (Republic of Rwanda, 2009)
watershed approach to prevent soil erosion
and improve productivity on hillsides
(thereby reducing the need to encroach on
marginal lands). Other programs aim at the
rehabilitation of hillsides; and Government’s
extensive radical terracing (agricultural and
social protection) program is covering now
large tracts of the country.
Source: Rural Sector Support Project Rwanda
1.5.2 IRRIGATION NEEDS
Rwandan agriculture is predominantly rain
fed. As a result, droughts, irregular rainfalls
and landslides, and climate change-related
phenomena are major concerns for its
productivity. Through PSTA II, Government is
focusing on providing irrigation to hillside
farms and on increasing the water retention
capacity of watersheds. There are a number
of projects funded jointly by the
Government and Developments Partners to
this effect: (i) the Rural Sector Support
Project (marshland irrigation); (ii) the LWH
Project; (iii) the Project d’Appui au
Développement Agricole de Bugesera; (iv)
the Kirehe Watershed and Agricultural
Management Project, (v) the Project to
Support PSTA II implementation, and (vi) the
Hillside Irrigation Project in Bugesera.
12 | P a g e
The Government has also initiated a number
of ambitious irrigation projects like the
Immediate Action Government Funded
Irrigation Project and the Gishwati Land and
Water Management Project. Recently, a
Task Force was established for Irrigation and
Mechanization resulting in a pledge to
increase the irrigated area both in the
marshland and on the hillside from 20,000
ha to 100,000 ha by the year 2017.
1.5.3 POST HARVEST MANAGEMENT
Poor post harvest management results in
the loss of up to 15 percent of total
production and poses a big challenge to
further productivity increases, if not
addressed. Government is supporting post-
harvest infrastructure through farmer and
cooperative investments in storage facilities,
drying grounds, as well as the procurement
of silos and grain stocks. These activities are
handled by the newly created Storage and
Post Harvest Task Force in the Ministry of
Agriculture. USAID is also supporting post
harvest development in the sector through
the Post Harvest Handling and Storage
Project.
1.5.4 ACCESS TO FINANCIAL SERVICES
The agriculture sector suffers from
insufficient access to finance and
insufficient investment capital for farming,
agro-processing and export development.
Low productivity and high vulnerability of
the agricultural sector make banks reluctant
to offer financial services to rural farmers,
largely due to lack of information on
profitability of value chain activities. The
banking system also imposes heavy
collateral requirements and poses
inappropriate lending conditions, such as
periodicity of repayment not linked to the
agricultural cycle. In 2010, the agricultural
sector received only 2.1 percent of total new
authorized loans.
Mechanisms to increase access to financial
services in the agriculture sector mostly
benefit the export and livestock subsectors.
Some of these mechanisms comprise the
Government Agricultural Guarantee Fund,
the World Bank’s Rural Investment Facility I
& II, and the Belgian Horticultural
Investment Fund and similar schemes are
embedded in various other projects.
However, they remain largely uncoordinated
and did not allow agricultural finance to take
root yet. In 2010, Department for
International Development’s Access to
Finance Rwanda Program established a
Company Limited by Guarantee to
coordinate efforts to deepen financial
literacy and financial access. The purpose is
to increase access to financial services for
poor rural and urban people, especially
women, and for Micro, Small and Medium
Enterprises. In March 2011, the Agricultural
Finance Support Facility launched a project
to support the Banque Populaire du Rwanda
in order to build its capacity for agricultural
finance, thus increasing access of
smallholder farmers to financial services.
13 | P a g e
PART 2: RECENT ECONOMIC DEVELOPMENTS
This part focuses on recent macroeconomic developments during 2010, the year after the
global economic crisis impacted the country most. Rwanda’s economy grew in 2010 at a
healthy 7.5 percent, two percent higher than the EAC. A prudent fiscal stance with strong focus
on priority expenditures, and assisted by continued high grant financing from donors,
contributed to the country’s remarkably stable macroeconomic framework in a difficult
external post-crisis environment. The outlook for a full recovery of Rwanda’s economy during
2011 is cautiously optimistic as some lead growth indicators, like credit to the private sector,
performed in 2010 less well than expected. The outlook also remains dependant on effects of
yet again increasing international fuel and food prices and the second harvest outcome.
Source: World Bank Archives Rwanda
2.1. REAL SECTOR TRENDS
Rwanda’s economic recovery continued
during 2010 at a high pace. As of December
2010, year to year GDP growth rates were
steadily increasing, but did not return to pre-
crisis 2008 levels yet. Nevertheless, the
overall growth outturn at 7.5 percent for
2010 is impressive. This growth was to a
large extend a result of a sizable fiscal
stimulus, increasing expenditures by around
3.0 percent of GDP between 2008 and
2009/10
13
to around 26.0 percent. This
stimulus was partly financed by an increase
in donor aid.
Economic growth was driven by services
and industry growth (Figure 1). Agriculture
sector growth slowed down to 4.6 percent,
despite price and volume increases for key
export crops and increased food crops
13
This included the revised 2008 budget at mid-term
review, 2009 and 2009/10 budgets.
14 | P a g e
production. By end 2010, the services sector
exhibited growth of 9.6 percent benefiting
from large public expenditures (education,
health and public administration services).
After being the most impacted sector by the
global downturn, the industrial sector grew
at 8.4 percent. But industry’s growth
remained below 2008 levels, in particular,
for the main subsector construction,
cautioning the economic outlook.
Overall sector trends in 2010 can be
summarized as follows:
Agriculture sector growth slowed down
to 4.6 percent (Figure 9) while food crops
production increased and export values
for crops increased, owing to high
international prices for Rwanda’s two
main export goods, coffee and tea.
Coffee production increased by 21.6
percent, benefitting from favorable
weather condition and increased use of
fertilizers. International coffee prices
remained stable, averaging US$3.08 per
kilogram. Tea production increased by
15.2 percent, partly attributed to the
privatization of some tea factories which
led to productivity gains, but also the
eradication of a tea plant disease which
had plagued some tea plantations in
2009. Food crops production increased,
benefiting from favorable weather
conditions and ongoing intensification
programs. The modest increase was a
result of the decline in domestic food
prices. Livestock reported a modest
increase despite the ongoing Girinka
Program.
Figure 9. Growth in the Agriculture Sector (Percent)
Source: NISR
The services sector led the way with 9.6
percent growth, contributing the largest
share to GDP (45.8 percent) (Figure 10).
Finance and insurance benefitted largely
from increased insurance activities in the
industry sector, and awareness campaigns
encouraging life insurance (Table 3).
Education, health and public administration
services grew by 14.6 percent, thanks to the
high momentum of public spending in these
areas, partly aided by increased donor
inflows. Hotel and restaurants’ activities
exceeded pre-crisis levels, benefiting from a
record tourist arrival number in 2010.
14
Communication services grew at a healthy
8.7 percent due to an increase in mobile
phone penetration. The number of mobile
phone subscribers increased by 46.1 percent
between December 2009 and 2010.
Table 3. Insurance Activities in Rwanda (Billion of Rwf)
Source: BNR
14
Rwanda Developemnt Board, 2011
-20.0
-10.0
0.0
10.0
20.0
30.0
2008
2009
2010
Gross premium 35.9 47.9 53.8
Gross premium/GDP 1.4% 1.6% 1.6%
Assets 80.1 102.9 119.0
Assets/GDP 3.0% 3.5% 3.6%
2009
2010
2008
15 | P a g e
Figure 10. Growth in the Services Sector (Percent)
Source: NISR
The industry sector grew at a healthy 8.4
percent, aided by a strong recovery in
manufacturing (Figure 11). Manufacturing
activities revived with growth exceeding pre-
crisis 2008 levels, dominated by the foods
and beverages industry, imports of industrial
materials and new credits to manufacturing
activities. Mining disappointed, contracting
by 10.8 percent. The modest quantity
exported benefited from the increase in
international prices. Construction growth
remained reserved. While overall growth
represented through this sector is
encouraging, consideration of construction
as a lead growth indicator is cautioning the
overall outlook.
2.2. PRICE TRENDS
In 2010 inflation declined and converged to
below pre-crisis levels. As of December
2010, the CPI stood at 0.2 percent,
retreating from its peak level of 22.3 percent
at end-2008 (Figure 12. Inflation Trends
2007-2010).
Figure 11. Growth in the Industry Sector (Percent)
Source: NISR
Year-on-year inflation reached 2.3 percent
for headline inflation and 1.5 percent for
underlying inflation, respectively. This trend
was owed to the good performance in
domestic food production and a decline in
import prices.
Domestic petroleum prices have been
adjusted periodically in response to world
oil market developments. A committee
consisting of Government and private sector
representatives meets monthly to discuss
and determine fuel prices per liter at the
pump. In 2010, fuel pump prices were
reviewed six times. During the first half of
2010, prices were raised twice, in January
and in May. Between July and September,
prices were reduced twice, and this time
fixed separately for premium super and for
diesel. Since October 2010, fuel prices
climbed steadily and reached Rwf952 for
premium super and Rwf946 for diesel in
December 2010 (Figure 13). Overall, pump
prices increased by 7.3 percent for premium
super and 6.7 percent for diesel.
-10.0 0.0 10.0 20.0 30.0
Other personal services
Real estate, business services
Hotels and restaurants
Health
Finance, insurance
Public administration
Transport, storage, communication
Education
Wholesale and retail trade
2008
2009
2010
-20.0
-10.0
0.0
10.0
20.0
30.0
2008
2009
2010
16 | P a g e
Figure 12. Inflation Trends 2007-2010
Source: BNR and NISR
Figure 13. Domestic Fuel Price Trends in 2010 (Rwf)
Source: Ministry of Commerce
2.3. FISCAL TRENDS
15
Fiscal policy continues to inject a stimulus
in 2010/11. This is reflected in continued
high levels of spending in order to support
the nascent recovery. Total expenditures are
projected to increase by a 9.5 percent to
Rwf984.0 billion (Table 4). A major increase
in domestic capital investment is planned,
pushing capital expenditure to 41.1 percent
of the budget. Total expenditure and net
lending are projected at 27.8 percent of
GDP. Expenditure coverage by total
revenues (including grants) is expected to
decline to 84.0 percent from 86.7 percent of
2009/10.
15
The 2010/11 budget was Rwanda’s second budget
following the EAC fiscal year from July to June. This budget
was presented to Cabinet on April 15, 2010 and approved
by Parliament in its session of June 24, 2010. The State
Finance Law was gazetted on June 30, 2010.
The overall fiscal deficit (excluding grants)
is expected to increase to 13.8 percent of
GDP, from 13.2 percent in 2009/10. Donor
inflows are planned to remain a significant
source of budget financing, but at
decreasing level. Both budgetary and capital
grants are projected to decrease in the
2010/11. The external financed budget share
is planned to decline by one fifth to 35.2
percent down from 43.9 percent in 2009/10.
Allocation to debt repayment is expected to
increase by 25.7 percent in terms of budget
share, as Government stock of domestic
securities issued in 2010 and a 3-year bond
will reach maturity in 2011.
(5.0)
5.0
15.0
25.0
35.0
Jan-07
Mar-07
May-07
Jul-07
Sep-07
Nov-07
Jan-08
Mar-08
May-08
Jul-08
Sep-08
Nov-08
Jan-09
Mar-09
Mai 09
Juil-09
Sep-09
Nov-09
Jan-10
Mar-10
May-10
Jul-10
Sep-10
Nov-10
CPI
Imported Goods
Local Food and non-alcoholic beverages
925
920
944
952
887
887
918
940
917
913
933
946
880
920
960
Premium
Diesel
17 | P a g e
Table 4. Government Budget 2009/10 and 2010/11 (Billion
of Rwf)
The mid-term review of the budget was
approved by Parliament on February 28,
2011. The overall budget envelope remained
the same, with some reallocations within
that envelope. It mainly accommodated a
change in financing from donors, i.e. the
disbursement delay by some donors was
compensated by extra budget support
resources provided by the World Bank and
COMESA reimbursement for trade tax losses
incurred after the implementation of the
EAC Common External Tariff Framework in
July 2010.
2010/11 budget projections are based on
four broad priority areas of spending as
defined by the EDPRS (Annex 3).
The human development and social
sectors cluster including health,
education, social protection and youth,
culture & sports, and, is continuing to
receive the lion’s share of Government
spending (31.1 percent). The EDPRS
target stands at 34.2 percent. Although
its absolute spending increases by 6.7
percent, this represents a 0.8 percent
decline in terms of share of total
expenditure compared to 2009/10.
The Governance and sovereignty cluster
is seeing its allocation decrease from
36.5 percent to 30.1 percent in budget
share (9.8 percent in absolute terms, and
17.5 percent in terms of total
expenditure compared to 2009/10),
converging to the EDPRS target of 29.4
percent This cluster comprises general
public services, defenses and public
order and safety functions.
The allocation to the infrastructure
cluster increases in terms of budget
share. But instead of converging to the
EDPRS target of 19.7 percent, spending is
planned at 24.6 percent of the budget up
from 21.5 percent in 2009/10. This
corroborates with the Government’s
goal for alleviating infrastructure
bottlenecks (e.g. broadening electricity
access and completing the fiber optic
program, etc.).
For the productive capacities cluster a
more than 50.0 percent increase in
allocation is planned, from 10.0 percent
to 14.2 percent as a share of the budget,
FY 2010/11
Original
Budget
Revised
Budget
Actual Budget
Revenue and grants 743.7 779.6 800.8 826.1
Domestic revenue 401.50 385.1 391.5 479.8
Tax revenue 368.00 369.4 376.5 457.6
Direct taxes 147.1 144.5 148.9 179.0
Taxes on goods and services 183.1 191.2 195.1 234.8
Taxes on international trade 37.8 33.6 32.6 43.8
Non-tax revenue 33.5 15.8 15.0 22.1
Total Grants 342.2 394.5 409.3 346.4
Budgetary grants 215.8 268.1 283.0 229.6
Capital grants 126.4 126.4 126.4 116.8
Total expenditure and net lending 838.0 899.0 819.0 984.0
Current expenditure 459.3 478.8 457.1 517.1
Wages and salaries 107.7 108.2 106.9 120.6
Purchases of goods and services 107.5 112.3 103.9 120.5
Transfers 178.9 190.2 179.6 195.5
Exceptional social expenditure 51.7 54.7 51.8 67.0
Interest payments 13.4 13.4 14.8 13.5
Domestic Int (paid) 8.6 8.6 10.3 9.0
External Int (paid) 4.8 4.8 4.5 4.5
Capital expenditure 348.1 356.4 311.5 404.0
Domestic 153.1 161.4 154.0 224.6
Foreign 195.0 195.0 157.5 179.4
Net lending 7.0 38.4 28.2 31.2
Debt repayment 15.2 17.0 11.1 23.4
Domestic 9.9 11.7 7.0 15.1
Foreign 5.3 5.3 4.1 8.3
Arrears 8.4 8.4 11.1 8.3
Overall Deficit
1
-79.1 -102.4 -7.1 -134.5
Deficit Financing
2
79.1 102.4 7.1 134.4
Foreign financing (net) 63.3 63.3 27.0 54.5
Drawing on GoR account 0.0 0.0 0.0 59.1
Domestic financing (net) 15.8 39.0 -19.9 20.8
Source: MINECOFIN
2
Net of debt repayment.
FY 2009/10
1
Revenues and grants minus total expenditure and net lending (excluding debt repayment).