Báo cáo khoa học: Mathematical modelling of the urea cycle A numerical investigation into substrate channelling docx
Bạn đang xem bản rút gọn của tài liệu. Xem và tải ngay bản đầy đủ của tài liệu tại đây (222.45 KB, 9 trang )
Mathematical modelling of the urea cycle
A numerical investigation into substrate channelling
Anthony D. Maher
1
, Philip W. Kuchel
1
, Fernando Ortega
2
, Pedro de Atauri
2
, Josep Centelles
2
and Marta Cascante
2
1
School of Molecular and Microbial Biosciences, University of Sydney, Australia;
2
Department de Bioquimica i Biologia Molecular,
Universitat de Barcelona, Spain
Metabolite channelling, the process in which consecutive
enzymes have confined substrate transfer in metabolic
pathways, has been proposed as a biochemical mechanism
that has evolved because it enhances catalytic rates and
protects unstable intermediates. Results from experiments
on the synthesis of radioactive urea [Cheung, C., Cohen,
N.S. & Raijman, L (1989) J. Biol. Chem. 264, 4038–4044]
have been interpreted as implying channelling of arginine
between argininosuccinate lyase and arginase in permeabi-
lized hepatocytes. To investigate this interpretation further,
a mathematical model of the urea cycle was written, using
Mathematica it simulates time courses of the reactions. The
model includes all relevant intermediates, peripheral
metabolites, and subcellular compartmentalization. Analy-
sis of the output from the simulations supports the argument
for a high degree of, but not absolute, channelling and offers
insights for future experiments that could shed more light on
the quantitative aspects of this phenomenon in the urea cycle
and other pathways.
Keywords: arginase; mathematical modeling; metabolite
channeling; urea cycle.
There has been considerable debate in recent years over the
phenomenon of metabolite channelling [1–3]. Channelling
has been defined as Ôthe process by which two or more
sequential enzymes in a pathway interact to transfer an
intermediate from one active site to another without
allowing free diffusion into the bulk systemÕ [4]. It has been
suggested that channelling plays a fundamental role in
regulation of certain reaction schemes, and in protection of
substrates that are subject to both biochemical and spon-
taneous chemical transformation. Despite this, some theor-
etical studies have given evidence that channelling would
not decrease pool sizes of metabolites [5,6].
The urea cycle is the means whereby a uriotele
eliminates the potentially harmful ammonia from the
body by converting it to urea prior to excretion. The
pathway of ureogenesis was elucidated by Krebs and
Henseleit in 1932 [7]. While considerable excitement
surrounded this publication the proposal for the cycle
was not universally accepted in the biochemical commu-
nity. Indeed Bach et al. [8] in 1944 argued that the
so-called Ôornithine cycleÕ was insufficient to account for
the rate of synthesis of urea from ammonia in the liver,
so, there must be another pathway. Their conclusion was
based on the observation that the known inhibition of
arginase by high ornithine concentrations did not consid-
erably diminish the synthesis of urea by isolated liver
slices. Their incorrect interpretation of the data was
surmised by Krebs to be a consequence of the fact that
arginine and ornithine do not rapidly penetrate liver slices
[9]. Hence the ornithine would not have reached its
equilibrium concentration by a large margin, and thus it
would not have exerted its inhibitory effect. On the other
hand, the computer simulation study of the urea cycle by
Kuchel et al. [10] showed that even if the ornithine in the
cytoplasm had reached the concentrations used by Bach
et al. [8] the cycle flux would not have been affected. In
other words, the flux control coefficient of arginase, even
in the presence of high ornithine concentrations, was small
compared with that of other enzymes in the cycle.
Many reports have provided evidence of spatial
organization of enzymes and proteins involved in urea
synthesis in the liver. Cohen et al. in 1987 [11] showed
that in the matrix of mitochondria isolated from rat
hepatocytes, ornithine carbamoyltransferase preferentially
uses cytoplasmic ornithine as a substrate. In further
work, Cheung et al. [12] incubated permeabilized rat
hepatocytes with radiolabelled bicarbonate and measured
Correspondence to P. W. Kuchel, School of Molecular and Microbial
Biosciences, University of Sydney, NSW 2006, Australia.
Fax: + 61 2 9351 4726, Tel.: + 61 2 9351 3709,
E-mail:
Abbreviations: ASL, argininosuccinate lyase; ASS, argininosuccinate
synthase; OCT, ornithine carbamoyltransferase; CP, carbamoyl
phosphate; MCA, metabolic control analysis.
Enzymes: arginase (EC 3.5.3.1); argininosuccinate lyase (EC 4.3.2.1);
argininosuccinate synthase (EC 6.3.4.5); carbamoyl phosphate
synthase (ammonia) (EC 6.3.4.16); ornithine carbamoyltransferase
(EC 2.1.3.3).
Note: A web site is available at:
Note: The model, with all rate equations and initial conditions, as used
in the present work, is available (in Mathematica notebook form) from
the authors at or
Note: The mathematical model described here has been submitted to
the Online Cellular Systems Modelling Database and can be accessed
free of charge at: />index.html
(Received 17 June 2003, accepted 7 August 2003)
Eur. J. Biochem. 270, 3953–3961 (2003) Ó FEBS 2003 doi:10.1046/j.1432-1033.2003.03783.x
the distribution of radioactive urea, arginine and citrul-
line after 1 min of incubation. Dilution of the label with
specific, unlabelled intermediates at several steps in the
pathway had only minor effects on the specific activities
of ÔdownstreamÕ metabolites. Specifically, 1 m
M
unla-
belled arginine had little effect on the amount of
radioactive urea produced by the cells in 1 min. The
results were interpreted to imply that added metabolites
in the bulk solvent do not mix freely with the endo-
genous cytoplasmic intermediates and are preferentially
used by urea cycle enzymes. A similar protocol was used
to demonstrate the preference of matrix ornithine
carbamoyltransferase for endogenously formed car-
bamoyl phosphate [13]. In addition, immunocytochemical
studies [14] support the hypothesis that some of the urea
cycle enzymes are spatially organized in vivo.
A detailed mechanistic-kinetic model of the urea cycle
was previously written by one of us (P. W. Kuchel) [10], but
aspects of channelling and the effects of subcompartmen-
tation of the cycle were not explored. Hence, the aims of the
current work were to: (a) extend this model in the widely
available and readily modifiable program, Mathematica;
(b) expand the model so that it could distinguish between
events in subcellular compartments such as the mitochon-
dria; and (c) include equations for additional, distinct
radioactive, and exogenous substrates (Fig. 1). We also
aimed to (d) predict the pattern of distribution of radio-
activity in cytoplasmic urea cycle intermediates that would
be expected following addition of particular radioactive
substrates to the cells. Finally, we aimed to (e) study the
effect that addition of unlabelled intermediates would have
on this distribution, assuming various proposed mecha-
nisms of urea synthesis. To investigate the latter aim we paid
particular attention to the results of an experiment pub-
lished by Cheung et al. [12] in which unlabelled (cold)
arginine was added to suspensions of permeabilized
hepatocytes that were synthesizing radioactive urea from
H
14
CO
3
–
.
The mathematical model described here has been
submitted to the Online Cellular Systems Modelling
Database and can be accessed free of charge at: http://
jjj.biochem.sun.ac.za/database/maher/index.html
Premise
The simulations were designed to reflect as closely as
possible the experimental set up described by Cheung et al.
[12]. Isolated hepatocytes were prepared from fresh rat livers
by treatment with collagenase and then exposed for a short
time to the membrane-active a-toxin from Staphylococcus
aureus. This toxin permeabilized the plasma membranes of
the hepatocytes to low molecular weight compounds such as
arginine, citrulline, ornithine and lysine, yet largely main-
tained inside the cell compounds with molecular masses
greater than 5000, such as larger proteins including the
enzymes involved in ureogenesis. However, 13% of the total
arginase in the suspension appeared outside the cells prior to
the incubations, with this figure rising to about 20% after
1 min [12].
Incubations had been performed in a buffer supplemented
with the substrates necessary for urea synthesis: NH
4
Cl,
ornithine, aspartate and H
14
CO
3
–
[12]. At saturating sub-
strate concentrations (15 m
M
HCO
3
–
,5 m
M
aspartate, 5 m
M
NH
4
Cl, 5 m
M
ornithine), the permeabilized hepatocytes
synthesized urea at rates comparable with that of intact cells
(4 nmolÆmin
)1
Æmg
)1
dry weight compared with 13 nmolÆ
min
)1
Æmg
)1
dry weight). However, at physiologicalammonia
and ornithine concentrations (0.5 m
M
and 0.2 m
M
, respect-
ively), urea was formed at 12.1 nmolÆmin
)1
ÆmL
)1
of cells [12].
Incubations (2 mL, final volume) had been terminated
by adding 1 mL 5
M
HClO
4
. Unreacted HCO
3
–
(including,
presumably, all unreacted H
14
CO
3
–
) was evaporated as CO
2
by heating the deproteinized supernatants for 90 min at
70 °C. The total counts of radioactivity fixed in the remain-
der of the suspension were then determined, as were the total
counts fixed specifically in urea, arginine and citrulline [12].
In the absence of added ornithine and NH
3
,asmall
amount of radioactivity was typically recovered as urea,
arginine or citrulline due to small amounts of endo-
genous ornithine and NH
3
, along with counts fixed in
compounds other than those of the urea cycle. Thus the
total counts fixed after HCO
3
–
removal were corrected
for counts fixed independently of ornithine and NH
3
.
The results were then tabulated as total counts fixed in
urea, arginine and citrulline after 1 min and expressed as
a percentage of (NH
3
+ ornithine)-dependent counts
(those from urea, arginine, citrulline and argininosucci-
nate). It was then possible to compare differences (or
similarities) between the distributions of radioactivity in
these intermediates across a range of experiments in
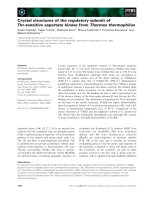
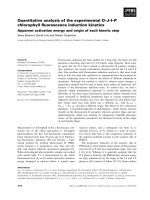
Fig. 1. Schematic representation of the urea cycle used as the basis for
the computer model showing metabolites and compartmentation. An
asterisk indicates a radiolabelled counterpart of the metabolite.
Metabolites: CP, carbamoyl phosphate; Orn, ornithine; Cit, citrulline;
ATP, adenosine triphosphate; Asp, aspartate; AMP, adenosine
monophosphate; PPi, pyrophosphate; AS, argininosuccinate; Fum,
fumarate; Arg, endogenous arginine; ArgQ, exogenous arginine.
Enzymes: 1, ornithine carbamoyltransferase; 2, argininosuccinate
synthase; 3, argininosuccinate lyase; 4, arginase. Subscripts ÔimsÕ, ÔmatÕ
and ÔcytÕ denote intermembrane space, mitochondrial matrix and
cytoplasm, respectively.
3954 A. D. Maher et al. (Eur. J. Biochem. 270) Ó FEBS 2003
which comparatively large amounts of unlabelled urea
cycle intermediates were added to the cells, in order to
assess the influence of these added substrates on the rate
of urea synthesis.
Model
Written in Mathematica, the basic model simulates the time-
dependent flux of metabolites through the urea cycle (see
Fig. 1) using a general metabolic simulation package called
ÔMetabolicControlAnalysisÕ (MCA) developed by Mulqui-
ney and Kuchel [15], with all the features of MCA described
by Heinrich and Schuster [16]. The model includes steady-
state enzyme-kinetic equations to describe the multisub-
strate reactions (see Appendix, part 1) of the enzymes and
distinguishes between reactions that occur in different
compartments (e.g., mitochondrial matrix, intermembrane
space and cytoplasm). It also contains parallel equations for
separately identifiable radioactive substrates. Parameters in
the model have been assigned to fit as closely as possible
with those in the experimental set up. It was assumed that
changes in compartment volumes during the course of the
incubations were insignificant.
The previous model constructed by Kuchel et al.[10]
was based on numerous references but the key ones [17–22]
were used as the starting point for these simulations, which
was then extended as follows. (a) Compartmentalization:
reactions of the urea cycle are known to take place in both
the cytoplasm and the mitochondrial matrix. Metabolites
such as ornithine and citrulline must traverse the inter-
membrane space that separates the former two compart-
ments. Another compartment to be considered was the
extracellular medium, since the plasma membranes were
made permeable to ÔsmallÕ molecules with a-toxin. Fig. 1
indicates the metabolites considered in this simulation,
together with their respective compartments. Note that all
cytoplasmic metabolites have a spatially distinguishable,
yet chemically identical and rapidly exchangeable equiva-
lent in the extracellular medium; these metabolites are
omitted from Fig. 1 for clarity. The cytoplasmic urea cycle
enzymes argininosuccinate synthase (ASS) argininosucci-
nate lyase (ASL) were modelled as though they are
confined to the cytoplasm, whereas % 13% of the total
arginase was found outside the cells [12], thus it is capable
of hydrolysing extracellular arginine. (2) Addition of
radioactive substrates: in the experiments described by
Cheung et al. [12] H
14
CO
3
)
was added to the cells. This
results in all of the label ending up in urea. However, for
simplicity, the ÔfirstÕ reaction in the cycle [that performed by
carbamoyl phosphate synthase (ammonia)] was modelled
as the instantaneous conversion of bicarbonate to car-
bamoyl phosphate; in other words, for simulation purpo-
ses, the Ôradiolabelled substrateÕ added to the cells was
carbamoyl phosphate.
The simulation requires that initial values (in molÆL
)1
)
be entered for both the nonradioactive and radioactive
species. The following procedure was used to select initial
concentrations for unlabelled and labelled carbamoyl
phosphate. We assumed that the stock bicarbonate was
100% labelled. According to the methods section in [12]
the original specific activity was 55 mCiÆmmol
)1
, equi-
valent to 1.221 · 10
8
d.p.m.Ælmol
)1
.Itisstatedinthe
legend to Table 2 of the paper by Cheung et al. [12] that the
specific activity in Experiment 1 was 530 c.p.m.Ænmol
)1
[12].
This is equal to 552.1 d.p.m.Ænmol
)1
(because the stated
counting efficiency for
14
C was 96%). Thus we assume there
were 0.00452 mol labelled bicarbonate per mol total bicar-
bonate. In the experiments, the total concentration of
bicarbonate was 15 m
M
but the total concentration of
NH
4
Clwas0.5 m
M
. So we defined a concentration of CP as
0.5 · 10
)3
molÆL
)1
and initial concentration of labelled CP
as 2.26 · 10
)5
molÆL
)1
. Steady-state urea production was
assigned a value of 2.02 · 10
)7
molÆs
)1
ÆL per cells that
corresponds to the observed 12.1 nmolÆmin
)1
ÆmL per cells
produced in the experiments.
Initial concentrations of substrates in the extracellular
milieu were given values according to the Methods section
of Cheung et al. [12]. Other intracellular and mitochond-
rial metabolites were assigned a value of 1 l
M
.The
unitary rate constants and rate equations for the four
relevant enzymes, and their initial concentrations, were
taken from the original urea cycle simulation [10]
(Appendix, part 3). Rate constants for membrane
exchange of metabolites were assigned values consistent
with transport through the outer mitochondrial membrane
and the plasma membrane being faster than transport
through the inner mitochondrial membrane, and very
rapid exchange across the cytoplasmic membrane. Rate
equations were also included for the removal of meta-
bolites from the system (mimicking the realistic scenario
that their concentrations remain relatively constant in the
cells); while pools were set up for the input of CP, ATP
and aspartate, each being given a value designed to result
in the desired steady-state rate of production of urea.
Furthermore, arginine was considered a competitive
inhibitor of argininosuccinate synthase [12].
Once all of the rate laws for each biochemical and
membrane-transport reaction had been defined, a numerical
solution to the system was obtained using the built-in
Mathematica function, NDSolve. In our simulations using
the add-on package MCA, the stoichiometry of each
individual reaction was first defined, and from this, three
matrices were generated, called the stoichiometry matrix,
the substrate matrix, and the velocity matrix. A function
called NDSolveMatrix uses the built-in NDSolve function
to solve the system of differential equations using these
matrices.
Results
Simulation in the absence of added metabolites
The Mathematica program stores the numerical solution of
the differential equations as a set of interpolating functions
for each variable (metabolite) modelled in the system (see
Fig. 1). In order to be useful, any simulation must
approach as near as possible to available experimental
data. The output from a model can take a number of
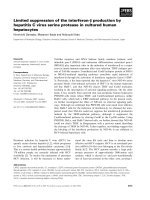
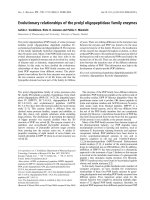
forms and Fig. 2 shows some of the graphs generated for
the time dependence of selected metabolites modelled in
our system. The ornithine concentration in the cytoplasm
(Fig. 2A) is seen to decline within the first 300 s of starting
the reactions, with a corresponding increase in cytoplasmic
citrulline (Fig. 2B). The curve of the argininosuccinate
Ó FEBS 2003 Modelling to predict urea cycle kinetic mechanisms (Eur. J. Biochem. 270) 3955
concentration (Fig. 2C) is seen to increase within the first
100 s of simulated time, and then decrease as it is
converted to arginine. Arginine (Fig. 2D) exhibits a similar
flux pattern to argininosuccinate, except that its concen-
tration decreases within the first few seconds of the
simulation, this effect is ascribed to the high catalytic
capacity (V
max
)ofthearginase.
Relevant Mathematica functions were written to extract
the distribution of radioactivity, and the total measurable
radioactivity in labelled metabolites from the simulations.
Results are presented in [12] both as c.p.m. measured in
urea, arginine and citrulline, along with the percentage of
(NH
3
+ ornithine)-dependent counts found in these
metabolites. It was assumed that the remainder of
(NH
3
+ ornithine)-dependent counts was in argininosuc-
cinate. Table 1 shows the output from the simulation for
the distribution of radioactivity in urea, arginine, citrulline
and argininosuccinate as a percentage, alongside the
corresponding values obtained in the experiments by
Cheung et al. [12]. Below this the predicted c.p.m. in urea,
arginine and citrulline is also listed for the simulation and
the experiment by Cheung et al. [12]. While the simulated
values did not exactly match those of the experiments, the
pattern of distribution of radioactivity is similar, with most
being in citrulline, followed by urea, argininosuccinate and
arginine.
Simulating the effect of the addition of 1 m
M
unlabelled
arginine on the distribution of radioactivity
in cytoplasmic intermediates of the urea cycle
As the pattern of distribution of radioactivity predicted by
the simulation was similar to that found by experiment, the
Fig. 2. Examples of graphical output from the computer model of the urea cycle. Time course graphs for cytoplasmic ornithine, cytoplasmic citrulline,
argininosuccinate, arginine and urea are presented in A–E, respectively. AS, argininosuccinate.
Table 1. Simulated and experimental values for the distribution of
‘(NH
3
+ ornithine)-dependent’ metabolites [12] with no added arginine.
The Ôsimulated valueÕ column gives values predicted by the simulation
of the Ôarginase-loadingÕ experiment described by Cheung et al. 12],
after 1 min of simulation, as a percentage of the total radioactivity in
the listed metabolites. Also presented is the total c.p.m. predicted in
urea, arginine and citrulline for the same simulation. The data are
juxtaposed with the values obtained by experiment [12] in the
ÔExperimental valueÕ column.
Simulated value Experimental value
Urea (%) 22.0 27
Arginine (%) 5.2 7
Citrulline (%) 56.6 46
Argininosuccinate (%) 16.2 20
c.p.m. in urea 5486 3750
c.p.m. in arginine 1305 1020
c.p.m. in citrulline 14 145 6470
3956 A. D. Maher et al. (Eur. J. Biochem. 270) Ó FEBS 2003
next step was to simulate the effect on this labelling pattern of
the addition of a 1-m
M
excess of arginine. From a modelling
point of view, this was accomplished by creating a separate
ÔpoolÕ of exogenous arginine (called ÔargQÕ in the program,
and in Fig. 1) defined as being chemically indistinguishable
from the endogenous arginine with respect to its ability to be
hydrolysed by cytoplasmic or extracellular arginase.
The pattern of distribution of radioactivity presented in
Table 2, which assumes that all intermediate metabolites are
free to mix with the bulk solvent, follows the pattern
predicted in the absence of exogenous arginine. There is a
slight decrease in the radioactivity predicted in urea, with
corresponding increases in arginine and citrulline. The total
counts found in urea were slightly decreased in this
simulation, with slight increases in arginine and citrulline.
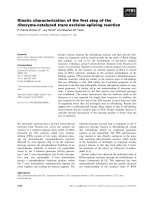
It was reported by Cheung et al. [12] that 44% of the
exogenous arginine had been hydrolysed by the end of the
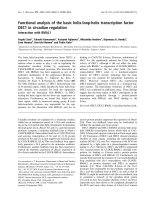
incubations (after 60 s). Fig. 3 plots the predicted time
dependence of the concentration of added arginine for
the first 60 s. It can be seen that in this simulation almost all
the added arginine is hydrolysed within the first 60 s. Thus
the current model had to be altered in some way in order to
match the experimental results.
Simulation of channelling of arginine from
argininosuccinate lyase to arginase
ThedatalistedinTables1and2weregeneratedfrom
simulations in which it was assumed that all intermediates in
the pathway were free to mix throughout the bulk solvent.
As all of the data generated by our simulations did not
follow the pattern observed in the experiments of Cheung
et al. [12], we investigated what effect the assumption of
channelling would have on our simulated data. This is in
spite of there being no detectable binding between the two
enzymes that catalyse the consecutive reactions in the urea
cycle under (admittedly) in vitro conditions [19]. As stated
above, channelling is essentially the direct transfer of a
metabolite from one enzyme to another, without allowing
diffusion into the bulk solvent; to simulate this situation
access of the exogenous arginine to its active site on arginase
was restricted. Mathematically this was achieved by
introducing a Ôfree mixing factorÕ ( fm) to the rate equation
for exogenous arginine hydrolysis by arginase in the
Mathematica program; fm can take any value between 0
and 1. Table 3 shows output from 11 simulations when fm
was increased from 0 to 1 in increments of 0.1. The right-
hand column, with an fm value of 1.0, shows that the
distribution of radioactivity is identical (by definition) to
that given in Table 2 because this simulation had the
assumption of Ô100% free mixingÕ. Decreasing this Ôfree
mixing factorÕ reduced the percentage of radioactivity
predicted in urea, arginine and argininosuccinate, with the
proportion in citrulline increasing.
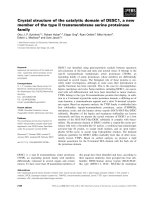
Figure 4 gives a combined plot of the time dependence of
the exogenous arginine concentrations for the 11 simula-
tions described here. Each curve on this graph corresponds
to the time-dependent concentration of added arginine in a
simulation, each with a different value of fm.Whenfm ¼ 1,
the exogenous arginine is most rapidly used up; and it is
constant at 1 m
M
when fm ¼ 0. It can be seen from Fig. 4,
that for this set of simulations a value for fm of % 0.1 would
result in 44% hydrolysis of the added arginine, which is
consistent with the experimental results.
Table 3 shows that setting fm to 0.1 gives a radioactivity
distribution after 60 s of simulated time of 12.2% in urea,
3.9% in arginine, 73.1% in citrulline and 10.8% in
argininosuccinate. While this simulated effect of the addi-
tion of 1 m
M
exogenous arginine is not identical to the effect
seen experimentally, the pattern of the alteration in the
Table 2. Simulated and experimental [12] values for the distribution of
‘(NH
3
+ ornithine)-dependent’ metabolites with 1 m
M
‘added’ arginine.
See legend to Table 1 for explanation of numbers and symbols. The
simulated values are the same as the column corresponding to
fm ¼ 1.0 in Table 3.
Simulated value Experimental value
Urea (%) 18.8 24
Arginine (%) 6.6 7
Citrulline (%) 58.3 55
Argininosuccinate (%) 16.3 14
c.p.m. in urea 4696 3950
c.p.m. in arginine 1651 1070
c.p.m. in citrulline 14 573 8930
Fig. 3. Computer simulated time course of the concentration of added
arginine in a liver cell preparation. In this simulation, 100% free mixing
of the arginase pools was assumed (i.e., fm ¼ 1).
Table 3. Simulated values for the distribution of (NH
3
+ ornithine)-dependent metabolites with 1 m
M
added arginine with fm values ranging from
0to1.All values are those that the simulation predicted after 1 min of incubation. See the text for further details.
fm 0.0 0.1 0.2 0.3 0.4 0.5 0.6 0.7 0.8 0.9 1.0
Urea 10.9 12.2 13.5 14.7 15.7 16.5 17.2 17.7 18.2 18.5 18.8
Arginine 2.7 3.9 4.8 5.4 5.8 6.1 6.3 6.4 6.5 6.6 6.6
Citrulline 78.6 73.1 68.8 65.6 63.3 61.7 60.5 59.7 59.1 58.6 58.3
Argininosuccinate 7.9 10.8 12.9 14.3 15.2 15.7 16.0 16.2 16.2 16.3 16.3
Ó FEBS 2003 Modelling to predict urea cycle kinetic mechanisms (Eur. J. Biochem. 270) 3957
distribution is similar in terms of an increase in citrulline at
the expense of the other labelled metabolites. This can be
explained by the fact that argininosuccinate synthase is
inhibited by arginine. Simulations at lower values of fm
retain cytoplasmic arginine for longer than simulations with
high values of fm (Fig. 4), and therefore have increased
counts recovered in citrulline.
Discussion
For this paper, we developed a mathematical model of the
urea cycle in which all metabolic reactions are confined to
specific cellular subcompartments, and we have included
relevant membrane transport reactions such that all
metabolites are both chemically and spatially identifiable.
A specific aim of this work was to develop and Ôfine-tuneÕ
this model to generate ÔdataÕ for time-course simulations
that are comparable to those obtained experimentally. The
intention was to use this model to assist in making
conclusions that might explain the molecular mechanisms
behind these observations. The output from the simulations
presented above are consistent with an interpretation that
endogenous arginine is preferentially used by arginase.
When in the simulations we assume that the exogenous
arginine can access only 10% of the cytoplasmic arginase,
the output is similar to that found in the experiments.
Analysis of the output presented above, however, raises
other points worthy of consideration. In the argument by
Cheung et al. [12] that channelling was a necessary inter-
pretation several predictions were made with regard to the
outcome of the experiments in the absence of channelling.
These included that the addition of 1 m
M
unlabelled
arginine would decrease the total counts of radioactivity
in urea to the extent that they would be undetectable, with
a corresponding increase in the percentage recovered as
arginine. It was also argued that with the addition of 5 m
M
arginine, the percentage of counts recovered as arginine
would have been increased in the absence of channelling,
rather than the observed increase in the percentage recov-
ered as citrulline. In our simulations in which free mixing is
assumed there is no predicted significant increase in the
percentage of counts recovered as arginine, nor is there a
decrease in the percentage of counts recovered as urea after
60 s of simulated time to the extent to which they would be
undetectable. In our simulation the addition of 1 m
M
excess
arginine, with the high maximal velocity of arginase, sees a
large increase in the ornithine concentration in the cyto-
plasm, which in turn, translates into a large increase in the
concentration of ornithine in the mitochondrial matrix. The
ornithine carbamoyltransferase reaction is then largely
dependent on the rate at which CP is produced in the
matrix. Since the specific activity of the carbamoyl phos-
phate produced in the matrix is the same as that of the
bicarbonate, only small changes are predicted in the
distribution of labelled cytoplasmic urea cycle intermediates
after 60 s of simulated time. The increase in the percentage
of counts recovered as citrulline can be attributed to the
inhibition of argininosuccinate synthase by the added
arginine.
Another approach that might at first sight seem to
provide a plausible explanation for the fact that only 44% of
the added arginine was used in 60 s would be to simply
decrease the concentrations of the enzymes until this
condition was met. However, when all the enzyme concen-
trations were decreased to achieve this outcome, almost all
of the radioactivity was recovered in citrulline. A very large
number of simulations was run with different concentra-
tions of enzymes, and the model of the unperturbed urea
cycle, that best fits the corresponding experimental results
[12], is the one presented here.
While metabolic research continues to provide evidence
of pathways that exhibit direct transfer of metabolites
between consecutive enzymes, the concept of metabolite
channelling in pathways mediated by enzymes free in
solution remains debated. There are several criteria with
which to establish the presence of substrate channelling [4],
including the isotope dilution method examined here.
This paper highlights the importance of taking care when
predicting possible outcomes of such experiments, in
particular for cyclic enzymatic pathways. Due to the
relatively high level of complexity in such pathways (as
opposed to shorter, linear pathways) expected results are
not always intuitive. The construction of detailed, and
necessarily complex, mathematical models serves as a ÔtoolÕ
to facilitate analysis of channelling in biochemical pathways
like the urea cycle.
There is a range of possible molecular mechanisms that
may facilitate channelling in the urea cycle and other
pathways. For this paper we have introduced a means of
modelling for channelling with the Ôfree-mixingÕ factor, fm.
This is only one of several possible approaches to the
problem; it was based on the hypothesis that in vivo,urea
cycle enzymes are spatially organized in a way such that
exogenous metabolites have their access restricted to the
binding sites on the enzymes. On the other hand, endo-
genous metabolites are directly transferred to the binding
site from the previous enzyme in the pathway. This is
consistent with cytochemical evidence for such close proxi-
mity for argininosuccinate synthase and argininosuccinate
lyase [14]. Other approaches to modelling channelling may
be necessary to account for data from similar experiments to
those by Cheung et al. [12] in other pathways; this could
involve allocating a Ôpreference factorÕ that an enzyme may
have for one subset of a type of molecule over another
subset, be it a radiochemical or physical distinction.
Fig. 4. Predicted concentration of arginine in the total extramito-
chondrial medium. Eleven separate simulations of the reaction scheme
in Fig. 1 were used with fm ranging from 0 to 1.0. The curve with the
most rapidly decreasing arginine concentration was that generated
from a simulation where fm was set to 1, the remainder of the curves
have a slope, at a given time, that decreases with decreasing fm.
3958 A. D. Maher et al. (Eur. J. Biochem. 270) Ó FEBS 2003
In conclusion, we present a more advanced and realistic
model of the urea cycle than has been available hitherto. The
model affords a means of studying the kinetic consequences
of enzyme and metabolite compartmentalization and should
serve as a basis for more extended analysis of control and
regulation phenomena of this high-flux pathway.
Acknowledgements
This work was supported by a grant from the Australian National
Health and Medical Research Council and the Australian Research
Council to P. W. Kuchel. A. D. Maher is the recipient of a University of
Sydney Postgraduate Award. We thank Prof. Natalie Cohen for
information regarding the experimental set-up.
References
1. Cascante, M., Sorribas, A. & Canela, E.I. (1994) Enzyme–enzyme
interactions and metabolite channelling: alternative mechanisms
and their evolutionary significance. Biochem. J. 298, 313–320.
2. Hawkins, A.R. & Lamb, H.K. (1995) The molecular biology of
multidomain proteins. Selected examples. Eur. J. Biochem. 232,
7–18.
3. Mendes, P., Kell, D.B. & Westerhoff, H.V. (1992) Channelling can
decrease pool size. Eur. J. Biochem. 204, 257–266.
4. Anderson, K.S. (1999) Fundamental mechanisms of substrate
channeling. Methods Enzymol. 308, 111–145.
5. Cornish-Bowden, A. (1991) Failure of channelling to maintain low
concentrations of metabolic intermediates. Eur. J. Biochem. 195,
103–108.
6. Cornish-Bowden, A. & Cardenas, M.L. (1993) Channelling can
affect concentrations of metabolic intermediates at constant net
flux: artefact or reality? Eur. J. Biochem. 213, 87–92.
7. Krebs, H.A. & Henseleit, K. (1932) Untersuchungen uber die
harnstoffbildung im tierkorper. Hoppe-Seyler’s Z. Physiol. Chem.
210, 33–66.
8. Bach, S.J., Crook, E.M. & Williamson, S. (1944) On arginase and
its participation in urea synthesis in the liver. Biochem. J. 38,
325–332.
9. Krebs, H.A. (1976) The discovery of the ornithine cycle. In The
Urea Cycle (Grisolia, S., Baguena, R. & Mayor, F., eds), pp. 1–12.
John Wiley & Sons, New York.
10. Kuchel, P.W., Roberts, D.V. & Nichol, L.W. (1977) The simula-
tion of the urea cycle: correlation of effects due to inborn errors in
the catalytic properties of the enzymes with clinical-biochemical
observations. Aust.J.Exp.Biol.Med.Sci.55, 309–326.
11. Cohen, N.S., Cheung, C.W. & Raijman, L. (1987) Channeling of
extramitochondrial ornithine to matrix ornithine transcarbamy-
lase. J. Biol. Chem. 262, 203–208.
12. Cheung, C.W., Cohen, N.S. & Raijman, L. (1989) Channeling of
urea cycle intermediates in situ in permeabilized hepatocytes.
J. Biol. Chem. 264, 4038–4044.
13. Cohen, N.S., Cheung, C.W., Sijuwade, E. & Raijman, L. (1992)
Kinetic properties of carbamoyl-phosphate synthase (ammonia)
and ornithine carbamoyltransferase in permeabilized mitochon-
dria. Biochem. J. 282, 173–180.
14. Cohen, N.S. & Kuda, A. (1996) Argininosuccinate synthetase and
argininosuccinate lyase are localized around mitochondria: an
immunocytochemical study. J. Cell. Biochem. 60, 334–340.
15. Mulquiney, P.J. & Kuchel, P.W. (2003) Modelling Metabolism
with Mathematica. CRC Press, Boca Raton, FL.
16. Heinrich, R. & Schuster, S. (1996) The Regulation of Cellular
Systems. Chapman & Hall, New York, NY.
17. Marshall, M. & Cohen, P.P. (1972) Ornithine transcarbamylase
from Streptococcus faecalis and bovine liver. II. Multiple binding
sites for carbamyl-P and 1-norvaline, correlation with steady state
kinetics. J. Biol. Chem. 247, 1654–1668.
18. Rochovansky, O. & Ratner, S. (1967) Biosynthesis of urea. XII.
Further studies on argininosuccinate synthetase: substrate affinity
and mechanism of action. J. Biol. Chem. 242, 3839–3849.
19. Kuchel, P.W., Nichol, L.W. & Jeffrey, P.D. (1975) Physicochemi-
cal and kinetic properties of beef liver argininosuccinase. Studies in
the presence and absence of arginase. Biochim. Biophys. Acta 397,
478–488.
20. Kuchel, P.W., Nichol, L.W. & Jeffrey, P.D. (1975) Interpretation
of the kinetics of consecutive enzyme-catalyzed reactions. Studies
on the arginase-urease system. J. Biol. Chem. 250, 8222–8227.
21. Ratner, S. (1972) Argininosuccinases and adenylosuccinases.
In The Enzymes (Boyer,P.D.,ed.),pp.167.AcademicPress,
New York.
22. Greenberg, D.M. (1960) Arginase. In The Enzymes (Boyer, P.D.,
Lardy, H. & Myrba
¨
ck, K., eds), pp. 257. Academic Press,
New York.
Appendix
Enzyme rate equations
The method for deriving the rate equations and assigning values to rate constants is given in detail by Kuchel et al.
[10], and more recently using an automated procedure, by Mulquiney and Kuchel [15]. Briefly, for ornithine
carbamoyltransferase (OTC), the rate equation for a reversible Bi Bi ordered sequential mechanism was assumed. Four
of the eight unitary rate constants were given realistic assumed values, while the other four were deduced by
simultaneously solving equations for known (in the literature) steady-state kinetic parameters written in terms of the
unitary rate constants. For ASS, an ordered, sequential Ter Ter mechanism was assumed, and a procedure was
followed similar to that for OTC to designate values for the 12 unitary rate constants after assuming realistic values for
four of them. The same procedure was repeated for ASL (ordered Uni Bi) and arginase. For the purposes of this
simulation arginase was considered to be an irreversible reaction, with product inhibition by ornithine [10].
In the following equations the unitary rate constants are written in the form k
n,Enzyme
where n is a number assigned to the
unitary rate constant for the associated enzyme. Each rate equation is expressed as the difference between the rate laws for
forward and reverse reactions, which are functions of the concentrations of the relevant metabolites. Each rate equation is
also a function of the concentration of the enzyme, which in our simulations was assumed to be constant. A feature of these
equations is that they have lengthy denominators, which are given in a separate equation in each case for clarity. For brevity
only the rate equation for reactions involving nonradioactive metabolites are given. However, it is important to note that the
denominator in each case always contains terms for relevant corresponding radioactive molecules.
Ó FEBS 2003 Modelling to predict urea cycle kinetic mechanisms (Eur. J. Biochem. 270) 3959
1. Ornithine carbamoyltransferase. The metabolites ornithine and citrulline in the OTC equations are labelled as orn
mat
(t)
and cit
mat
(t), respectively, to distinguish them from the same cytoplasmic intermediates referred to in subsequent rate
equations. Other metabolites in the OTC reactions are carbamoyl phosphate and inorganic phosphate (CP(t) and P
i
(t),
respectively) and radioactive citrulline in the matrix (citR
mat
(t)).
v
OTC
¼
k
1;OTC
k
3;OTC
k
5;OTC
k
7;OTC
cp(t) orn
mat
(t) À k
2;OTC
k
4;OTC
k
6;OTC
k
8;OTC
cit
mat
(t) P
i
(t)
denominator
OTC
[OTC]
where
denominator
OTC
=k
2;OTC
k
7;OTC
(k
4;OTC
+k
5;OTC
Þþk
1;OTC
k
7;OTC
(k
4;OTC
+k
5;OTC
)(cp(t)+cpR(t))
þ k
2;OTC
k
8;OTC
(k
4;OTC
+k
5;OTC
)P
i
(t) þ k
3;OTC
k
5;OTC
k
7;OTC
orn
mat
(t) þ k
2;OTC
k
4;OTC
k
6;OTC
(cit
mat
(t)+citR
mat
(t))
þ k
1;OTC
k
3;OTC
(k
5;OTC
+k
7;OTC
)(cp(t) þ cpR(t))orn
mat
(t) þk
6;OTC
k
8;OTC
(k
2;OTC
+k
4;OTC
)P
i
(t)(cit
mat
(t)
þ citR
mat
(t))+k
1;OTC
k
4;OTC
k
6;OTC
(cp(t) þ cpR(t))(cit
mat
(t)+citR
mat
(t)) þ k
1;OTC
k
3;OTC
k
6;OTC
(cp(t)
þ cpR(t))orn
mat
(t)(cit
mat
(t)+citR
mat
(t)) þ k
3;OTC
k
5;OTC
k
8;OTC
orn
mat
(t)P
i
(t)
þ k
3;OTC
k
6;OTC
k
8;OTC
orn
mat
(t)P
i
(t)(cit
mat
(t)+citR
mat
(t))
2. Argininosuccinate synthase. All metabolites are cytoplasmic. For the AAS reaction the symbols cit(t), citR(t), ATP(t),
Asp(t), PP
i
(t), AMP(t), as(t), Arg(t), ArgR(t) and ArgQ(t) denote citrulline, radioactive citrulline, ATP, aspartate,
pyrophosphate, AMP, argininosuccinate, arginine, radioactive arginine and exogenous arginine, respectively. K
I,Arg
is the
inhibition constant for arginine.
v
ASS
¼
k
1;ASS
k
3;ASS
k
5;ASS
k
7;ASS
k
9;ASS
k
11;ASS
cit(t) ATP(t) Asp(t) À k
2;ASS
k
4;ASS
k
6;ASS
k
8;ASS
k
10;ASS
k
12;ASS
PP
i
(t) AMP(t) as(t)
1 þ
Arg(t) + ArgR(t) + ArgQ(t)
K
I;Arg
denominator
ASS
[ASS]
where
denominator
ASS
= k
2;ASS
k
4;ASS
k
9;ASS
k
11;ASS
(k
6;ASS
þ k
7;ASS
)+k
1;ASS
k
4;ASS
k
6;ASS
k
8;ASS
k
11;ASS
(cit(t)
þ citR(t)) PP
i
(t) þ k
1;ASS
k
4;ASS
k
9;ASS
k
11;ASS
(k
6;ASS
þ k
7;ASS
) (cit(t) þ citR(t))
þ k
2;ASS
k
5;ASS
k
7;ASS
k
9;ASS
k
12;ASS
Asp(t) (as(t) þ asR(t)) þ k
2;ASS
k
5;ASS
k
7;ASS
k
9;ASS
k
11;ASS
Asp(t)
þ k
1;ASS
k
3;ASS
k
6;ASS
k
8;ASS
k
11;ASS
(cit(t) þ citR(t)) ATP(t) PP
i
(t) þ k
1;ASS
k
3;ASS
k
9;ASS
k
11;ASS
(k
6;ASS
+k
7;ASS
) (cit(t)
þ citR(t)) ATP(t) þ k
1;ASS
k
4;ASS
k
6;ASS
k
8;ASS
k
10;ASS
(cit(t) þ citR(t)) PP
i
(t) AMP(t)
þ k
1;ASS
k
5;ASS
k
7;ASS
k
9;ASS
k
11;ASS
ðcitðtÞþcitRðtÞÞAspðtÞþk
3;ASS
k
5;ASS
k
7;ASS
k
9;ASS
k
12;ASS
ATP(t) Asp(t) (as(t)
þ asR(t)) þ k
3;ASS
k
5;ASS
k
7;ASS
k
9;ASS
k
11;ASS
ATP(t) Asp(t) þ k
2;ASS
k
5;ASS
k
7;ASS
k
10;ASS
k
12;ASS
Asp(t) AMP(t) (as(t)
þ asR(t)) + k
1;ASS
k
3;ASS
k
5;ASS
(k
7;ASS
k
9;ASS
þ k
7;ASS
k
11;ASS
+ k
9;ASS
k
11;ASS
) (cit(t) þ citR(t)) ATP(t) Asp(t)
þ k
1;ASS
k
3;ASS
k
5;ASS
k
8;ASS
k
11;ASS
(cit(t) þ citR(t)) ATP(t) Asp(t) PP
i
(t) þ k
2;ASS
k
4;ASS
k
6;ASS
k
8;ASS
k
11;ASS
PP
i
(t)
þ k
1;ASS
k
3;ASS
k
5;ASS
k
7;ASS
k
10;ASS
(cit(t) þ citR(t)) ATP(t) Asp(t) AMP(t)
þ k
2;ASS
k
4;ASS
k
9;ASS
k
12;ASS
(k
6;ASS
+k
7;ASS
) (as(t) þ asR(t))+k
1;ASS
k
3;ASS
k
6;ASS
k
8;ASS
k
10;ASS
(cit(t)
þ citR(t)) ATP(t) PP
i
(t) AMP(t) þ k
2;ASS
k
4;ASS
k
6;ASS
k
8;ASS
k
10;ASS
PP
i
(t) AMP(t)
þ k
3;ASS
k
5;ASS
k
7;ASS
k
10;ASS
k
12;ASS
ATP(t) Asp(t) AMP(t) (as(t)+asR(t))
þ k
2;ASS
k
4;ASS
k
6;ASS
k
8;ASS
k
12;ASS
PP
i
(t) (as(t) þ asR(t)) + k
3;ASS
k
6;ASS
k
8;ASS
k
10;ASS
k
12;ASS
ATP(t) PP
i
(t) AMP(t)
 (as(t) + asR(t)) þ k
2;ASS
k
4;ASS
k
10;ASS
k
12;ASS
(k
6;ASS
þ k
7;ASS
) AMP(t) (as(t) + asR(t))
þ k
2;ASS
k
5;ASS
k
8;ASS
k
10;ASS
k
12;ASS
Asp(t) PP
i
(t) AMP(t) (as(t) + asR(t))
þ k
8;ASS
k
10;ASS
k
12;ASS
(k
2;ASS
k
4;ASS
+ k
2;ASS
k
6;ASS
þ k
4;ASS
k
6;ASS
)PP
i
(t) AMP(t) (as(t) + asR(t))
þ k
1;ASS
k
3;ASS
k
5;ASS
k
8;ASS
k
10;ASS
(cit(t) þ citR(t)) ATP(t) Asp(t) PP
i
(t) AMP(t)
þ k
3;ASS
k
5;ASS
k
8;ASS
k
10;ASS
k
12;ASS
ATP(t) Asp(t) PP
i
(t) AMP(t) (as(t) + asR(t))
3. Argininosuccinate lyase. All metabolites are cytoplasmic. For the ASL reaction the symbols as(t), asR(t), fum(t), Arg(t),
ArgR(t) and ArgQ(t) denote argininosuccinate, radioactive argininosuccinate, fumarate, arginine, radioactive arginine, and
exogenous arginine, respectively. ÔfmÕ is the free-mixing factor, given a value between 0 and 1. Note that the only term in the
denominator that this effects is ArgQ(t), and that fm does not appear in the inhibition of the ASS reaction (above).
v
ASL
=
(k
1;ASL
k
3;ASL
k
5;ASL
as(t)) À (k
2;ASL
k
4;ASL
k
6;ASL
fum(t) Arg(t))
denominator
ASL
[ASL]
3960 A. D. Maher et al. (Eur. J. Biochem. 270) Ó FEBS 2003
denominator
ASL
= k
5
(k
2
+ k
3
)+k
1
(k
3
+ k
5
) (as(t) þ asR(t)) + k
2
k
4
fum(t) + k
6
(k
2
+ k
3
) (Arg(t) þ ArgR(t)
þ fm*ArgQ(t)) + k
4
k
6
fum(t) (Arg(t) þ ArgR(t) + fm*ArgQ(t)) þ k
1
k
4
(as(t) + asR(t)) fum(t)
4. Arginase. All metabolites in this reaction are cytoplasmic. Note, however, that an identical reaction exists for extracellular
arginase in the model. Here Arg(t), ArgR(t), ArgQ(t) and orn(t) stand for arginine, radioactive arginine, exogenous arginine
and cytoplasmic ornithine, respectively.
v
Arginase
=
k
1;Arginase
k
3;Arginase
k
4;Arginase
Arg(t)
denominator
Arginase
[Arginase]
where
denominator
Arginase
= k
4;Arginase
(k
2;Arginase
+ k
3;Arginase
) þ k
5;Arginase
(k
2;Arginase
+ k
3;Arginase
) orn(t)
þ k
1;Arginase
(k
3;Arginase
+ k
4;Arginase
) (Arg(t) þ ArgR(t) + fm*ArgQ(t))
Ó FEBS 2003 Modelling to predict urea cycle kinetic mechanisms (Eur. J. Biochem. 270) 3961