Báo cáo Y học: Subsite mapping of the binding region of a-amylases with a computer program ppt
Bạn đang xem bản rút gọn của tài liệu. Xem và tải ngay bản đầy đủ của tài liệu tại đây (315.6 KB, 6 trang )
Subsite mapping of the binding region of a-amylases
with a computer program
Gyo¨ ngyi Gye
´
ma
´
nt
1
, Gyo¨ rgy Hova
´
nszki
2
and Lili Kandra
1
1
Institute of Biochemistry, Faculty of Sciences, University of Debrecen, Hungary,
2
Department of Agricultural Chemistry,
Faculty of Agriculture, University of Debrecen, Hungary
A computer program has been evaluated for subsite map
calculations of depolymerases. The program runs in
WIN-
DOWS
and uses the experimentally determined bond cleavage
frequencies (BCFs) for determination of the number of
subsites, the position of the catalytic site and for calculation
of subsite binding energies. The apparent free energy values
were optimized by minimization of the differences of the
measured and calculated BCF data. The program called
SUMA
(SUbsite Mapping of a-Amylases) is freely available
for research and educational purposes via the Internet
(E-mail: ).
The advantages of this program are demonstrated
through a-amylases of different origin, e.g. porcine pancre-
atic a-amylase (PPA) studied in our laboratory, in addition
to barley and rice a-amylases published in the literature.
Results confirm the popular ‘five subsite model’ for PPA
with three glycone and two aglycone binding sites. Calcula-
tions for barley a-amylase justify the ‘6 + 2 + (1) model’
prediction. Thebinding areaof barleya-amylase is composed
ofsix glycone, two aglycone binding sites followed by a barrier
subsite at the reducing end of the binding site. Calculations for
rice a-amylase represent an entirely new map with a
‘(1) + 2 + 5 model’, where ‘(1)’ is a barrier subsite at the
nonreducing end of the binding site and there are two glycone
and five aglycone binding sites. The rice model may be
reminiscent of the action of the bacterial maltogenic amylase,
that is, suggesting an exo-mechanism for this enzyme.
Keywords: subsite mapping; a-amylase; action pattern;
WINDOWS
program.
X-ray crystallographic analysis, where the proteins in the
crystalline state are free or complexed to a substrate-
analogue, is a powerful method for mapping the active site
of an a-amylase. However, these data can vary according to
the crystalline varieties (free enzyme, enzyme-substrate/
inhibitor complexes) or are not available at all. Therefore,
the use of modified, low-molecular mass substrates could be
an effective way to elucidate the number of subsites in the
active site area of a-amylases.
In this study we have invoked the popular ‘subsite
model’, which was introduced by Phillips [1], to account for
the enzymatic properties of a-amylases such as PPA, barley
and rice a-amylases.
The amylase subsite model [2] depicts the substrate
binding region of the enzyme to be a tandem array of
subsites. Each subsite is complementary to, and interacts
with a substrate monomer unit. The subsites are labelled
from the catalytic site, with negative numbers for subsites to
the left (non reducing end side) and positive numbers to the
right (reducing end side) according to the proposed nomen-
clature of Davies et al. [3]. There are a number of different
ways in which an oligomer substrate can interact with these
subsites. A substrate oligomer can bind nonproductively so
that a susceptible bond does not extend over the catalytic
amino acids of the enzyme; alternatively, the substrate can
bind productively so that a susceptible bond lies over the
catalytic site, in which case the bond is cleaved.
The process of quantifying the subsite model is referred to
as subsite mapping. To completely map the binding region
of a-amylases, we determined the number of subsites,
located the position of the catalytic amino acids within the
subsites and determined the binding energies of each
subsite-substrate monomer unit. The method of subsite
mapping originates from the early 1970s. Quantitative
theories of the action pattern of amylase in terms of subsite
affinities were proposed independently by Hiromi et al.[4]
and Allen & Thoma [5] and later Suganuma et al.[6].
Hiromi proposed a kinetic method for evaluating the subsite
affinities from the dependence of hydrolytic rate on the
degree of polymerization (DP) of substrates, while Allen &
Thoma developed a method based on the product analysis.
Both methods have their advantages and disadvantages.
The product analysis method of Allen & Thoma is suitable
for endo-amylases, but can not be applied to exo-amylases.
The kinetic method of Hiromi et al. is especially useful for
exo-amylases, but its application to endo-amylases requires
input from product analysis. The Suganuma method is
based on the calculation of the kinetic parameter (k
0
/K
m
)
and the BCF data at sufficiently low substrate concentra-
tion, where secondary attacks on the substrate can be
ignored. Subsite maps for Taka-amylase A were evaluated
by all three authors and quite similar subsite structures were
Correspondence to G. Gye
´
ma
´
nt, Institute of Biochemistry, Faculty of
Sciences, University of Debrecen, H-4010 Debrecen, PO Box 55,
Hungary. Fax: +36 52 512913, Tel.: +36 52 512900,
E-mail:
Abbreviations: BCF, bond cleavage frequency; BLA, Bacillus licheni-
formis a-amylase; CNP, 2-chloro-4-nitrophenyl group; DP, degree of
polymerization; Gn, maltooligosaccharide of n glucopyranoside units;
pNP, 4-nitrophenyl group; PPA, porcine pancreatic a-amylase.
Enzymes: a-amylase (EC 3.2.1.1); porcine pancreatic a-amylase
(AMYP_PIG); barley a-amylase (AMY2_HORVU); rice a-amylase.
(Received 20 June 2002, revised 22 August 2002,
accepted 29 August 2002)
Eur. J. Biochem. 269, 5157–5162 (2002) Ó FEBS 2002 doi:10.1046/j.1432-1033.2002.03212.x
obtained [5,6]. The Thoma method was recently used for
subsite mapping of endopolygalacturonases [7]. We have
been studying the action pattern of endo-amylases by
product analysis, therefore the procedure of Allen & Thoma
[5] was applied for subsite mapping and our computer
program was based on their theory.
Subsite mapping is simplified for exo-enzymes because
there is only one productive binding mode for each
substrate. However, endo-acting enzymes form more pro-
ductive binding modes resulting in a complex product
pattern. The relative rate of formation of each product is
called bond cleavage frequency (BCF), which gives infor-
mation about the subsite-binding energy. By using BCFs for
a series of oligomeric substrates, it is possible to calculate the
subsite binding energy for each subsite on the enzyme
binding region, with the exception of the two subsites
adjacent to the catalytic site which are occupied by all
productive complexes. A detailed description of the rela-
tionships can be found in the works of Allen & Thoma [5].
For subsite map calculation the preferred procedure is
that suggested by Allen & Thoma [5]:
(a) Establish experimental conditions where secondary
reactions (transglycosylation, secondary attack) are insigni-
ficant.
(b) Use end-labelled substrates to determine quantitative
BCF for chain lengths that are large enough to span the
entire binding region.
(c) Examine bond cleavage frequencies to estimate the
number of subsites and the position of the catalytic site.
(d) Apply a minimization process to test the differences of
measured and calculated BCF data.
The present studies were aimed at developing a computer
simulation of the a-amylase subsite model. By using a
minimization routine, the computer program is capable of
predicting a subsite map from experimental parameters.
Only a few subsite maps have been found in the
literature and detailed knowledge about subsite architec-
ture of these well studied enzymes is scarce. Therefore, we
hope that our efforts meet a long felt need concerning
subsite mapping.
Subsite mapping has been evaluated for PPA, an
a-amylase studied by us earlier. Also an attempt has been
made to use this program for subsite mapping of other
a-amylases found in the literature. Evaluations of subsite
maps of rice and barley a-amylases are thus also presented.
MATERIALS AND METHODS
SUMA
software: subsite mapping of amylases
This software calculates the apparent binding energies on
the basis of the measured bond cleavage frequencies.
The calculations are based on the equation:
DG
l þ 1
À DG
X
¼ÀRT ln P=P
l þ 1
;
where DG
i+1
is the subsite binding energy of the subsite i
+1,DG
X
is the subsite binding energy of the subsite x, and
P
i
and P
i+1
are the bond cleavage frequencies of the product
which are produced from the binding mode in which the
reducing end of the substrate are connected to subsite i and i
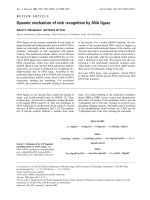
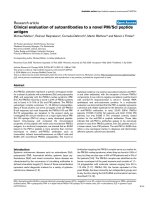
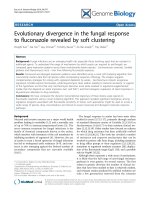
+ 1, respectively. Fig. 1 shows the structure of the program.
The supposed number of subsites and the position of the
cleavage site can vary according to the calculations. The
primary calculated subsite energy values can be refined to the
best agreement of the measured and recalculated BCF data
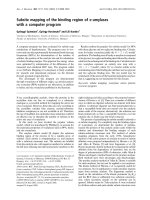
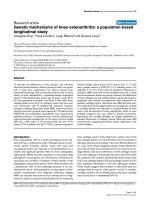
by the iteration. Fig. 2 shows the flow diagram of iteration.
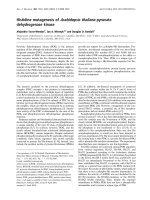
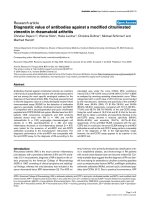
The graphical illustration of iteration appears in the ‘Chart’
window as a line chart (Fig. 3). The subsite energies are
represented in ‘Chart’ window as subsite map (column or
3D-column chart) and are listed in ‘Note’. The binding
energies can be calculated and BCF data can be recalculated
at temperatures other than those used for the measurement.
Advantages of
SUMA
Unlimited input data possibilities. Simple usage.
WINDOWS
compatible, help in the menu. Note is used for saving,
editing and printing calculated data. Graphical illustrations
(minimization, subsite map) make the results clearer. BCFs
can be calculated for substrates longer or shorter than those
measured earlier.
SUMA
is freely available for research and educational
purposes (E-mail: ).
Action patterns of a-amylases
Action patterns are summarized in the tables below: Table 1
contains our measurements resulting in the product ratios
for PPA [8].
Tables 1, 2 and 3 show the ratio of products of PPA [9],
barley [10] and rice [11] a-amylases found in the literature.
RESULTS AND DISCUSSION
The application of homologous oligomeric substrates is an
effective way to explore the nature of the binding site and
the process of catalysis for a-amylases. Although the overall
structure and the tertiary folding of the polypeptide chains
of different a-amylases have been determined [12], less is
known about the differences in the action of a-amylases on
the homologous maltooligosaccharide series and only a few
subsitemapshavebeenevaluatedfora-amylases until now
[5,6,13]. Our b-CNP-maltooligosaccharides have turned out
to be good substrates for further studies of the action
pattern and subsite mapping of PPA and BLA [8,14].
Compared with other substrate series so far reported, for
example, maltooligosaccharides [15] or a-NP-maltooligo-
saccharides [10], the CNP-maltooligosaccharides, which are
b-glycosides, are unique as their preparation and use in the
mapping of the active centre of a-amylases were reported by
our laboratory for the first time [8]. This b-linkage is stable
and is not hydrolysed by a-amylases therefore, the products
of hydrolysis are always b-glycosides.
Selection of these glycosides as substrates has been based
on their size (DP 4–10) and good yields when synthesized
from CDs [16] or via chemoenzymatic procedures [17].
5158 G. Gye
´
ma
´
nt et al. (Eur. J. Biochem. 269) Ó FEBS 2002
Subsite mapping of PPA–‘five subsite model’
is confirmed
Porcine pancreatic a-amylase is one of the most exhaustively
studied model enzymes of mammalian a-amylases
[2,8,18,19]. A ‘five subsite model’ was suggested by Robyt
and French [2] based upon kinetic studies of the action
pattern of PPA on maltooligosaccharides of DP 4–8. Our
findings were based on the action pattern of PPA on three
different series of b-maltooligosaccharide glycosides and
they confirmed the theory of five subsites [8]. However, the
crystal structure of PPA isozyme II, in complex with the
carbohydrate inhibitor acarbose, demonstrated the presence
of six contiguous subsites for the binding of glucose units in
the active centre of PPA [18].
In this study we made a subsite map evaluation by using
the BCF data measured and published on CNP b-maltoo-
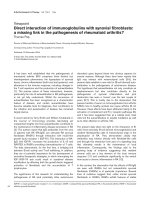
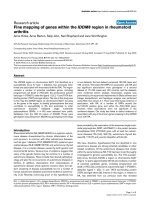
ligosides DP 4–8 [8]. Figure 4 shows the apparent energy of
subsites confirming the ‘five subsite model’ of PPA.
A negligible apparent binding energy at subsite )4
()0.8 kJÆmol
)1
) might indicate a binding subsite, but this
is not convincing at all.
The computer modeling on the two different maltooligo-
saccharide series resulted in the same subsite map for PPA.
As it can be seen in Fig. 4, the calculated binding energies
from BCF values on linear maltooligosaccharides DP 4–8
[9] are in very good agreement with the energy data
calculated from BCF values on CNP b-maltooligosides DP
4–8. The negligible binding energy ()0.5 kJÆmol
)1
) at subsite
()4) does not confirm the presence of an additional subsite.
Results confirm that the five subsites, originally assumed
from experimental data, are correct and BCF are measured
correctly within experimental error [8].
Finally, the two subsite maps, corresponding to each
other, verify that the presence of the CNP at the reducing
end of the substrates does not influence the apparent
binding energies.
Subsite mapping of barley a-amylase isozyme 1 –
justification of a ‘6 + 2’ model
Action patterns of barley a-amylase isozymes 1 and 2 were
published by MacGregor et al. [10] on maltooligosaccha-
rides and their pNP a-glycosides of DP 4–7. These isozymes
release not only pNP-containing products but also pNP
from pNP-G
4
,pNP-G
6
and pNP-G
7
substrates which are
considered for the explanation of substrate bindings. The
subsite affinities were not calculated in this work. The
authors made proposals for the type and strength of
interactions. A ‘7 + 3 model’ was suggested for barley
a-amylase isozyme 1, where the energy of interaction is
favourable at subsites )6 and +2, less favourable at subsite
)7 and unfavourable at subsite +3. They assume further
unfavourable energy of interaction at subsite )5.
We made a calculation for BCF data using the published
ratio of pNP-glycoside products, considering only the
interactions between glucose units and subsites. Our
subsite model proposed for barley a-amylase isozyme 1
(Fig. 5) partly confirms the suggestion by MacGregor et al.
[10].
Fig. 1. Structure of the computer program.
Ó FEBS 2002 Subsite mapping of a-amylases (Eur. J. Biochem. 269) 5159
The calculated binding energy at subsite )6()12.2
kJÆmol
)1
) indicates a remarkably good interaction with the
monomer unit of the substrates compared with the other
subsite energies. An unfavourable interaction (+2.7
kJÆmol
)1
) could be found at subsite +3 suggesting the
presence of a barrier subsite. Unlikely, the binding energy of
the interaction was zero at subsite )7, and rather unfa-
vourable at subsite )3(+0.4kJÆmol
)1
) than at subsite )5
()2.4 kJÆmol
)1
). On the basis of these affinities, the total
number of subsites for barley a-amylase is nine; six glycone
binding sites and two aglycone binding sites followed by a
barrier subsite.
The action of barley a-amylase on amylose as substrate
was also studied earlier by MacGregor & MacGregor [20]
and a ‘6 + 2 model’ was proposed. Our calculations seem
to justify this structure with an extra barrier subsite.
There is also another study on the action pattern of barley
enzyme including calculation of subsite affinities which was
based on the Suganuma method [21]. This calculation
suggests a ‘6 + 4 model’ for barley amylase, where the
energy of interaction is very favourable at subsite )6. These
results are in a good agreement with our calculations with the
only exception relating to the +3 subsite. The group of
Marchis–Mouren [21] found a low affinity at subsite +3,
however, our calculations show a barrier site for the same
subsite. The reason of this disagreement might be the absence
of minimization or the relatively short substrates used.
There is a very interesting proposal of these authors; the
active center might contain two parts, one comprising
subsites )2, )1, +1, +2, +3, +4 and the second part
comprising subsites )4, )5, )6. Our results are consistent
with this proposal; the small positive binding energy at
subsite )3 may be the border between the two parts.
Subsite mapping of rice isozyme Amy 3D – first subsite
mapping, assuming a ‘2 + 5 model’
The action pattern of rice isozyme Amy 3D on pNP
a-maltooligosides of DP 3–6 was published quite recently
[11]. Amy 3D isozyme was expressed by Saccharomyces
cerevisiae and produced substantial amounts of glucose
from starch. No suggestion for the structure of the active
site was given.
Our subsite model (Fig. 6) calculated for this rice
a-amylase isozyme shows a very interesting and unusual
profile. A barrier subsite exists at the nonreducing end of the
binding site (+5.7 kJÆmol
)1
) followed by two glycone and
five aglycone binding sites. Interestingly, we found unfa-
vourable energy of interaction (+2.7 kJÆmol
)1
)atsubsite
+3 which was compensated by the high ()6.6 kJÆmol
)1
)
favourable energy of interaction at subsite +5.
Our study serves as the first characterization of the
substrate binding site of rice isozyme Amy 3D. We describe
the first subsite map with the calculated apparent binding
energies. We suggest that the binding region of rice isozyme
Amy 3D is composed of at least eight subsites; two glycone
binding sites )2, )1 with an additional barrier subsite )3
and five aglycone binding sites. The presence of the barrier
subsite at the end of the glycone binding site is suggesting an
exo-mechanism for this enzyme. The action pattern also
indicates the exo-mechanism, because the glucose or malt-
ose as main products are released from the non reducing end
of each substrate.
CONCLUSIONS
The present paper describes a method, developed for the
quantitative determination of subsite maps of a-amylases.
Complete subsite maps have been evaluated by using the
experimentally determined BCFs for the characterization of
the binding region of PPA [8] and BLA [14]. The product
Fig. 2. Flow diagram of iteration. M and N, cycle variable; E, number of
subsites; I
F
, first iteration value; I
L
, last iteration value; I
S
, step iteration
value; SG, the sum of the binding energies of the occupied sites;
%
calculated
, the bond cleavage frequency calculated according to the
subsite map; Difference, the sum of the difference between the measured
and calculated data. During the iteration we look for the smallest
possible value of ‘Difference’; DG
M
, the energy corresponding to the
smallest ‘Difference’.
Fig. 3. Graphical illustration of iteration for )3 subsite of BLA.
Apparent binding energy value ()5.1 kJÆmol
)1
)canbefoundatthe
minimum of ‘Difference’.
5160 G. Gye
´
ma
´
nt et al. (Eur. J. Biochem. 269) Ó FEBS 2002
patterns have been determined by HPLC utilizing a
homologous series of CNP-substituted maltooligosaccha-
rides of DP 4–10 as model substrates.
Simultaneously, a computer program has also been
developed using a minimization routine to establish a
subsite map for PPA and BLA.
End-labelled substrates with chain lengths large enough
to span the entire binding region of PPA and BLA met the
requirements of getting the best subsite map. The results
confirm that the nine subsites for BLA and the five subsites
for PPA, originally assumed from our experimental data,
are correct and bond-cleavage frequencies are predicted
correctly.
Table 1. BCFs of PPA [8,9]. Hydrolysis conditions for CNP-glycoside products: 0.5 m
M
substrate, 50 m
M
Hepes buffer (pH: 6.9), 37 °C.
Hydrolysis conditions for non-CNP products: 0.5 m
M
substrate, 50 m
M
sodium phosphate buffer (pH: 6.8), 30 °C.
Products (mol% of CNP-glycoside products) [8] Products (mol% of products) [9]
Substrate G
1
-CNP G
2
-CNP G
3
-CNP G
4
-CNP G
5
-CNP G
1
G
2
G
3
G
4
G
5
G
4
(-CNP) 38 62 36 64
G
5
(-CNP) 100 100
G
6
(-CNP) 54 46 54 46
G
7
(-CNP) 44 34 22 41 33 26
G
8
(-CNP) 25 40 25 10 28 37 24 11
Table 2. BCFs of barley a-amylase isozyme [10]. Hydrolysis condi-
tions:5mgmL
)1
substrate, 0.1
M
acetate buffer (pH: 5.5), 35 °C.
Products (mol% of NP-glycoside products)
Substrate G
1
-pNP G
2
-pNP G
3
-pNP G
4
-pNP G
5
-pNP
G
4
-pNP 24 63 13
G
5
-pNP 40 44 13 2
G
6
-pNP 42 26 12 10 10
G
7
-pNP 98 2
Table 3. BCFs of rice a-amylase Amy3D [11]. Hydrolysis conditions:
4m
M
substrate, 50 m
M
sodium acetate buffer (pH: 5.5), 30 °C.
Products (mol% of NP-glycoside products)
Substrate G
1
-pNP G
2
-pNP G
3
-pNP G
4
-pNP G
5
-pNP
G
3
-pNP 56 44
G
4
-pNP 9 88 3
G
5
-pNP 10 19 60 11
G
6
-pNP 28 72
Fig. 4. Subsite maps for porcine pancreatic a-amylase (PPA). The solid
bars are related to CNP-modified maltooligosaccharide substrates [8]
and the open bars depict the subsite map with linear maltooligosac-
charides [9]. The apparent binding energies were calculated according
to the data of Table 1. The arrow indicates the location of hydrolysis.
The reducing end of maltooligomers situated at the right hand of the
subsite map. Negative energy values indicate bindings between the
enzyme and aligned glucopyranosyl residues, while positive values
indicate repulsion.
Fig. 5. Subsite map of barley a-amylase isoenzyme. The binding
affinities were calculated according to the data of Table 2.
Fig. 6. Subsite map of rice a-amylase isoenzyme (
AMY
3
D
). The binding
affinities were calculated according to the data of Table 3.
Ó FEBS 2002 Subsite mapping of a-amylases (Eur. J. Biochem. 269) 5161
5162 G. Gye
´
ma
´
nt et al. (Eur. J. Biochem. 269) Ó FEBS 2002
We also show how this computer program can be applied
to BCF data accessible in the literature to ascertain the
number of subsites and establish the binding energies of
subsite-substrate monomer units of different a-amylases.
However, if the substrates are not long enough, as we found
for barley and rice amylases DP 4–7, DP 3–6, respectively,
the results should be interpret with care. To confirm the
subsite maps of barley and rice amylases, it is necessary to
re-examine BCFs for substrates having a longer chain
lengths than that of the binding site.
ACKNOWLEDGEMENTS
This work was supported by the grants from OTKA T032005 and
FKFP-0426/2000.
REFERENCES
1. Phillips, D. (1966) The three-dimensional structure of an enzyme
molecule. Sci. Am. 215, 78–90.
2. Robyt, J.F. & French, D. (1970) Multiple attack and polarity of
action of porcine pancreatic a-amylase. Arch. Biochem. Biophys.
138, 662–670.
3. Davies, G.J., Wilson, K.S. & Henrissat, B. (1997) Nomenclature
for sugar-binding subsites in glycosyl hydrolases. Biochem. J. 321,
557–559.
4. Hiromi, K. (1970) Interpretation of dependency of rate parameters
on the degree of polymerization of substrate in enzyme-catalyzed
reactions. Evaluation of subsite affinities of exo-enzyme. Biochem.
Biophys. Res. Commun. 40, 1–6.
5. Allen, J.D. & Thoma, J.A. (1976) Subsite mapping of enzymes.
Biochem. J. 159, 105–132.
6. Suganuma, T., Matsuno, R., Ohnishi, M. & Hiromi, K. (1978) A
study of the mechanism of action of Taka-amylase A
1
on linear
oligosaccharides by product analysis and computer simulation.
J. Biochem. 84, 293–316.
7. Benen, J.A.E., Kester, H.C.M. & Visser, J. (1999) Kinetic char-
acterization of Aspergillus niger N400 endopolygalacturonases I,
II, and C. Eur. J. Biochem. 259, 577–585.
8. Kandra, L., Gye
´
ma
´
nt,G.&Lipta
´
k, A. (1997) Action pattern
of porcine pancreatic alpha-amylase on three different series of
b-maltooligosaccharide glycosides. Carbohydr. Res. 298,237–
242.
9. Brayer, G.D., Sidhu, G., Maurus, R., Rydberg, E.H., Braun, C.,
Wang, Y., Nguyen, N.T., Overall, C.M. & Withers, G.S. (2000)
Subsite mapping of the human pancreatic a-amylase active site
through structural, kinetic, and mutagenesis techniques. Bio-
chemistry 39, 4778–4791.
10. MacGregor, A.W., Morgan, J.E. & MacGregor, E.A. (1992) The
action of germinated barley alpha-amylases on linear mal-
todextrins. Carbohydr. Res. 227, 301–313.
11. Terashima, M., Hayashi, N., Thomas, B.R., Rodriguez, R.L. &
Katoh, S. (1996) Kinetic parameters of two rice a-amylase iso-
zymes for oligosaccharide degradation. Plant Sci. 116, 9–14.
12. MacGregor, E.A., Janee
`
ek, S
ˇ
. & Svensson, B. (2001) Relationship
of sequence and structure to specificity in the a-amylase family of
enzymes. Biochim. Biophys. Acta 1546, 1–20.
13. Thoma, J.A., Brothers, C. & Spradlin, J. (1971) Subsite mapping
of enzymes. Studies on Bacillus subtilis amylase. Biochemistry 9,
1768–1775.
14. Kandra, L., Gye
´
ma
´
nt,G.,Remenyik,J.,Hova
´
nszki, G. & Lipta
´
k,
A. (2002) Action pattern and subsite mapping of Bacillus licheni-
formis a-amylase (BLA) with modified maltooligosaccharide
substrates. FEBS Lett. 518, 79–82.
15. Haegele, E.O., Schaich, E., Rauscher, E., Lehmann, P. & Grassl,
M. (1981) Action pattern of human pancreatic alpha-amylase
on maltoheptaose, a substrate for determining alpha-amylase in
serum. J. Chromatogr. 223, 69–84.
16. Farkas, E., Ja
´
nossy, L., Harangi, J., Kandra, L. & Lipta
´
k, A.
(1997) Synthesis of chromogenic substrates of a-amylases on a
cyclodextrin basis. Carbohydr. Res. 303, 407–415.
17. Kandra, L., Gye
´
ma
´
nt, G., Pa
´
l, M., Petro
´
, M., Remenyik, J. &
Lipta
´
k, A. (2001) Chemoenzymatic synthesis of 2-chloro-4-
nitrophenyl b-maltoheptaoside acceptor-products using glycogen
phosphorylase b. Carbohydr. Res. 333, 129–136.
18. Gilles, C., Astier, J P., Marchis-Mouren, G., Cambillan, C. &
Payan, F. (1996) Crystal structure of pig pancreatic a-amylase
isoenzyme II, in complex with the carbohydrate inhibitor acar-
bose. Eur. J. Biochem. 238, 561–569.
19. Qian, M., Spinelli, S., Driguez, H. & Payan, F. (1997) Structure of
a pancreatic alpha-amylase bound to a substrate analogue at 2.03
A
˚
resolution. Protein Sci. 6, 2285–2296.
20. MacGregor, E.A. & MacGregor, A.W. (1985) A model for the
action of cereal alpha-amylases on amylose. Carbohydr. Res. 142,
223–236.
21. Ajandouz, E.H., Abe, J., Svensson, B. & Marchis-Mouren, G.
(1992) Barley malt-alpha-amylase. Purification, action pattern,
and subsite mapping of isozyme 1 and two members of the iso-
zyme 2 subfamily using p-nitrophenylated maltooligosaccharide
substrates. Biochim. Biophys. Acta 1159, 193–202.