Báo cáo Y học: Structural analysis of deacylated lipopolysaccharide of Escherichia coli strains 2513 (R4 core-type) and F653 (R3 core-type) pot
Bạn đang xem bản rút gọn của tài liệu. Xem và tải ngay bản đầy đủ của tài liệu tại đây (371.49 KB, 10 trang )
Structural analysis of deacylated lipopolysaccharide
of
Escherichia coli
strains 2513 (R4 core-type)
and F653 (R3 core-type)
Sven Mu¨ ller-Loennies, Buko Lindner and Helmut Brade
Borstel Research Center, Center for Medicine and Biosciences, Borstel, Germany
Lipopolysaccharide (LPS) of Escherichia coli strain 2513 (R4
core-type) yielded after alkaline deacylation one major
oligosaccharide by high-performance anion-exchange chro-
matography (HPAEC) which had a molecular mass of
2486.59 Da as determined by electrospray ionization mass
spectrometry. This was in accordance with the calculated
molecular mass of a tetraphosphorylated dodecasaccharide
of the composition shown below. NMR-analyses identified
the chemical structure as
where
L
-a-
D
-Hep is
L
-glycero-a-
D
-manno-heptopyranose
and Kdo is 3-deoxy-a-
D
-manno-oct-2-ulopyranosylonic
acid and all hexoses are present as
D
-pyranoses.
We have also isolated the complete core-oligosaccha-
rides of E. coli F653 LPS for which only preliminary data
were available and investigated the deacylated LPS by
NMR and MS. The proposed structure determined pre-
viously by methylation analysis was confirmed and is
shown below.
In addition we have quantified the side-chain heptose
substitution of the inner core with GlcpN( 30%) and
confirmed that this sugar is only present when the phosphate
at the second
L
,
D
-Hepp residue is absent.
Keywords: Escherichia coli; lipopolysaccharide; R3 core-
type; R4 core-type; structural analysis.
Correspondence to S. Mu
¨
ller-Loennies, Borstel Research Center, Parkallee 22, 23845 Borstel, Germany.
Fax: + 49 4537 188 419, Tel.: + 49 4537 188 467, E-mail:
Abbreviations: DEPT, Distortionless enhancement by polarization transfer;
L
,
D
-Hep,
L
-glycero-a-
D
-manno-heptose; HPAEC, high-performance
anion exchange chromatography; Kdo, 3-deoxy-a-
D
-manno-oct-2-ulosonic acid; LPS, lipopolysaccharide.
(Received 4 September 2002, accepted 22 October 2002)
Eur. J. Biochem. 269, 5982–5991 (2002) Ó FEBS 2002 doi:10.1046/j.1432-1033.2002.03322.x
Lipopolysaccharide (LPS) is the major component of the
outer leaflet of the outer membrane of Gram-negative
bacteria [1]. LPS of enterobacteria consist of three
domains, namely lipid A, core-region and O-antigen [2].
Due to its exposed location, it is the major target of the
humoral immune response in mammals and the lipid A
moiety is responsible for many of the pathological effects
seen in septic shock patients. Whereas the chemical
structure of the O-antigen is highly variable, the core-
region and lipid A show only a limited structural
variability within the same species. This prompted many
investigators to attempt the isolation of antibodies
directed against the conserved regions of LPS, i.e. lipid A
andcore-region(reviewedin[3]).Itwasassumedthat
these antibodies would be both cross-reactive and cross-
protective against different Gram-negative pathogens.
Whereas a cross-protective effect was described for a
polyclonal antiserum as early as in 1966 [4], all
subsequently isolated monoclonal antibodies failed to
show cross-reactivity in vitro and cross-protectivity in vivo
[3], except one reported by DiPadova et al.(mAb
WN1 222-5). This mAb recognized LPS from all tested
clinical isolates of E. coli, Salmonella,andShigella in
Western-blots and showed cross-protective effects in vivo
against endotoxic activities of LPS [5]. The cross-reacti-
vity was attributed to a common epitope located in the
inner core-region of these LPS. In order to verify this
assumption, we have determined the as yet unknown
chemical structures of those LPS that reacted with this
mAb.
The chemical structures of four E. coli core-oligosac-
charides (R1, R2, R3, and K-12) and two core-oligosac-
charides of S. enterica [2] are known. The chemical
structure of the E. coli R3 core-type was determined by
methylation analysis [6,7]. Complete core-oligosaccharides
were isolated and NMR chemical shift data were
determined for core-oligosaccharides of the R1 and R2
core-types [8] whereas the chemical structure of the inner
core-region of the E. coli R4 core-type was hitherto
unknown. The chemical structure of the outer core region
of the latter was determined by methylation analysis [9].
We have now isolated the complete core-oligosaccharides
and investigated the chemical structure of this LPS in
detail to understand the cross-reactivity of WN1 222-5.
Since these data are a prerequisite for NMR based
conformational analysis of the inner core region of
enterobacterial LPS and epitope mapping of WN1 222-5
we have in addition isolated the complete core-oligosac-
charides of E. coli F653 (R3-core) and determined NMR
chemical shift values.
MATERIALS AND METHODS
Bacteria and bacterial LPS
E. coli strains 2513 and F653 were cultivated and used for
the isolation of LPS by phenol/chloroform/petrolether-
extraction as reported [10].
Analytical methods
Neutral sugars, GlcN, Kdo and bound organic phosphate
were determined as described [11].
Preparation of deacylated LPS of
E. coli
2513
LPS (5 g) was de-O-acylated by mild hydrazinolysis [7]
(yield 3.84 g) and 400 mg of the latter were subjected to
alkaline de-N-acylation as described [12]. After neutraliza-
tion by addition of ion exchanger Amberlite IRA120 H
+
(Serva), 160 mg of the deacylated oligosaccharide fraction
(yield 217 mg) was subjected to high-performance anion-
exchange chromatography (HPAEC; eight runs of 20 mg
each) using a semipreparative CarboPak PA100 column
(9 · 250 mm) and a DX300 chromatography system (Dio-
nex, Germany). The main (fraction 2; oligosaccharide 1,
yield 31.44 mg) and the minor oligosaccharide (fraction 1;
oligosaccharide 2, yield 10.96 mg) were collected, neutral-
ized and desalted as described above by addition of
ion-exchanger followed by lyophilization. Conditions for
semipreparative and analytical HPAEC were as described
previously [13].
Preparation of deacylated LPS of
E. coli
F653
LPS (2.11 g) was de-O-acylated by mild hydrazinolysis
(yield 1.425 g) and 902.5 mg were further subjected to
alkaline de-N-acylation as above. The solution was neut-
ralized by addition of 8
M
HCl and extracted three times
with dichloromethane. Subsequent desalting was achieved
by gelfiltration on Sephadex G10 (2.5 · 65 cm) in 10 m
M
ammonium carbonate (yield 420 mg). A portion (417 mg)
of the desalted oligosaccharide mixture was subjected to
semipreparative HPAEC as described above. The sample
was redissolved in water at a concentration of 90 mgÆmL
)1
and 450 lL per run loaded onto the HPAEC column.
Elution and separation was achieved by a linear gradient of
2–600 m
M
NaOAc over a time of 70 min. Fractions were
analyzed by analytical HPAEC and appropriately com-
bined. Desalting was achieved by gelfiltration as described
above. Two pure oligosaccharides were obtained (fraction 1;
oligosaccharide 3, 145.22 mg; fraction 2; oligosaccharide 4,
70.7 mg).
NMR-spectroscopy
NMR-spectra were recorded of samples of deacylated LPS
(11 mg each of R4 oligosaccharides 1 and 2 and 10 mg
each of R3 oligosaccharides 3 and 4) in 0.5 mL solutions in
D
2
O using a Bruker DRX 600 Avance spectrometer
equipped with a multinuclear probehead with z-gradient.
Acetone served as a reference 2.225 p.p.m. (
1
H) and
31.5 p.p.m. (
13
C). All spectra were run at a temperature
of 300 K.
NMR of oligosaccharide 1 (R4 core). Two-dimensional
homonuclear
1
H,
1
H-COSY was performed with a double
quantum filter and time-proportional phase incrementation
(TPPI) (DQF-COSY). The Bruker
COSYDFTP
pulseprogram
was modified to allow water suppression with 10 Gaussian
shaped pulses of 100 ms defined by 1024 points during the
relaxation delay. Five-hundred and twelve experiments of
4096 data points each were recorded over a spectral width of
6.5 p.p.m. in each dimension. Prior to Fourier transforma-
tion F1 was zero-filled to 1024 data points.
TOCSY was performed at a spinlock field strength of
8 kHz for 75.15 ms using the Bruker
MLEVPRTP
pulse
Ó FEBS 2002 Chemical structure of E. coli R3 and R4 LPS (Eur. J. Biochem. 269) 5983
program and the same experimental parameters that were
used for TOCSY-ROESY (TORO).
A TORO-spectrum [14–17] was recorded as a two-
dimensional experiment using a fixed delay as the second
mixing time (ROESY-step). The spectrum was recorded
phase-sensitive by applying TPPI. Four-thousand and
ninety-six data points were recorded over 512 experiments
consisting of 40 scans each over a spectral width of 8 p.p.m.
in each dimension. Water suppression was achieved by
presaturation on resonance during the relaxation delay.
Prior to FT the data were multiplied by a shifted sine bell
function and zero-filled in F1, 1024 data points.
NOESY was recorded phase-sensitive using the Bruker
NOESYPRTP
pulse program. Four-thousand and ninety-six
data points in F2 and 512 experiments in F1 were recorded
over a spectral width of 10 p.p.m. in both dimensions. Prior
to Fourier transformation, the FID was multiplied with a
shifted sine bell window function and zero-filling was
applied in F1, 1024 points. The mixing time was 200 ms.
For heteronuclear
1
H,
13
C-NMR correlation spectroscopy
the Bruker standard pulse programs
INV
4
PRST
(HMQC),
INV
4
NDTP
(HMQC without decoupling during acquisition),
INV
4
MLPRTP
(HMQC-TOCSY),
INDECOBIMLTPPR
(DEPT-
HMQC-TOCSY), and
INV
4
LRNDPR
(HMBC) were used.
These spectra were recorded with 4096 data points in F2
and 512 experiments in F1 over spectral widths of 10 and
120 p.p.m, respectively. Zero-filling was applied to 1024
data points in F1. For TOCSY a spinlock period of 81 ms
was applied at a field strength of 8.3 kHz. For DEPT-
HMQC-TOCSY the sweep width was reduced to 15 p.p.m.
in F1 and 3.5 p.p.m. in F2. Two-hundred and fifty-six
experiments were recorded at 2048 data points per incre-
ment and a TOCSY mixing time of 67 ms. For HMBC, F1
was enlarged to 180 p.p.m. and the delay for the evolution
of long-range couplings was set to 50 ms.
31
P spectroscopy was performed after addition of NaOD
(Sigma) until all signals appeared as sharp singuletts. The
pD was then approximated using pH paper and found to be
pD 9.
31
P,
1
H-HMQC was performed using a modified Bruker
pulse program (
INVIPRTP
) which was using continuous wave
instead of composite pulse decoupling during acquisition.
The spectrum consisted of 128 experiments of 2048 data
points covering 10 p.p.m. in both dimensions. The delay for
evolution of couplings was adjusted for a
3
J
P,H
of 10 Hz
(d4 ¼ 25 ms).
NMR of oligosaccharides 3 and 4 (R3 core). DQF-
COSY and NOESY were recorded as described above. In
COSY the spectral width was reduced to 5.5 p.p.m. in each
dimension. TOCSY was performed using the DIPSI-2
composite pulse for spin-lock at a field strength of 7.8 kHz
and a spectral width of 5.5 p.p.m. in each dimension. Five-
hundred and twelve experiments were recorded consisting of
4096 data points each. Water presaturation was achieved by
a shaped pulse as described for DQF-COSY.
ROESY-TOCSY (ROTO) was performed as TORO (see
above) as a two-dimensional experiment but using a fixed
delay as the TOCSY mixing time. The spectrum was
recorded phase-sensitive by applying TPPI. Two-thousand
and forty-eight data points were recorded of 256 experi-
ments consisting of 32 scans each over a spectral width of
10 p.p.m. in each dimension. Water suppression was
achieved by presaturation on resonance during the relaxa-
tion delay. Prior to Fourier transformation, the data were
multiplied by a shifted sine bell function and zero-filled in
F1 and F2, 4096 and 512 data points, respectively. The spin-
lock for ROE of 5.6 kHz was applied for 150 ms and
TOCSY was performed with a mixing time of 77 ms. The
field strength of the TOCSY spin-lock in this experiment
was 9.4 kHz.
HMQC, HMBC and HMQC-TOCSY were recorded as
z-gradient experiments using standard Bruker software. The
experimental setup was otherwise identical to the same
spectra recorded of oligosaccharide 1. DEPT-HMQC-
TOCSY was run as described above but the spectral width
was reduced to 30 p.p.m. in F1 and 5 p.p.m. in F2. One-
hundred and twenty-eight experiments of 64 scans with 2048
data points were recorded. The TOCSY spinlock was
applied for 90 ms.
Mass spectrometry
Mass spectra were recorded in the negative ion mode of
the mixture of oligosaccharides prior to HPAEC, of the
isolated main oligosaccharide of deacylated LPS and of
acylated purified LPS from E. coli F2513 (R4 core-type).
In addition, the deacylated minor core-oligosaccharide of
E. coli F653 (R3 core-type) was analyzed. Negative ion
electrospray ionization mass spectra were recorded on a
Fourier Transform Ion Cyclotron Resonance FT-ICR
mass spectrometer (APEX II, Bruker Daltonics, Billerica,
USA) equipped with a 7 Tesla actively shielded magnet
andanApolloionsource.Samplesweredissolvedata
concentration of 10 ngÆlL
)1
in a 50 : 50 : 0.001 (v/v/v)
mixture of 2-propanol, water, and triethylamine and
sprayed at a flow rate of 2 lLÆmin
)1
. For straightforward
interpretation the spectra were charge-deconvoluted.
RESULTS
Structural analysis of
E. coli
2513 core-oligosaccharide
(R4 core)
Compositional analysis of LPS identified Gal, Glc, GlcN,
Kdo,
L
,
D
-Hep, and -P in a molar ratio given in Table 1. In
addition 3OH-C14:0, C12, and C14 were found in
Table 1. Composition of E. coli R4 LPS. Kdo
AcP
, Kdo determination
after hydrolysis in acetate buffer pH 4.5; Kdo
HCl
, Kdo determination
after hydrolysis in 0.1
M
HCl.
Component nmol component per mg Molar ratio
a
GlcN 398 2
Kdo
AcP
219 1.1
Kdo
HCl
301 1.5
P
org
812 4.1
Glc 381 1.9
Gal 648 3.2
L
,
D
-Hep 638 3.2
C12 : 0 125 0.6
C14 : 0 166 0.9
3OH-C14 : 0 636 3.3
a
Relative to GlcN ¼ 2.0.
5984 S. Mu
¨
ller-Loennies et al. (Eur. J. Biochem. 269) Ó FEBS 2002
accordance with the common acylation pattern of E. coli
lipid A [18].
Analytical HPAEC revealed that the deacylated LPS
fraction contained one major oligosaccharide isolated by
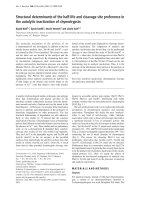
semipreparative HPAEC. The charge deconvoluted negat-
ive ion-mode ESI-FT-ICR mass spectrum of the major
oligosaccharide fraction (Fig. 1) obtained by deacylation of
LPS revealed a prominent ion with a mass of 2486.59 m/z.
This was indicative of a composition of two HexN-, two
Kdo-, three heptose-, five hexose-residues, and four phos-
phates (theoretical mass [M-H]
–
2485.577). Thus, this
oligosaccharide was a dodecasaccharide carrying four
phosphate substituents, in agreement with the compositional
analysis. Further sodium and potassium ion-clusters were
observed that indicated the loss of one phosphate group
(m/z 80 lower mass). A
31
P,
1
H-COSY NMR-spectrum
revealed that the phosphate group at the 4¢ position of
lipid A was missing (data not shown).
In addition ESI-FT-ICR contained the signals of a
molecular ion with m/z 2566.56, which was 80 Da higher
than the main fraction and was indicative of an additional
phosphate residue. Due to its low abundance this fraction
could not be isolated and subjected to a more detailed
analysis. Further molecular ions with a mass of 18 m/z
lower were observed which were not present in the same
spectrum of purified LPS prior to deacylation (not shown).
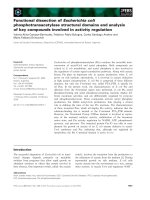
NMR-spectroscopy of the main oligosaccharide con-
firmed the compositional and mass spectrometrical analy-
ses. The
1
H-NMR spectrum (Fig. 2) contained 10 signals of
anomeric protons (Table 2). In addition, two pairs of
signals originating from 3-deoxy protons of Kdo-residues
were present. Full assignment of proton and carbon
chemical shifts and determination of
3
J
H,H-
coupling con-
stant values identified two pyranosidic Kdo-residues. Their
a-configuration was evident from the resonance frequencies
of the deoxy-protons (equatorial H3 > 2.4 p.p.m. for
b-Kdop) and the chemical shift values of the H-5 protons
[19]. All sugars were present as pyranoses which was
deduced from their C-4 carbon chemical shifts (above
80 p.p.m. for furanoses, Table 3). Correlation signals from
anomeric protons to intraresidue C-5 in HMBC corrobor-
ated the pyranose-configuration of sugar residues. All other
sugars except two were also a-configurated which was
determined by the analysis of J
C-1,H-1
-coupling constants
(> 172 Hz) from a HMQC spectrum recorded without
decoupling during acquisition. Signals of anomeric carbons
at 99.75 p.p.m. and 103.20 p.p.m. were assigned to a b-
GlcpN (164 Hz, residue B) and b-Galp (164 Hz, residue M),
respectively. Their b-configuration was confirmed by their
3
J
H,H-
coupling constants ( 8 Hz) and their intraresidual
NOE connectivities between H-1, H-3 and H-5. Three
signals of anomeric protons showed
3
J
H,H-
coupling con-
stant values of less than 1 Hz and thus the H-2 in these
residues was in equatorial position as in manno-configurated
sugars (residues E, F, H). The determination of the spin
system and coupling constants revealed that they belonged
to
L
,
D
-Hepp-residues. The analysis of a CH
2
-edited DEPT-
HMQC spectrum and a DEPT-HMQC-TOCSY spectrum
allowed the assignment of H-7a/b and C-7 of
L
,
D
-Hepp
residues F and H. The chemical shift of H-6 of residue F
could also be assigned in the latter spectrum. The chemical
shift of the H-6 proton of residue H, however, could not be
identified in this spectrum. Analysis of the
1
H,
13
Ccorrela-
tion spectrum indicated its chemical shift at 4.025 p.p.m., in
agreement with the chemical shift of the same proton in
previously analyzed oligosaccharides from E. coli J-5 [13].
Further residues were identified as a-Glcp (residues G and
I), a-Galp (residues K and L), and a-GlcpN(A).
The analysis of an HMBC spectrum showing intraresid-
ual cross-correlation signals from anomeric protons to
carbons C-3 and C-5 was important for the assignment of
spin-systems and chemical shifts of carbon. Additionally,
long-range correlations between protons of adjacent sugar
residues across the glycosidic bond established their
sequence; this was confirmed by the analysis of a NOESY
spectrum and a 2D-TOCSY-ROESY (TORO) [14–17]
spectrum (Fig. 3). This latter experiment facilitated the
assignment because all protons connected by scalar cou-
plings and part of a spin system detectable by TOCSY show
connectivities to protons close in space to any of these
protons. Therefore, more correlation signals are observed in
the region of anomeric protons that resolves signal overlap,
the identification of ROE signals is simplified and corro-
borated by further correlation signals within the adjacent
residue. Furthermore, due to the asymmetry of the experi-
ment with respect to the magnetization transfer mechanism
the pulse sequence generates signals in the vertical plane
Fig. 1. Charge deconvoluted ESI-FT-ICR mass spectrum of the deac-
ylated LPS of E. coli strain 2513 (R4 core). Shown are the spectra of
the mixture prior to separation (A) and of the isolated oligosaccharide
1(B).
Fig. 2.
1
H-NMR spectrum of E. coli 2513 deacylated LPS (R4 core,
oligosaccharide 1).
Ó FEBS 2002 Chemical structure of E. coli R3 and R4 LPS (Eur. J. Biochem. 269) 5985
only for protons within the preceeding residue and in the
horizontal plane only for protons within an attached residue
(most importantly the anomeric proton, if present). The
same result is obtained for a ROESY-TOCSY (ROTO)
experiment where a mirror image of the TORO spectrum is
obtained. For example, the well resolved anomeric proton
E1 shows cross-correlation signals not only to E2 but also
interresidual connectivities to protons C5, C6, C7, C8a and
C8b. The latter cross-correlation signals appeared in
opposite phase in the spectrum. The correlation signal
between I1 and G1 is only seen in the vertical plane, proving
that residue I is attached to residue G. Due to the opposite
phases, cancellation or diminished signal intensity may
occur and signals from direct ROE effects are still present.
For some overlapping signals arising from the two different
pathways, mixed phase signals instead of complete cancel-
lation was observed. However, even if some signals may
have cancelled out, this possible disadvantage is more than
compensated for by the additional information provided.
The results of these experiments are summarized in Table 5.
Residue B was thus connected to residue A in b1 fi 6
linkage and these represented the lipid A backbone. Char-
acteristic NOEs between protons H-3a (weak) and H-3e
(strong) of a-Kdop (residue C) and H-6 of a-Kdop (residue
D) confirmed their 2 fi 4-linkage [20]. The heptose-region
was composed of three heptose residues of the sequence
L
-a-
D
-Hepp-(1 fi 7)-
L
-a-
D
-Hepp-(1 fi 3)-
L
-a-
D
-Hepp which
was connected to the inner Kdo (residue C) in position 5.
The residues G, I, K, L, and M were those of the outer core
and the NMR analyses confirmed the results obtained by
methylation analysis [9]. Long-range NOEs were observed
between H-3a (strong) and H-3e (very weak) of a-Kdop
(residue C) and H-1 of
L
,
D
-Hepp (residue H) and between
the anomeric proton of the inner
L
,
D
-Hepp residue (E) and
the equatorial H-3 of the side-chain a-Kdop (residue D).
Four phosphate residues were identified (Fig. 4A, Table
4) that were shown by HMQC to be linked to protons A1
(a-GlcpN), B4 (b-GlcpN), E4 (
L
,
D
-Hepp I) and F4 (
L
,
D
-
Hepp II). The substitution with phosphate led to significant
downfield shifts of protons and carbons at these positions.
The additional scalar coupling led to splitting of the
corresponding signals in
1
H-, and
13
C-NMR spectroscopy.
Table 2.
1
H-NMR chemical shifts (p.p.m.) of deacylated LPS of E. coli strain 2513 (R4 core-type, 1) and F653 (R3 core-type, 3 major and 4 minor).
Compound Residue H-1 H-2 H-3ax H-3eq H-4 H-5 H-6a H-6b H-7a H-7b H-8a H-8b
1Afi 6-aGlcN 1P 5.664 3.417 3.902 3.611 4.127 3.765 4.293
3 5.652 3.411 3.913 3.608 4.144 3.770 4.296
4 5.664 3.418 3.921 3.602 4.154 3.770 4.306
1Bfi 6-bGlcN 4P 4.860 3.076 3.859 3.796 3.740 3.443 3.666
3 4.870 3.062 3.850 3.767 3.725 3.453 3.668
4 4.861 3.081 3.859 3.773 3.740 3.458 3.690
1Cfi 4,5-aKdo 1.932 2.137 4.126 4.277 3.706 3.841 3.619 3.915
3 1.948 2.139 4.136 4.270 3.728 3.852 3.634 3.916
4 1.952 2.130 4.148 4.276 3.721 3.838 3.655 3.919
1DaKdo 1.775 2.147 4.105 4.045 3.653 3.995 3.745 3.945
3 1.780 2.156 4.108 4.051 3.663 3.999 3.751 3.957
4 1.787 2.163 4.133 4.044 3.649 3.998 3.742 3.985
1Efi 3-aHep 4P 5.289 4.061 4.128 4.415 4.218 4.097 3.917 3.766
3 5.287 4.067 4.136 4.412 4.223 4.102 3.903 3.784
4 5.293 4.084 4.168 4.430 4.205 4.129 3.934 3.795
1Ffi 3,7-aHep 4P 5.089 4.402 4.115 4.405 3.849 4.245 3.698 3.698
3 5.092 4.385 4.093 4.354 3.826 4.260 3.696 3.696
4 5.176 4.380 4.059 4.012 3.732 4.146 3.674 3.752
1Gfi 3-aGlc 5.195 3.638 4.073 3.732 3.885 3.891 3.785
3 5.198 3.595 4.185 3.776 3.878 3.863 3.729
4 5.289 3.705 4.116 3.787 3.880 3.926 3.749
1HaHep 4.934 3.964 3.857 3.846 3.638 4.042 3.739 3.739
3 4.943 3.968 3.866 3.848 3.648 4.003 3.673 3.758
4 fi 7-aHep 4.944 3.993 3.874 3.849 3.621 4.233 3.909 3.730
1Ifi 2,4-aGlc 5.754 3.743 4.034 3.727 4.189 4.014 3.816
3 fi 2,3-aGal 5.938 4.189 4.342 4.319 4.313 3.770 3.770
4 5.903 4.225 4.321 4.358 4.299 3.800 3.769
1Kfi 2-aGal 5.542 3.990 4.097 3.857 4.072 3.779 3.734
3 fi 2-aGlc 5.512 3.735 3.885 3.470 3.765 3.922 3.746
4 5.550 3.746 3.910 3.495 3.765 3.931 3.771
1LaGal 5.247 3.840 3.943 3.983 4.138 3.700–3.777 3.700–3.777
3 aGlc 5.222 3.552 3.752 3.453 3.907 3.929 3.771
4 5.208 3.566 3.756 3.450 3.935 3.933 3.840
1MbGal 4.451 3.538 3.652 3.913 3.708 3.522 3.618
3 aGlcN 5.415 3.382 3.902 3.556 4.057 3.950 3.814
4 5.427 3.404 3.926 3.571 4.079 3.957 3.810
4NaGlcN 5.224 3.352 3.944 3.494 3.763 3.778 3.778
5986 S. Mu
¨
ller-Loennies et al. (Eur. J. Biochem. 269) Ó FEBS 2002
In accordance with all experimental data the chemical
structure of deacylated E. coli 2513 LPS (R4 core-type) is as
depicted in Fig. 5.
Structural analysis of
E. coli
F653 core-oligosaccharides
(R3 core)
We have subjected purified LPS from E. coli F653 to
alkaline deacylation by hot alkali and separated the
oligosaccharide mixture obtained by HPAEC. Two main
fractions were obtained. The
1
H-NMR spectrum of the
major oligosaccharide (Fig. 6A) contained 10 signals of
anomeric protons and two pairs of signals originating from
3-deoxy protons characteristic of aKdop. The assignment of
1
Hand
13
C-resonances (Tables 2 and 3) and determination
of vicinal coupling constants (
3
J
Hn, Hn+1
) revealed that it
was composed of three GlcpN (residues A, B, M, Fig. 8),
two Kdop (C, D), three
L
,
D
-Hepp (E, F, H), three Glcp (G,
K, L) residues and one Galp (I) residue. All sugars except
one were present as a-pyranoses as evident from
3
J
H-1,H-2
and J
C-1,H-1
coupling constants and
13
C chemical shifts. The
chemical shift and the
3
J
H-1,H-2
coupling constant of the
anomeric proton (8.5 Hz) of one GlcpN (residue B) as well
as NOE correlation signals between H-1, -3 and -5
confirmed its b-configuration. In addition, four phosphate
residues were present (Fig. 4B, Table 4) which were located
at positions 1 and 4¢ of the lipid A backbone (GlcpN-
disaccharide at the reducing end, residues A and B) and at
positions 4 of both
L
,
D
-Hepp-residues E and F as deter-
mined by
31
P,
1
H-COSY, as well as
1
H- and
13
C-chemical
shift analysis. The sequence of residues was determined by
NOESY, ROTO, and HMBC. In NOESY the anomeric
protons of residues B to G showed NOEs in agreement with
the chemical structure present in the R4-core (see above)
Fig. 4.
31
P-NMR spectra of deacylated LPS from E. coli 2513 [R4
core, oligosaccharide 1 (A)], and from E. coli F653 [R3 core, oligosac-
charide 3 (B), and oligosaccharide 4 (C)].
Fig. 5. Chemical structure of E. coli strain 2513 deacylated LPS (R4
core, oligosaccharide 1).
Fig. 3.
1
H-TORO-NMR spectrum of E. coli 2513 deacylated LPS (R4 core, oligosaccharide 1). In the lower right corner the boxed area of the
spectrum is shown expanded.
Ó FEBS 2002 Chemical structure of E. coli R3 and R4 LPS (Eur. J. Biochem. 269) 5987
and in the corresponding partial structure isolated previ-
ously from the Rc-mutant strain E. coli J-5 [13]. In addition,
interresidual NOEs were observed from I1 to G3, M1 to I3,
K1 to I1 and I2, and L1 to K1 and K2 establishing the
sequence of these residues as a-
D
-Glcp1 fi 2-a-
D
-
Glcp1 fi 2-[a-
D
-GlcpN1 fi 3]-a-
D
-Galp1 fi 3-a-
D
-Glcp.
These residues thus represented the outer core and con-
firmed the results previously obtained by methylation
analyses [6,7,9,21]. The sequence deduced from observed
NOEs was corroborated by cross-correlation signals in
HMBC across the glycosidic bonds.
In comparison to the major oligosaccharide 2,
1
H- (Fig. 6B) and
13
C-NMR-spectra of the minor core
oligosaccharide 3 contained an additional set of signals
originating from an a-
D
-GlcpN-residue which was there-
fore a tridecasaccharide. NOE NMR-spectra, ROTO and
HMBC confirmed that this residue (N, Fig. 7) was located
at position 7 of the side chain
L
,
D
-Hepp (residue H)
leading to downfield shifts of protons F7a and F7b as well
as F6. NOE correlations were also observed between
proton H1 of this GlcpN-residue (residue N) to protons
H-6, H-7a and H-7b of residue H. Simultaneous upfield
shifts of proton and carbon 4 of residue F (second
L
,
D
-
Hepp) indicated that this position was not substituted with
phosphate in contrast to the major oligosaccharide. This
was corroborated by only three phosphorus resonances in
31
P-spectra (Fig. 4C, Table 4). A
1
H,
31
P-NMR correlation
spectrum confirmed that apart from two phosphates in the
lipid A (positions 1 and 4¢) only position 4 of residue E
was phosphorylated.
ESI-FT-MS of this oligosaccharide showed prominent
ions with a mass of 2566.70 m/z (Fig. 8) and was consistent
with the composition deduced from NMR.
DISCUSSION
LPS of E. coli strain 2513 (R4 core-type) contains the major
oligosaccharide shown in Fig. 5. ESI-FT-MS also revealed
the presence of a minor fraction devoid of one phosphate
residue and NMR-analysis showed that the 4¢-phosphate
group was missing. A molecular ion with a mass difference
of an additional 80 Da indicated the presence of a fifth
phosphate residue. This compound, however, was present
only in minute amounts and was not seen in HPAEC. It is
known that in enterobacterial LPS the first heptose (residue
E) is substituted in position 4 with 2-aminoethanol diphos-
phate instead of a monophosphate [2]. The origin of this
oligosaccharide can thus be explained by the possibility that
the strong alkaline treatment did not hydrolyze the 2-
aminoethanol diphosphodiester between phosphate groups
but to a small extent between the 2-aminoethanol and
phosphate leading to a diphosphate at this position. A mass
spectrum of purified LPS (not shown) recorded to explain
the origin of this molecular ion and of additional molecular
ions with a lower mass of m/z 18, which were present in the
spectra of alkali treated LPS (Fig. 1), only contained
molecular ions with a mass difference of m/z 123 (2-
aminoethanol monophosphate) but not with additional m/z
80 (phosphate). Therefore an additional monophosphate
substitution at a different location may be excluded.
Furthermore, the spectrum did not contain molecular ions
with a lower mass of Dm/z 18 which thus were artefacts.
Similar artefacts have been described previously by Olstho-
orn et al. [22].
There was no heterogeneity with respect to the
substitution by additional sugar residues attached to the
side chain-heptose as observed in other LPS-core struc-
tures (E. coli F470, E. coli F653, Shigella sonnei, Shigella
flexneri, Erwinia carotovora FERM P-7576, Proteus
mirabilis R110/1959, Citrobacter freundii O23) [2].
Notably, the phosphate substitution at position 4 of the
second heptose (residue F) is quantitative and no smaller
molecule is present which lacks the side chain heptose
(residue H) as found in an Rc-mutant strain of E. coli
F653 (E. coli J-5, R3 core-type) [13].
The NMR analyses of the oligosaccharides derived from
E. coli F653 (R3 core) confirmed the results of methylation
analyses published earlier [6,7]. The relative amounts of
GlcpN in the preparation were approximately 30%.
Important from a biosynthetic point of view, we observed
a correlation of side-chain heptose substitution with GlcpN
and the lack of phosphate substitution at the second heptose
of the inner core. This has been observed the first time in the
rough mutant strain E. coli J-5 [13]. We have therefore
reinvestigated the minor core-oligosaccharide of E. coli
F470 [8] which also contains this substitution by
1
H,
1
H-
DQF-COSY. The correlation signals of H-4 of the second
heptose, which in case of phosphorylation are shifted
downfield ( 4.5 p.p.m), were not present at this frequency
but had moved upfield. Therefore, we concluded that also in
this case the phosphate group at this position is missing and
this correlation seems to be true in general, at least for all
E. coli LPS. Obviously, this phosphate residue must be
removed either prior, during or after the transfer of this
GlcpN. The enzymatic activity and the corresponding gene
locus have not been identified so far. It is tempting to
speculate that this GlcpN-transferase may be able to act as a
Fig. 6.
1
H-NMR spectra of E. coli F653 major (oligosaccharide 3, A)
and minor (oligosaccharide 4, B) oligosaccharide.
5988 S. Mu
¨
ller-Loennies et al. (Eur. J. Biochem. 269) Ó FEBS 2002
phosphorylase and that both reactions occur simultaneously
since no molecules are detected which contain both, GlcpN
and phosphate, or no GlcpN and no phosphate at this
position. The presence of phosphate at this position in
oligosaccharides, which possess a side-chain heptose residue
is explained by the fact that the activity of heptosytrans-
ferase III (WaaQ) is dependent on the phosphate at this
position [23]. Thus, it may be that the reaction of this
GlcpN-transferase is energetically driven by the removal of
the phosphate. It may also be that two different enzymatic
activities are active and the lack of the side-chain GlcpN
substitution in the R4 core oligosaccharide can be either due
to the lack of the responsible GlcpN-transferase or by the
lack of a phosphatase if the phosphate has to be removed
prior to glycosylation.
The reactivity of E. coli 2513 LPS with mAb WN1 222-5
can be explained by an inner-core structure identical to
those found in LPS from all core-types of E. coli and
Salmonella. Investigation of the inter-residual NOE con-
nectivities revealed that no long range NOEs indicative of a
backfolding of the outer core were found. Therefore, it is
apparent that the outer core and the inner core form two
structural confined domains, which may be a prerequisite
for the accessibility of the inner core sugars for the binding
bymAbWN1222-5.
Previously, an NOE between the anomeric proton of the
side-chain heptose (residue H) and the axial H-3 of the
first aKdop (residue C) has been observed in the analysis
of the R1 and R2 core oligosaccharides [8] and a
Table 3.
13
C-NMR chemical shifts (p.p.m.) of deacylated LPS of E. coli strain 2513 (R4 core, 1) and F653 (R3 core, 3 major and 4 minor).
Compound Residue C-1 C-2 C-3 C-4 C-5 C-6 C-7 C-8
1Afi 6-aGlcN 1P 92.15 55.57 70.37 70.83 73.67 70.85
3 92.14 55.67 70.71 70.82 73.73 70.89
4 92.02 55.76 70.77 70.89 73.55 70.95
1Bfi 6-bGlcN 4P 100.61 56.74 73.09 75.48 74.18 63.55
3 100.60 56.76 73.17 73.17 75.15 63.21
4 100.73 56.81 73.37 73.52 75.22 63.71
1Cfi 4,5-aKdo ND ND 35.54 71.56 70.84 73.41 70.81 64.96
3 175.7 ND 35.55 71.60 71.14 73.45 70.81 64.98
4 ND ND 35.61 71.47 70.87 73.29 70.87 64.93
1DaKdo ND ND 36.06 67.08 67.78 73.44 71.61 64.25
3 176.1 ND 36.05 67.16 67.79 73.44 71.21 64.25
4 ND ND 36.09 67.12 67.75 73.56 71.55 64.41
1Efi 3-aHep 4P 100.21 72.12 79.00 71.14 73.77 70.28 64.41
3 100.35 72.09 79.15 71.14 73.86 70.29 64.38
4 100.40 72.27 78.26 71.22 73.88 71.50 64.41
1Ffi 3,7-aHep 4P 103.76 71.22 80.25 69.88 73.48 68.60 69.68
3 103.85 71.22 80.36 69.66 73.45 68.65 69.68
4 103.52 70.66 79.03 67.19 73.31 69.05 70.50
1Gfi 3-aGlc 102.49 71.51 77.63 71.59 73.73 61.14
3 102.68 71.59 75.81 71.97 73.72 61.05
4 101.12 71.60 76.85 71.84 73.54 61.24
1HaHep 101.31 70.44 71.65 67.54 72.74 70.28 64.19
3 101.40 71.19 71.89 67.53 72.79 70.40 64.20
4 fi 7-aHep 101.60 71.15 71.71 67.36 73.04 69.04 71.46
1Ifi 2,4-aGlc 95.86 74.96 70.18 79.17 71.33 60.30
3 fi 2,3-aGal 95.14 69.37 72.31 65.55 71.09 61.78
4 95.54 69.31 72.22 65.44 71.03 62.06
1Kfi 2-aGal 93.50 73.43 69.18 71.06 72.24 62.30
3 fi 2-aGlc 92.57 76.27 72.81 70.93 75.43 61.89
4 92.81 76.73 72.83 70.77 75.19 62.05
1LaGal 96.20 68.54 69.72 70.79 71.55 61.59
3 aGlc 97.10 72.74 74.36 70.56 73.34 62.06
4 97.40 72.74 74.38 70.57 73.35 61.65
1MbGal 103.20 71.26 72.84 68.99 75.68 63.76
3 aGlcN 91.87 55.03 71.08 70.87 73.55 61.59
4 91.87 55.03 71.17 70.91 73.59 61.68
4NaGlcN 97.42 55.33 71.08 70.84 73.50 61.67
Table 4.
31
P-NMR chemical shifts (p.p.m.) of deacylated LPS of E. co li
strain 2513 (R4 core-type, 1) and F653 (R3 core-type, 3 major and 4
minor).
Residue
Compound
134
A fi 6-aGlcN 1P 3.16 3.20 3.19
B fi 6-bGlcN 4P 4.38 4.40 4.41
E fi 3-aHep 4P 5.06 5.10 4.96
F fi 3,7-aHep 4P 5.00 5.05
Ó FEBS 2002 Chemical structure of E. coli R3 and R4 LPS (Eur. J. Biochem. 269) 5989
computational calculation of a partial oligosaccharide
excluding phosphate substitution performed in this study
revealed a distance of 5–6 A
˚
of these protons, inconsistent
with reported results [8] and interpreted as spin diffusion.
Also these NOEs were not observed in NOESY spectra of
smaller oligosaccharides from the Rc-mutant E. coli strain
J-5 [13]. The same long-range interactions between the
side-chain
L
,
D
-Hepp (residue H) and the inner a-Kdop (C),
and between the adjacent
L
,
D
-Hepp (residue F) and the
side-chain a-Kdop (residue D) were observed in the
analysis of the R3 and R4 core oligosaccharides. To
provide further evidence we have therefore conducted a
series of NOESY experiments with varying mixing times
that showed that these were present also at mixing times as
short as 50 ms. They may therefore indicate a conform-
ational change of the inner core with respect to molecules
that do not have an outer core rather than the result of
spin diffusion. In order to arrive at meaningful calcula-
tions, extensive NMR measurements will have to be
performed and pH and the presence of divalent cations
should be taken into account.
With respect to the recognition of these structures by
antibodies and the structural characterization of epitopes
leading to cross-reactivity, the full assignment of carbon
and, in particular, proton resonances now provides the
basis for detailed NMR-based conformational analysis of
the inner core region of enterobacterial LPS. Furthermore,
it will allow the interpretation of saturation transfer
difference measurements [24] aiming at further character-
ization of the epitope recognized by the cross-reactive
mAb WN1 222-5.
ACKNOWLEDGEMENTS
We greatfully acknowledge the technical assistance of V. Susott, and
Helga Lu
¨
thje as well as the kind gift of the minor core oligosaccharide
from E. coli rough mutant F470 by Drs O. Holst and E. Vinogradov.
This research was financially supported by the Deutsche Forschungsg-
emeinschaft Grants DFG L1-448 (BL).
REFERENCES
1. Vaara, M. (1999) Lipopolysaccharide and the permeability of the
bacterial outer membrane. In Endotoxin in Health and Disease
(Brade, H., Opal, S.M., Vogel, S.N. & Morrison, D.C., eds), pp.
31–38. Marcel Dekker, Inc., New York.
2. Holst, O. (1999) Chemical structure of the core region of lipo-
polysaccharides. In EndotoxininHealthandDisease(Brade, H.,
Fig. 7. Chemical structure of the deacylated E. coli R3 LPS. The major
component (oligosaccharide 3) is lacking the side-chain GlcpN-residue
(residue N) but contained an additional phosphate substitutent at
position 4 of the second
L
,
D
-Hepp (residue F).
Fig. 8. Charge deconvoluted ESI-FT-ICR mass spectrum of the minor
fraction of deacylated LPS obtained from E. coli F653 (oligosaccharide
4, R3 core).
Table 5. Important correlation signals for sequence determination in NOESY and 2D-TORO of deacylated LPS from E. coli 2513 (R4 core).
Residue
From
proton
2D-TORO NOESY
Intraresidual
contact
Interresidual
contact
Intraresidual
contact
Interresidual
contact
A H-1 A2,3 A2
B H-1 B2,3,4,5 A6a B3,5 A6b
C H-3a C4,5 C4 H1, E5, D6
H-3e E5, D6,8a/b C4 E5, D6,8a/b
D H-3a D4,5 D4
H-3e D4 E1
E H-1 E2 C5,6,7,8a/b E2 C5,7
F H-1 F2 E2,3,4,5 F2,5 E2,3
G H-1 G2,3,5 F3,4,5 G2 F3,4
H H-1 H2 F5,6,7a/b H2 F5,6,7a/b
I H-1 I2,3 G2,3,4,5, K2,3 I2 K1, G3
K H-1 K2,3,4 L1,3, I4,5 K2 L1, I1,2
L H-1 L2,3 G2,3,4,5, K2,3 L2 K1,2, G4
M H-1 M2,3,4 I2,3,4,5 M2,3,5 I4,6a/b
5990 S. Mu
¨
ller-Loennies et al. (Eur. J. Biochem. 269) Ó FEBS 2002
Opal, S.M., Vogel, S.N. & Morrison, D.C., eds), pp. 115–154.
Marcel Dekker, Inc., New York.
3. Mu
¨
ller-Loennies, S., Di Padova, F.E., Brade, L., Heumann, D. &
Rietschel, E.Th (2000) Conserved epitopes in bacterial lipopoly-
saccharides and cross-reactive antibodies in the treatment of
endotoxicosis and gram-negative septic shock. In Fighting Infec-
tion in the 21st Century (Andrew, P.W., Oyston, P., Smith, G.L. &
Stewart-Tull, D.E., eds), pp. 143–178. Blackwell Science Ltd,
Oxford.
4. Tate, W.J., Douglas, H., Braude, A.I. & Wells, W.W. (1966)
Protection against lethality of E. coli endotoxin with ÔOÕantiserum.
Ann. NY Acad. Sci. 133, 746–762.
5. DiPadova,F.E.,Brade,H.,Barclay,G.R.,Poxton,I.R.,Liehl,E.,
Schuetze, E., Kocher, H.P., Ramsay, G., Schreier, M.H. &
McClelland, D.B. (1993) A broadly cross-protective monoclonal
antibody binding to Escherichia coli and Salmonella lipopoly-
saccharides. Infect. Immun. 61, 3863–3872.
6. Haishima, Y., Holst, O. & Brade, H. (1992) Structural
investigation on the lipopolysaccharide of Escherichia coli rough
mutant F653 representing the R3 core type. Eur. J. Biochem. 203,
127–134.
7. Haishima, Y., Holst, O. & Brade, H. (1992) Structural investiga-
tion on the lipopolysaccharide of Escherichia coli rough mutant
F653 representing the R3 core type. Eur. J. Biochem. 207, 1129.
8. Vinogradov, E.V., Van Der, D.K., Thomas-Oates, J.E., Meshkov,
S., Brade, H. & Holst, O. (1999) The structures of the carbohy-
drate backbones of the lipopolysaccharides from Escherichia coli
rough mutants F470 (R1 core type) and F576 (R:2 core type). Eur.
J.Biochem.261, 629–639.
9. Jansson, P E., Lindberg, A.A., Lindberg, B. & Wollin, R. (1981)
Structural studies on the hexose region of the core in lipopoly-
saccharides from Enterobacteriaceae. Eur. J. Biochem. 115, 571–
577.
10. Mu
¨
ller-Loennies, S., Holst, O. & Brade, H. (1994) Chemical
structure of the core region of Escherichia coli J-5 lipopoly-
saccharide. Eur. J. Biochem. 224, 751–760.
11. Kaca, W., de Jongh-Leuvenink, J., Za
¨
hringer, U., Rietschel, E.Th,
Brade, H., Verhoef, J. & Sinnwell, V. (1988) Iolation and chemical
analysis of 7-O-(2-amino-2-deoxy-a-
D
-glucopyranosyl-
L
-glycero-
D
-manno-heptose as a constituent of the lipopolysaccharides of the
UDP-galactose epimerase less mutant J-5 of Escherichia coli and
Vibrio cholerae. Carbohydr. Res. 179, 289–299.
12. Holst, O., Thomas-Oates, J.E. & Brade, H. (1994) Preparation
and structural analysis of oligosaccharide monophosphates
obtained from the lipopolysaccharide of recombinant strains of
Salmonella minnesota and Escherichia coli expressing the genus-
specific epitope of Chlamydia lipopolysaccharide. Eur. J. Biochem.
222, 183–194.
13. Mu
¨
ller-Loennies, S., Holst, O., Lindner, B. & Brade, H. (1999)
Isolation and structural analysis of phosphorylated oligosacchar-
ides obtained from Escherichia coli J-5 lipopolysaccharide. Eur. J.
Biochem. 260, 235–249.
14. Kessler, H., Gemmecker, G. & Haase, B. (1988) Relayed-NOE
experiments in the rotating frame for sequence analysis of pep-
tides. J. Magn Reson. 77, 401–408.
15. Kessler, H., Gemmecker, G., Haase, B. & Steuernagel, S. (2002)
Improvement of relayed NOESY type experiments by
implementation of spin-lock sequences. Magn. Reson. Chem. 26,
919–926.
16. Poppe, L. & Dabrowski, J. (1989) Sequence determination in
oligosaccharides by relayed NOE experiments in the rotating
frame. Biochem. Biophys. Res. Commun. 159, 618–623.
17. Dabrowski, J. (2002) Two-dimensional and related NMR meth-
ods in structural analysis of oligosaccharides and polysaccharides.
In Two-Dimensional NMR Spectroscopy (Croasmun, W.R. &
Carlson, R.M.K., eds), pp. 741–783. VCH Publishers, Inc., New
York.
18. Za
¨
hringer, U., Lindner, B. & Rietschel, E.T. (1999) Chemical
structure of lipid A. In Endotoxin in Health and Disease (Brade, H.,
Opal, S.M., Vogel, S.N. & Morrison, D.C., eds), pp. 93–114.
Marcel Dekker, Inc., New York.
19. Birnbaum, G.I., Roy, R., Brisson, J R. & Jennings, H.J. (1987)
Conformations of ammonium 3-deoxy-
D
-manno-2-octulosonate
(Kdo) and a-andb-ketopyranosides of Kdo: X-ray structure and
1
H NMR analyses. J. Carbohydr. Chem. 6, 17–39.
20. Bock, K., Thomsen, J.U., Kosma, P., Christian, R., Holst, O. &
Brade, H. (1992) A nuclear magnetic resonance spectroscopic
investigation of Kdo-containing oligosaccharides related to the
genus-specific epitope of Chlamydia lipopolysaccharides. Carbo-
hydr. Res. 229, 213–224.
21. Jansson, P E., Lindberg, B., Lindberg, A.A. & Wollin, R. (1979)
Structural studies on the hexose region of the Enterobacteriaceae
type R3 core polysaccharide. Carbohydr. Res. 68, 385–389.
22. Olsthoorn, M.M., Haverkamp, J. & Thomas-Oates, J.E. (1999)
Mass spectrometric analysis of Klebsiella pneumoniae ssp. pneu-
moniae rough strain R20 (O1-:K20-) lipopolysaccharide pre-
parations: identification of novel core oligosaccharide components
and three 3-deoxy-
D
-manno-oct-2-ulopyranosonic artifacts.
J. Mass Spectrom. 34, 622–636.
23. Yethon, J.A., Heinrichs, D.E., Monteiro, M.A., Perry, M.B. &
Whitfield, C. (1998) Involvement of waaY, waaQ, and waaP in the
modification of Escherichia coli lipopolysaccharide and their role
in the formation of a stable outer membrane. J. Biol. Chem. 273,
26310–26316.
24. Haselhorst, T., Espinosa, J.F., Jimenez-Barbero, J., Sokolowski,
T.,Kosma,P.,Brade,H.,Brade,L.&Peters,T.(1999)NMR
experiments reveal distinct antibody-bound conformations of a
synthetic disaccharide representing a general structural element
of bacterial lipopolysaccharide epitopes. Biochemistry 38, 6449–
6459.
Ó FEBS 2002 Chemical structure of E. coli R3 and R4 LPS (Eur. J. Biochem. 269) 5991