Báo cáo khoa học: High-pressure effects on horse heart metmyoglobin studied by small-angle neutron scattering pdf
Bạn đang xem bản rút gọn của tài liệu. Xem và tải ngay bản đầy đủ của tài liệu tại đây (174.14 KB, 7 trang )
High-pressure effects on horse heart metmyoglobin studied
by small-angle neutron scattering
Camille Loupiac
1
, Marco Bonetti
2
, Serge Pin
3
and Patrick Calmettes
1
1
Laboratoire Le
´
on Brillouin, UMR 12 CNRS,
2
Service de Physique de l’Etat Condense
´
, and
3
Service de Chimie Mole
´
culaire,
URA 331 CNRS, DSM/DRECAM, CEA de Saclay, Gif-sur-Yvette, France
Small-angle neutron scattering experiments were performed
on horse azidometmyoglobin (MbN
3
) at pressures up to
300 MPa. Other spectroscopic techniques have shown that a
reorganization of the secondary structure and of the active
site occur in this pressure range. The present measurements,
performed using various concentrations of MbN
3
, show that
the compactness of the protein is not altered as the value of
its radius of gyration remains constant up to 300 MPa. The
value of the second virial coefficient of the protein solution
indicates that the interactions between the molecules are
always strongly repulsive even if their magnitude decreases
with increasing pressure. Taking advantage of the pressure-
induced contrast variation, these experiments allow the
partial specific volume of MbN
3
to be determined as a
function of pressure. Its value decreases by 5.4% between
atmospheric pressure and 300 MPa. In this pressure range
the isothermal compressibility of hydrated MbN
3
is found to
be almost constant. Its value is (1.6 ± 0.1) 10
)4
MPa
)1
.
Keywords: myoglobin; pressure; SANS; partial volume;
compressibility.
The structure of proteins and their solvent interactions can
be modified by temperature, pH or chemicals. The appli-
cation of hydrostatic pressure to a protein solution also
provides a manner to alter these physical properties [1–4].
The stability of proteins in very different extreme environ-
mental conditions is of great importance for many biotech-
nological applications, notably food processing. Therefore,
the various states that proteins can adopt under pressure is
a matter of growing interest. In general, protein–ligand
binding is affected by pressures lower than 400 MPa.
Furthermore, protein denaturation and unfolding may
occur at higher pressures [5–8]. Studies of protein stability
by means of various spectroscopic techniques have shown
that increasing pressure reduces the partial volume of the
molecule through compression and conformational changes.
Although matter is always compressible, electrostriction of
charged and polar side chains, hydrophobic hydration,
hydrogen bonds stabilization and the elimination of packing
defects are considered to be the main causes for this volume
change [9–15].
The effects of pressure on hemeproteins have been the
subject of numerous investigations. Optical absorption [16–
21], fluorescence [22], FTIR [23–25], Raman [26], and NMR
[27–29] spectroscopies, and laser flash photolysis [30–32]
have all shown that pressures near 300 MPa leads to subtle
local rearrangements of the protein structure and that some
intermediate states preceding unfolding probably appear.
Therefore, it is important to determine whether the modi-
fications observed at the level of the active site of myoglobin
[17,18,20,21,26–29] and the reorganization of the secondary
structure with an alteration of the electrostatic and hydro-
gen-bond array [23,24] are related to a change in the tertiary
structure of the protein.
In order to reply these questions we report here for the
first time, the results of small-angle neutron scattering
(SANS) experiments performed on myoglobin (Mb) under
pressure. Quite generally, SANS can provide information
about the partial volume of proteins, their interactions, their
size and their conformation [33]. The scattering measure-
ments were carried out in heavy water (
2
H
2
O) at varying
pressures up to 300 MPa as a function of protein concen-
tration in order to determine the magnitude of the solute
interactions and to allow for the elimination of their
contribution to the forward scattered intensity and the
apparent radius of gyration.
Azidometmyoglobin (MbN
3
) has a high stability. It was
chosen for this study in order to avoid a mixture of aquo
and hydroxy derivatives in metmyoglobin solutions or a
contamination of either oxygen or carbon monoxide
saturated myoglobin solutions by oxidized forms which
could form under pressure [34].
MATERIALS AND METHODS
Protein sample preparation
High purity horse-heart Mb was purchased from Sigma.
The lyophilized protein was first dissolved in water (H
2
O)
and dialysed three times against H
2
O during 24 h to remove
all the salts. The protein was then extensively dialysed (three
dialyses of 24 h) against
2
H
2
O to achieve a complete
exchange of the labile hydrogen atoms. For the SANS
experiments a 0.1-
M
Bistris p
2
H 6.6 deuterated buffer was
used so as to allow the highest contrast between the protein
Correspondence to P. Calmettes, Laboratoire Le
´
on Brillouin,
C.E.A. de Saclay, 91191 Gif-sur-Yvette, cedex, France.
Fax: + 33 16908 8261, Tel.: + 33 16908 6476,
E-mail:
Abbreviations: SANS, small-angle neutron scattering;
Mb, myoglobin; MbN
3
, azidometmyoglobin.
(Received 26 February 2002, revised 10 June 2002,
accepted 22 July 2002)
Eur. J. Biochem. 269, 4731–4737 (2002) Ó FEBS 2002 doi:10.1046/j.1432-1033.2002.03126.x
and the solvent whilst also minimizing incoherent scattering
from the hydrogen atoms. Bistris was chosen because its
ionization constant should not be altered by pressure [35].
Sodium azide (NaN
3
) was added to the aquometmyoglobin
solution one day prior to the SANS experiments to ensure
that the protein was almost fully liganded with N
3
[36]. This
was checked by absorbance measurements in the visible
region. The p
2
H of the solution was measured after
ligandation and adjusted to 6.6 if necessary. The mother
MbN
3
solution at about 60 mgÆcm
)3
and the samples were
preparedandstoredat4 °C. All samples were centrifuged at
20 000 g during 5 min at 15 °C prior to the SANS
experiments.
High-pressure cell
During the SANS experiments the protein solutions were
contained in a high-pressure cell made of stainless steel with
two parallel thick sapphire windows. The optical path
length was 5 mm and the maximum forward scattering
angle h
max
¼ 15°. A separator between the pressurizing
fluid and the sample prevented the latter from contamina-
tion. A hand driven pressure generator allowed the pressure
to be gradually increased up to any value lower than about
300 MPa. No significant temperature increase was observed
during pressurization performed at a rate of about
100 barÆmin
)1
. Pressure was measured with an accuracy of
±0.3 MPa.
SANS experiments
The SANS experiments were performed with the PACE
spectrometer at the Laboratoire Le
´
on Brillouin, Saclay,
France. The neutron wavelength was k ¼ 1.1 nm. This
gives access to wavenumber transfers, q, ranging from 0.07
to 0.75 nm
)1
. q ¼ (4p/k)sin(h/2), where h is the scattering
angle. The SANS spectra were collected at room temper-
ature, near 20 °C. Each raw spectrum was divided by the
corresponding transmission measured with a suitably
attenuated beam after the removal of the beam stop located
in front of the centre of the detector. The dialysis buffer and
the empty cell scattering contributions were measured in the
same conditions and subtracted from the spectrum of each
protein sample. Finally, the results were corrected for the
nonuniformity of the detector response by normalization to
the incoherent scattering of a 1.00 mm path-length water
sample.
To check that protein aggregation did not occur during
the course of the measurements, one hour spectra were
recorded successively. The number of spectra was chosen
according to the protein concentration so as to ensure the
same statistical accuracy for all measurements after averag-
ing. No protein aggregation was observed during the SANS
experiments.
Data analysis
With respect to the solvent alone, the excess neutron
intensity scattered forward from a protein solution is [33]
Iðq ¼ 0; P; cÞ¼k
B
TcðPÞ½KðPÞ
2
oPðP; cÞ
oc
À1
T;P
ð1Þ
where k
B
is Bolztmann’s constant, T the temperature (K)
and P the pressure (MPa). c ¼ c(P) is the protein concen-
tration (gÆcm
)3
)andP(P,c) the osmotic pressure (MPa),
both at pressure P.
KðPÞ¼ b
p
N
A
M
p
À q
0
b
ðPÞv
p
ðPÞ
!
ð2Þ
is the average specific contrast of the protein molecule with
respect to the solvent. b
p
is the coherent scattering length
(cm) of a molecule and M
p
its molar mass (gÆmol
)1
).
M
p
@ 17.4 · 10
3
gÆmol
)1
for Mb in
2
H
2
O [37]. N
A
is
Avogadro’s number. v
p
(P) is the partial specific volume
(cm
3
Æg
)1
) of the protein at pressure P. q¢
b
(P)isthe
scattering-length density (cm
)2
) of the buffer at the same
pressure. As the salt concentration of the buffer is low it can
be regarded as pure
2
H
2
O. Therefore its scattering length
density is
q
0
b
ðPÞ¼b2
H
2
O
q
2
H
2
O
ðPÞ
N
A
M
2
H
2
O
ð3Þ
where b
2
H
2
O
is the coherent scattering length of a
2
H
2
O
molecule. q
2
H
2
O
(P)andM
2
H
2
O
are the density (gÆcm
)3
)
andthemolarmass(gÆmol
)1
)of
2
H
2
O, respectively. At
20 °C, the pressure dependence of q
2
H
2
O
(P) has only
been measured up to 100 MPa [38]. Therefore, the left
hand side of Eqn. 3 was calculated using the values of
the density of H
2
O as a function of pressure [39]
assuming that the molarities, q/M,of
2
H
2
OandH
2
Oare
identical at 20 °C for pressures lower than 300 MPa. Up
to 100 MPa this approximation leads to negligible errors
compared to those resulting from small levels of hydro-
gen contamination which always occur during sample
preparation.
As a first approximation, the partial specific volume of
Mb was assumed to be independent of pressure and to have
the value v
p
(0.1) ¼ 0.741 cm
3
Æg
)1
[40] at atmospheric pres-
sure P @ 0.1 MPa. Accordingly, in the following analysis of
the scattering data the actual protein contrast given by
Eqn. 2 has been replaced by the quantity
K
0
ðPÞ¼ b
p
N
A
M
p
À q
0
b
ðPÞv
p
ð0:1Þ
!
ð4Þ
where q
0
b
ðP Þ is given by Eqn. 3.
Using this expression and the virial expansion for the
osmotic pressure, Eqn. 1 can be rewritten as follows
cðPÞ½K
0
ðPÞ
2
Ið0;P;cÞ
¼
N
A
M
p
K
0
ðPÞ
KðPÞ
!
2
1 þ 2A
2
ðPÞM
p
cðPÞþÁÁÁ
ÂÃ
ð5Þ
where A
2
(P) is the second virial coefficient of the solution.
It describes the interactions between pairs of solute
molecules and provides an estimate of the nonideality of
the solution. A
2
(P) > 0 for repulsive interactions
between the solute molecules. For relatively low solute
concentrations, higher order terms in c(P) are negligible. As
both K
0
(P)andK(P) do not depend on c(P), a plot of
c(P)[K
0
(P)]
2
/I(0,P,c)vs.c(P) allows the value of A
2
(P)to
be determined. The pressure dependence of the protein
concentration was calculated by means of the expres-
sion cðP Þ¼cð0:1Þq
2
H
2
O
ðP Þ=q
2
H
2
O
ð0:1Þ,wherec(0.1) and
4732 C. Loupiac et al. (Eur. J. Biochem. 269) Ó FEBS 2002
q
2
H
2
O
ð0:1Þ are the protein concentration and the density of
heavy water at atmospheric pressure, respectively. As in
Eqn. 3, the values of c(P) were calculated using the densities
of H
2
O.
The SANS spectra from the protein were described by the
Guinier approximation [41]
Iðq; P; cÞffiIð0; P; cÞ exp½Àq
2
R
2
g
ðP; cÞ=3ð6Þ
where R
g
(P,c) is the apparent value (nm) of the radius of
gyration of the protein at pressure P and concentration c(P).
For an almost spherical solute particle this approximation is
valid to within 1% for qR
g
(P,c) £ 1.3 [41]. For a Mb
molecule, this corresponds to q £ 0.9 nm
)1
.AlltheSANS
spectra were collected within this range.
The concentration dependence of the radius of gyration
can be accounted for by
½R
g
ðP;cÞ
À2
¼½R
g
ðP; 0Þ
À2
½1 þ 2B
2
ðPÞM
p
cðPÞþÁÁÁ
ð7Þ
where R
g
(P,0) is the actual value of the radius of gyration of
the protein and B
2
(P) a constant similar to A
2
(P)inEqn.5
but with a different value. For each pressure, R
g
(P,0) can be
inferred from the intercept of the plot of [R
g
(P,c)]
)2
as a
function of c(P).
RESULTS
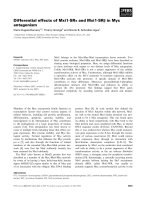
SANS measurements were performed at three protein
concentrations measured at atmospheric pressure: 5.7,
11.7, and 16.2 mgÆcm
)3
. Figure 1 shows the neutron
scattering spectra obtained at 54, 154, and 302 MPa for
thesampleat11.7mgÆcm
)3
. For the spectrometer config-
uration used in these experiments, the first two points at the
lowest q-values are affected by a small contribution from
the direct neutron beam. Consequently, no significant
increase of the scattered intensity is observed for the
smallest q-values. This demonstrates that no protein aggre-
gation or oligomerization occurred in the samples, irrespec-
tive of the pressure.
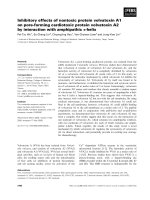
To determine the apparent value of the radius of
gyration, R
g
(P,c), of the MbN
3
molecule and the forward
scattered intensity, I(0,P,c), Eqn 6 was fitted to these spectra
and those from the samples at the other two concentrations.
As shown in Fig. 2, the values of the actual radius of
gyration, R
g
(P,0), at each pressure were inferred from
R
g
(P,c) by extrapolation to c(P) ¼ 0 according to Eqn 7.
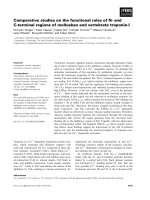
Figure 3 shows no significant variation of R
g
(P,0) within
the studied pressure range. The mean value of the actual
radius of gyration of MbN
3
is R
g
(P,0) ¼ (1.52 ± 0.03) nm,
in good agreement with the results of previous SANS
studies of horse and sperm whale Mb at atmospheric
pressure and finite concentrations [37,42]. Therefore, the
reorganization of the secondary structure of Mb that has
been observed by FTIR [23,24] does not affect the
compactness of the protein.
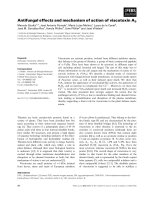
According to Eqn 5 the slope of the plot of c(P)[K
0
(P)]
2
/
I(0,P,c)vs.c(P) allows the second virial coefficient, A
2
(P), to
0.0 0.2 0.4 0.6 0.8
q
(nm
–1
)
0.15
0.20
0.25
0.30
0.35
0.40
0.45
I(q,P,c) (a.u.)
Fig. 1. Scattering spectra I(q,P,c)ofMbN
3
at p
2
H 6.6, as a function of
the wave-number transfer q. The measurements were performed at
room temperature. The protein concentration, c, at atmospheric
pressure is 11.7 mgÆcm
)3
and the pressures, P,are:54(s), 154 (n), and
302 (h) MPa. Fits of Eqn 6 to the data are shown as full lines.
0 5 10 15 20
c (mg·cm
-3
)
0.35
0.40
0.45
0.50
0.55
[R
g
(P,c)]
–2
(nm
–2
)
0 5 10 15 20
0.35
0.40
0.45
0.50
0.55
[R
g
(P,c)]
–2
(nm
–2
)
0 5 10 15 20
0.35
0.40
0.45
0.50
0.55
[R
g
(P,c)]
–2
(nm
–2
)
C
B
A
Fig. 2. Reciprocal of the square of the apparent radius of gyration,
R
g
(P,c), as a function of MbN
3
concentration c(P). (A) P ¼ 54 MPa,
(B) P ¼ 154 MPa, and (C) P ¼ 302 MPa. The solid lines are linear
regressions.
Ó FEBS 2002 Pressure effects on azidometmyoglobin (Eur. J. Biochem. 269) 4733
be determined. Figure 4 shows such plots for each studied
pressure. The pressure dependence of A
2
(P) is given in
Fig. 5. A
2
(P) decreases from 7.2 · 10
)4
cm
3
ÆmolÆg
)2
at
54 MPa to 5.6 · 10
)4
cm
3
ÆmolÆg
)2
at 302 MPa. The posi-
tive values of A
2
(P) indicate that the interactions between
two protein molecules are repulsive irrespective of the
pressure.
The second virial coefficient of a macromolecular
solution can be estimated by means of the relation
A
2
ðP Þ¼4p
3=2
wN
A
½R
g
ðP ; 0Þ
3
M
À2
p
[43,44], where w is a
constant depending on the shape and the conformation of
the molecule. For hard spheres w ¼ 4pð5=3pÞ
3=2
=3 ¼
1:619 [45]. If Mb molecules are regarded as hard spheres,
the second virial coefficient would be close to 2.1 ·
10
)4
cm
3
ÆmolÆg
)2
. The much larger value of A
2
(P) inferred
from the present SANS measurements at the lowest pressure
is not due to the ellipsoid shape of Mb [37,42] but to the
presence of electric charges on the protein surface and
possibly, to a high surface hydration. Accordingly, the
weakening of the repulsive interactions with increasing
pressures can be attributed to either a decrease of the protein
charge due to changes of the pKs of the side chains or a
change of the protein hydration, or both these effects.
As previously explained in Materials and methods, c(P)
[K
0
(P)]
2
/I(0,P,c) has been calculated assuming that the
partial specific volume of MbN
3
does not depend on the
pressure and keeps the value v
p
(0.1) ¼ 0.741 cm
3
Æg
)1
at
atmospheric pressure. According to Eqn 5, {c(P)[K
0
(P)]
2
/
I(0,P,c)}
)1/2
extrapolated to c(P) ¼ 0 is proportional to the
relative value of the actual protein contrast K(P)/K
0
(P).
Figure 6 shows how this quantity vary with applied
pressure. As no aggregation occurred during the experi-
ments, any change in this ratio has to be ascribed to the
variation of the average contrast of Mb with pressure and
therefore to that of its specific volume v
p
(P). From the
almost linear variation of v
p
(P) with pressure shown in
Fig. 7, the values of both the specific volume, v
p
(0.1), at
atmospheric pressure and the isothermal compressibility
j
T;p
¼À
1
v
p
ð0:1Þ
ov
p
ðPÞ
oP
T
ð8Þ
of hydrated Mb can be readily inferred. They are found
to be v
p
(0.1) ¼ (0.741 ± 0.003) cm
3
Æg
)1
and j
T,p
¼ (1.6 ±
0.1) 10
)4
MPa
)1
at about 20 °C. The value of v
p
(0.1) agrees
well with that [40] used throughout the present analysis.
DISCUSSION
Previous studies on Mb under high hydrostatic pressures
were performed by means of typical spectroscopic tech-
niques that give information on the active site and on the
secondary structure. All these investigations have shown that
0 5 10 15 20
c (m
g
·cm
–3
)
2.0
2.4
2.8
3.2
3.6
c(P)[K
0
(P)]
2
/I(0,P,c) (a.u.)
0 5 10 15 20
2.0
2.4
2.8
3.2
3.6
c(P)[K
0
(P)]
2
/I(0,P,c) (a.u.)
0 5 10 15 20
2.0
2.4
2.8
3.2
3.6
c(P)[K
0
(P)]
2
/I(0,P,c) (a.u.)
C
B
A
Fig. 4. Plots of the quantity c(P)[K
0
(P)]
2
/I(0,P,c) as a function of the
MbN
3
concentration c(P) at pressure P. I(0,P,c) is the forward scattered
intensity and K
0
(P) the protein contrast defined by Eqn 4. K
0
(P)
is calculated assuming that the partial specific volume of MbN
3
is
independent of P and has an atmospheric pressure value
v
p
(0.1) ¼ 0.741 cm
3
Æg
)1
. According to Eqn 5, the slope of the solid
regression lines is proportional to the second virial coefficient A
2
(P).
(A) P ¼ 54 MPa, (B) P ¼ 154 MPa, and (C) P ¼ 302 MPa.
0 100 200 300
P (MPa)
1.2
1.3
1.4
1.5
1.6
1.7
1.8
R
g
(P,0) (nm)
Fig. 3. Radius of gyration R
g
(P,0) of MbN
3
at p
2
H 6.6 at vanishing
protein concentration as a function of pressure, P.
4734 C. Loupiac et al. (Eur. J. Biochem. 269) Ó FEBS 2002
moderate pressures near 300 MPa induce subtle structural
rearrangements of the protein matrix whereas higher
pressures, near 1 GPa, lead to unfolding. Pressure may
also induce changes in the heme structure and in the spin
state of the iron atom [17,18,20,21,26–29]. Other studies of
proteins at high pressures have shown that they react as a
whole, simultaneously adapting their structure, their spatial
charge distribution and their interactions with the solvent
[2,3].
The present SANS measurements on MbN
3
at pres-
sures up to about 300 MPa indicate that the structural
reorganization of the active site previously observed by
optical absorption in the UV-visible range [17,18,20,21],
Raman [26], and NMR [27–29] spectroscopies and the
secondary structure modifications observed by FTIR
through the amide I¢ band [23,24] are not related to a
change of compactness of Mb as its radius of gyration
remains constant. This does not means that MbN
3
remainsinthenativestateupto300MPa.Morelikely,
the protein starts to denature at a lower pressure and
becomes a slightly swollen molten globule. The value of
the radius of gyration given by neutron scattering is
indeed rather insensitive to the early stages of protein
unfolding. This has been demonstrated for neocarzinos-
tatine denatured by guanidinium chloride [46]. In the
FTIR studies it was suggested that, in addition to the
strengthening of the hydrogen bond network with
increasing pressure, the bonding of a C¼O group with
aN
2
H group and a water molecule may also occur. This
means that the protein may become more hydrated with
increasing pressure [24]. This increase of hydration might
be due to the appearance of a molten globule state as
the pressure dependence of the second virial coefficient
suggests that the surface hydration decreases with
pressure.
The present SANS study allowed the specific volume of
MbN
3
to be determined as a function of pressure. It
decreases by about 5.4% between atmospheric pressure and
300 MPa. Within the uncertainties of the only three
measurements carried out in this pressure range, the
isothermal compressibility of hydrated MbN
3
is almost
constant. Its value is j
T,p
¼ (1.6 ± 0.1) 10
)4
MPa
)1
at
about 20 °C. Therefore, hydrated MbN
3
is about two to
three times as incompressible as H
2
Oor
2
H
2
Oatthesame
temperature. The value of the isothermal compressibility of
hydrated MbN
3
compares well with that obtained by
densimetry for staphylococcal nuclease at 25 °C:
j
T,p
¼ (1.1 ± 0.2) 10
)4
MPa
)1
between atmospheric pres-
sure and 60 MPa [47].
The above-mentioned values of the isothermal compress-
ibility, j
T,p
, of proteins cannot be directly compared with
those of the adiabatic compressibility, j
S
, inferred from
ultrasound velocity measurements [48–53]. According to
Eqn 8, j
T,p
is a characteristic property of the hydrated
protein alone whereas j
S
is not as it is measured at constant
0 100 200 300
P (MPa)
0.63
0.65
0.67
0.69
{c(P)[K
0
(P)]
2
/I(0,P,c)}
–1/2
(a.u.)
Fig. 6. Plot of the quantity {c(P)[K
0
(P)]
2
/I(0,P,c)}
)1/2
at vanishing
protein concentration, c(P), as a function of pressure, P. I(0,P,c)isthe
forward scattered intensity and K
0
(P) the protein contrast defined by
Eqn 4. K
0
(P) is calculated assuming that the specific volume of MbN
3
is independent of P and has an atmospheric pressure value
m
p
(0.1) ¼ 0.741 cm
3
Æg
)1
.DataforMbN
3
at p
2
H6.6and20°C.
0 100 200 300
P (MPa)
0.700
0.710
0.720
0.730
0.740
0.750
v
p
(cm
3
g
–1
)
Fig. 7. Partial specific volume v
p
(P), of MbN
3
as a function of pressure,
P. The almost linear variation of m
p
(P)withP allows the isothermal
compressibility of the hydrated protein to be computed: j
T,p
¼
(1.6 ± 0.1) 10
)4
MPa
)1
.
0 100 200 300
P (MPa)
5
6
7
8
A
2
(P) (10
–4
cm
3
mol g
–2
)
Fig. 5. Second virial coefficient, A
2
(P), of MbN
3
at p
2
H6.6, as a
function of pressure, P.
Ó FEBS 2002 Pressure effects on azidometmyoglobin (Eur. J. Biochem. 269) 4735
entropy, S, of the solution. As a result j
S
is also sensitive to
the thermodynamic properties of the solvent. Nevertheless,
the value of j
T,p
can be inferred from that of j
S
if the
densities, the thermal expansions and the specific heats at
constant pressure of the solvent and the protein are known
[53].
Once the value of j
T,p
is obtained, in this way or better
still by means of densimetric or SANS measurements, it is
possible to estimate the adiabatic compressibility, j
S,p
,
characteristic of the hydrated protein. This compressibility
at constant entropy of the hydrated protein is given by the
standard thermodynamic expression
j
T;p
¼ j
S;p
þ Ta
2
p
v
p
=C
P;p
ð9Þ
where a
p
and C
P,p
are the thermal expansion and the specific
heat at constant pressure of the hydrated protein, respec-
tively.
j
T,p
and j
S,p
are important quantities because their values
provide an estimate of the magnitude of the different type of
movements inside the hydrated protein. j
S,p
is the mean
amplitude of the vibrational motions, or phonons, whereas
(j
T,p
) j
S,p
) is that of the diffusive ones, associated with
heat diffusion.
This first SANS study of myoglobin at high hydro-
static pressures shows that this approach not only gives
global structural information about the protein molecule
but also allows the protein–solvent interactions and the
isothermal compressibility of the hydrated protein to be
measured. Such information is important in order to
understand the properties of proteins under pressure. In
the future it would be beneficial to perform SANS
measurements at higher pressures in order to determine
the properties and the conformations of the various
denatured states.
REFERENCES
1. Morild, E. (1981) Theory of the pressure effects on enzymes. Adv.
Protein Chem. 34, 93–168.
2. Frauenfelder, H., Alberding, N.A., Ansari, A., Braunstein, D.,
Cowen, B.R., Hong, M.K., Iben, I.E.T., Johnson, J.B., Luck, S.,
Marden, M.C., Mourant, J.R., Ormos, P., Reinisch, L., Scholl, R.,
Schulte, A., Shyamsunder, E., Sorensen, L.B., Steinbach, P.J., Xie,
A., Young, R.D. & Yue, K.T. (1990) Proteins and pressure.
J. Phys. Chem. 94, 1024–1037.
3. Silva, J.L. & Weber, G. (1993) Pressure stability of proteins. Annu.
Rev. Phys. Chem. 44, 89–113.
4. Mozhaev, V.V., Heremans, K., Frank, J., Masson, P. & Balny, C.
(1996) High-pressure effects on protein structure and function.
Proteins 24, 81–91.
5. Heremans, K. (1982) High-pressure effects on proteins and other
biomolecules. Annu. Rev. Biophys. Bioeng. 11, 1–21.
6. Weber, G. & Drickamer, H.G. (1983) The effect of high pressure
upon proteins and other biomolecules. Quart. Rev. Biophys. 16,
89–112.
7. Weber, G. (1987) In High Pressure Chemistry and Biochemistry
(van Eldik, R. & Jonas, J., eds), pp. 401–420. Reidel Publishing
Co., Dordrecht, the Netherlands.
8. Gross, M. & Ja
¨
nicke, R. (1994) Proteins under pressure. The
influence of high hydrostatic pressure on structure, function, and
assembly of proteins and protein complexes. Eur.J.Biochem.221,
617–630.
9. Kauzmann, W. (1959) Some factors in the interpretation of
protein denaturation. Adv. Protein Chem. 14, 1–63.
10. Boje, L. & Hvidt, A. (1972) Volume effects in aqueous solutions of
macromolecules containing non-polar groups. Biopolymers 11,
2357–2364.
11. Paladini, A.A. & Weber, G. (1981) Pressure-induced reversible
dissociation of enolase. Biochemistry 20, 2587–2593.
12. Rashin, A.A., Iofin, M. & Honig, B. (1986) Internal cavities and
buried waters in globular proteins. Biochemistry 25, 3619–3625.
13. Van Eldik, R., Asano, T. & Le Noble, W.J. (1989) Activation and
reaction volume in solution. Chem. Rev. 89, 549–688.
14. Royer, C.A. (1995) Application of pressure to biochemical equi-
libria: the other thermodynamic variable. Methods Enzymol. 259,
357–377.
15. Frye, K.J. & Royer, C.A. (1998) Probing the contribution of
internal cavities to the volume change of protein unfolding under
pressure. Protein Sci. 7, 2217–2222.
16. Zipp, A. & Kauzmann, W. (1973) Pressure denaturation of met-
myoglobin. Biochemistry 12, 4217–4228.
17. Ogunmola,G.B.,Zipp,A.,Chen,F.&Kauzmann,W.(1977)
Effects of pressure on visible spectra of complexes of myoglobin,
hemoglobin, cytochrome c, and horse radish peroxidase. Proc.
Natl Acad. Sci. USA 74, 1–4.
18. Heremans, K. & Bormans, M. (1986) Pressure effects on heme
proteins. Physica 139&140B, 870–874.
19. Swanson, B.I., Agnew, S.F., Ondrias, M.R. & Alden, R.G. (1986)
Optical spectroscopic studies of heme proteins at high pressure.
J. Am. Chem. Soc. 108, 341–343.
20. Heremans, K. (1987) In High Pressure Chemistry and Biochemistry
(van Eldik, R. & Jonas, J., eds), pp. 421–445. Reidel Publishing
Co., Dordrecht, the Netherlands.
21. Alden, R.G., Satterlee, J.D., Mintorovitch, J., Constantinidis, I.,
Ondrias, M.R. & Swanson, B.I. (1989) The effects of high pressure
upon liganted and deoxyhemoglobins and myoglobin. An optical
spectroscopic study. J. Biol. Chem. 264, 1933–1940.
22. Marden, M.C., Hui Bon Hoa, G. & Stetzkowski-Marden, F.
(1986) Heme protein fluorescence versus pressure. Biophys. J. 49,
619–627.
23. Le Tilly, V., Sire, O., Wong, P.T.T. & Alpert, B. (1992) pH
dependence of hydrogen bond strengths in myoglobin a-helices.
Chem. Phys. Lett. 192, 62–64.
24. Le Tilly, V., Sire, O., Alpert, B. & Wong, P.T.T. (1992) An
infrared study of
2
H-bond variation in myoglobin revealed by high
pressure. Eur.J.Biochem.205, 1061–1065.
25. Smeller, L., Rubens, P. & Heremans, K. (1999) Pressure effect on
the temperature-induced unfolding and tendency to aggregate of
myoglobin. Biochemistry 38, 3816–3820.
26. Galkin, O., Butcher, S., Tabirian, A. & Schulte, A. (1997) Pressure
effects on the proximal heme pocket in myoglobin probed by
Raman and near-infrared absorption spectroscopy. Biophys. J. 73,
2752–2763.
27. Morishima, I., Ogawa, S. & Yamada, H. (1979) Nuclear magnetic
resonance studies of the effects of pressure on the heme environ-
mental structure of hemeproteins. J. Am. Chem. Soc. 101,7074–
7076.
28. Morishima, I. & Hara, M. (1982) High-pressure NMR studies of
hemeproteins. Pressure-induced structural changes in the heme
environments of cyanometmyoglobin. J. Am. Chem. Soc. 104,
6833–6834.
29. Morishima, I. & Hara, M. (1983) High-pressure nuclear magnetic
resonance studies of hemeproteins. Pressure-induced structural
changes in the heme environments of ferric low-spin metmyoglbin
complexes. Biochemistry 22, 4102–4107.
30. Hasinoff, B.B. (1974) Kinetic activation volumes of the binding of
oxygen and carbon monoxide to hemoglobin and myoglobin
studied on a high-pressure laser flash photolysis apparatus.
Biochemistry 13, 3111–3117.
31. Adachi, S. & Morishima, I. (1989) The effects of pressure on
oxygen and carbon monoxide binding kinetics for myoglobin.
4736 C. Loupiac et al. (Eur. J. Biochem. 269) Ó FEBS 2002
A high-pressure laser flash photolysis study. J. Biol. Chem. 264,
18896–18901.
32. Uchida, T., Ishimori, K. & Morishima, I. (2000) Unusual pressure
effects on ligand rebinding to the human myoglobin leucine 29
mutants. J. Biol. Chem. 275, 30309–30316.
33.Higgins,J.S.&Benoıˆ t, H.C. (1994) Polymers and Neutron
Scattering, pp. 195–203. Clarendon Press, Oxford, UK.
34. Pin, S., Royer, C.A., Gratton, E., Alpert, B. & Weber, G. (1990)
Subunit interactions in hemoglobin probed by fluorescence and
high-pressure techniques. Biochemistry 29, 9194–9202.
35. Neuman, R.C., Kauzmann, W. & Zipp, A. (1973) Pressure
dependence of weak acid ionization in aqueous buffers. J. Phys.
Chem. 77, 2687–2691.
36. Blanck, J., Graf, W. & Scheler, W. (1961) Kinetic studies on the
formation of metmyoglobin aggregates. ActaBiol.Med.Germ.7,
323–326.
37. Glandie
`
res, J M., Calmettes, P., Martel, P., Zentz, C., Massat, A.,
Ramstein, J. & Alpert, B. (1995) Solvent-induced structural
distortions of horse metmyoglobin. Eur.J.Biochem.227, 241–248.
38. Emmet, R.T. & Millero, F.J. (1975) Specific volume of deuterium
oxyde from 2° to 40°C and 0–1000 bars applied pressure. J. Chem.
Eng. Data 20, 351–356.
39. Haar, L., Gallagher, J.S. & Kell, G.S. (1984) NBS/NRC Steam
Tables. Taylor & Francis, Bristol, UK.
40. Theorell, H. (1934) Kristallinisches Myoglobin. II. Mitteilung:
Sedimentationkonstante und Molekulargewicht des Myoglobins.
Biochem. Z. 268, 46–54.
41. Guinier, A. & Fournet, G. (1955) Small-Angle Scattering of
X-Rays. J. Wiley & Sons, New York, USA.
42. Ibel, K. & Stuhrmann, H.B. (1975) Comparison of neutron and
X-ray scattering of dilute myoglobin solutions. J. Mol. Biol. 93,
255–265.
43. Douglas, J.F. & Freed, K.F. (1985) Renormalization of the two-
parameter theory. 2. Comparison with experiment and other two-
parameter theories. Macromolecules 18, 201–211.
44. des Cloizeaux, J. & Jannink, G. (1990) Polymers in Solution: Their
Modelling and Their Structure. Clarendon Press, Oxford, UK.
45. Douglas, J.F. & Freed, K.F. (1984) Penetration function and
second virial coefficient for linear and regular star polymers.
Macromolecules 17, 1854–1870.
46. Russo, D., Durand, D., Calmettes, P. & Desmadril, M. (2001)
Characterization of the denatured states distribution of neocarzi-
nostatin by small-angle neutron scattering and differential scan-
ning calorimetry. Biochemistry 40, 3958–3966.
47.Seemann,H.,Winter,R.&Royer,C.A.(2001)Volume,
expansivity and isothermal compressibility changes associated
with temperature and pressure unfolding of staphylococcal
nuclease. J. Mol. Biol. 307, 1091–1102.
48. Gekko, K. & Noguchi, H. (1979) Compressibility of globular
proteins in water at 25°C. J. Phys. Chem. 83, 2706–2714.
49. Gavish, B., Gratton, E. & Hardy, C.J. (1983) Adiabatic com-
pressibility of globular proteins. Proc. Natl Acad. Sci. USA 80,
750–754.
50. Kharakoz, D.P. & Sarvazyan, A.P. (1993) Hydrational and
intrinsic compressibilities of globular proteins. Biopolymers 33,
11–26.
51. Chalikian, T.V., Totrov, M., Abagyan, R. & Breslauer, K.J.
(1996) The hydration of globular proteins as derived from volume
and compressibility measurements: cross correlating thermo-
dynamic and structural data. J. Mol. Biol. 260, 588–603.
52. Kharakoz, D.P. (2000) Protein compressibility, dynamics, and
pressure. Biophys. J. 79, 511–525.
53. Taulier, N. & Chalikian, T.V. (2002) Compressibility of protein
transitions. Biochim. Biophys. Acta 1595, 48–70.
Ó FEBS 2002 Pressure effects on azidometmyoglobin (Eur. J. Biochem. 269) 4737