Executive Summary: 2013 Edelman Trust Barometer doc
Bạn đang xem bản rút gọn của tài liệu. Xem và tải ngay bản đầy đủ của tài liệu tại đây (3.21 MB, 12 trang )
2013
Edelman Trust Barometer
Executive Summary
1
Less than one fifth of the general public believes
business leaders and government officials will tell
the truth when confronted with a difficult issue.
There also is a growing trust gap between institu-
tions and their leaders – globally, trust in business
is 32 points higher than trust in business leaders
to tell the truth; trust in government is 28 points
higher than it is for government officials.
The continuing lack of faith in traditional leaders was reinforced by
a series of highly publicized wrongdoings again last year. Former
McKinsey managing partner Rajat Gupta was convicted of pass-
ing inside information. Bob Diamond resigned as CEO of Barclays
after the revelation of rampant fixing of the Libor rate by traders.
Bo Xilai was removed from the highest ranks of the Chinese gov-
ernment after exposure of personal corruption.
The research confirms the democratizing trend of recent years –
the redistribution of influence from traditional authority figures such
as CEOs and prime ministers toward employees, peers and people
with credentials, including academics and technical experts. A
professor or person like yourself is now trusted nearly twice as
much as a chief executive or government official. The hierarchies
of old are being replaced by more trusted peer-to-peer, horizontal
networks of trust.
The shock of 2008, the subsequent recession and misdeeds by
establishment figures have forced a reset in expectations of insti-
tutions and their leaders. What a company does as well as how it
does it are now both dependent upon trust and credibility. Running
a profitable business and having top-rated leadership no longer,
alone, build long-term trust. In fact, these operational-based at-
tributes have become an expectation. Today, business builds trust
by treating employees well, exhibiting ethical
and transparent practices and placing cus-
tomers ahead of profits while also delivering
quality products and services. Business must
embrace a new mantra: move beyond earn-
ing the License to Operate – the minimum
required standard – toward earning a License
to Lead – in which business serves the needs
of shareholders and broader stakeholders by
being profitable and acting as a positive force
in society.
Business must also change the way it engag
-
es stakeholders. We are in an era of skepti-
cism; people need to see or hear something
three to five times in different places before
believing it, and learn equally from traditional
and social channels. The traditional pyramid
of authority, with elites driving communica-
tions top down to mass audiences, is now
joined by an inverted pyramid of community
– employees, action consumers and social
activists involved in real-time, horizontal, con-
stant peer-to-peer dialogue resulting in a new
diamond of influence. Smart institutions will
use vertical one-way communications while
continually participating in the ongoing hori-
zontal conversation.
Times call for Inclusive Management in
which CEOs and government officials:
͚
Establish a vision and transparently share
reasoning, purpose and results.
͚ Enlist a broader range of advocates, includ-
ing employees, action consumers, social ac-
tivists, academics and think tanks, seeking
their input and reaction.
͚
Embrace all channels of communications,
actively listening to new voices of influence,
and adapting.
͚
Shift from vision to implementation with
transparent measures guided by continual
engagement.
Crisis in Leadership
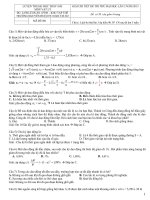
CRISIS IN LEADERSHIP – TRUST IN ETHICS AND MORALITY VERY LOW
How much do you trust business leaders to do the following?
Government Leaders
Business Leaders
26%
20%
19%
18%
SOLVE SOCIAL OR
SOCIETAL ISSUES
CORRECT ISSUES WITHIN
INDUSTRIES THAT ARE
EXPERIENCING PROBLEMS
MAKE ETHICAL AND
MORAL DECISIONS
TELL YOU THE TRUTH,
REGARDLESS OF HOW COMPLEX
OR UNPOPULAR IT IS
15% 15%
14%
13%
SOLVE SOCIAL OR
SOCIETAL ISSUES
CORRECT ISSUES WITHIN
INDUSTRIES THAT ARE
EXPERIENCING PROBLEMS
MAKE ETHICAL AND
MORAL DECISIONS
TELL YOU THE TRUTH,
REGARDLESS OF HOW COMPLEX
OR UNPOPULAR IT IS
The 2013 Edelman Trust Barometer demonstrates a serious crisis of confidence in leaders of both
business and government.
Crisis in Leadership – Trust in Ethics and Morality Very Low
How much do you trust business and government leaders to
do the following?
22013
|
Trust Barometer
The times also demand that leaders behave differently. As Jeffrey
Sonnenfeld, professor and dean at Yale University, notes: “Reli-
ant, but sidetracked leaders have learned, they cannot rely on their
prominent roles or ideas alone to win over key constituents. Ground-
ed Leadership builds legitimacy in key constituent groups and is
based in personal dynamism, empathy, authenticity, inspirational
goals and courage.”
The fi nancial services industry has a tremendous opportunity to be
the litmus test for this new approach. With its issues of money-
laundering, bid-rigging and trading-desk-malfeasance and once
again being the least-trusted business sector, industry leaders
must explain their business model, have understandable and
transparent metrics, engage in all channels of communications
and prove the industry is working in the public interest. As Profes-
sor John Coffee of Columbia University said in a recent editorial in
the Financial Times: “Global banks will need to compete not only
over price and quality of services but over reputation.”
Tomorrow’s trusted leaders will authentically embrace Inclusive
Management. As Ford CEO Alan Mulally has said: “You learn
from everybody.”
THE NEW DYNAMIC: THE DIAMOND OF INFLUENCE
ACTION CONSUMERS
GENERAL POPULATION
BOARD OF DIRECTORS
ACADEMICS
TECHNICAL EXPERTS
ELITE MEDIA
EMPLOYEES
TO 2013FROM 2000
FROM 2000
PYRAMID OF
COMMUNITY
(Horizontal)
PYRAMID OF
AUTHORITY
(Vercal)
Few
Dictate
Fixed
Monologue
Control
Many
Co-Create
Flexible
Dialogue
Empowerment
SOCIAL
ACTIVISTS
Table of Contents
State of Trust
page 3
Trust in
Institutions
page 4
Determining
Factors for Trust
in Business
page 6
Trust in Banking &
Financial Services
Industry
page 7
Most Trusted
Spokespeople
page 8
Building Trust
page 9
New Infl uence
Dynamic
page 10
The New Dynamic: The Diamond of Infl uence
3
Trust Is on the Rise, But Storm Clouds Loom
Building trust has never been more important – nor more challenging
Trust in business, government, media and NGOs is on
the rise.
This year, the Trust Index rose from a score of 51 in 2012
to 57 (fi gure 1). The number of countries that the survey
showed to be “trusters” – those with at least a 60 percent
average trust in the four institutions – rose from 2012, in
which there were eight, to 2013, in which there are nine.
But the intensity of trust in each institution remains low,
despite a slight uptick this year, with “trust a great deal”
in NGOs the highest at a still-modest 22 percent. “Trust
a great deal” is even lower in government (16 percent)
and business and media (tied at 17 percent).
Where we might have distinguished trust by geography
in the past, today that no longer holds. For instance,
while much of Asia falls in the truster category (six of
the nine trusters) it’s not across the board, with Japan
and South Korea, as with much of the developed world
surveyed, categorized as distrusters. Of the 17 coun-
tries considered neutral or distrusters, 12 of them (71
percent) are developed countries, while only fi ve are
emerging countries. But even this distinction does not
neatly explain trust levels.
Figure 1: Edelman’s Trust Index: After a Year of High Distrust in 2012, Shift Back to Neutral in 2013
Composite score is an average of a country’s trust in all four institutions.
2011
EDELMAN’S TRUST INDEX: AFTER A YEAR HIGH OF DISTRUST IN 2012,
SHIFT BACK TO NEUTRAL IN 2013
GLOBAL 55 GLOBAL 51 GLOBAL 57
Big Changes
from 2008
Germany +19
China +18
Canada +14
India +11
Big Changes
from 2012
Germany +16
France +14
UK +12
US +10
Big Changes
from 2012
Germany +16
France +14
UK +12
US +10
2012 2013
Brazil 80
UAE 78
Indonesia 74
China 73
Netherlands 73
Mexico 69
Singapore 67
Argenna 62
India 56
Italy 56
Canada 55
South Korea 53
Sweden 52
Japan 51
Australia 51
Spain 51
France 50
Poland 49
Germany 44
U.S. 42
U.K. 40
Russia 40
Ireland 39
China 76
UAE 68
Singapore 67
India 65
Indonesia 63
Mexico 63
Netherlands 61
Hong Kong 61
Canada 58
Malaysia 57
Italy 56
Argenna 54
Australia 53
Brazil 51
Sweden 49
U.S. 49
South Korea 44
Poland 44
U.K. 41
Ireland 41
France 40
Germany 39
Spain 37
Japan 34
Russia 32
China 80
Singapore 76
India 71
Mexico 68
Hong Kong 67
UAE 66
Malaysia 64
Canada 62
Indonesia 62
U.S. 59
Netherlands 59
Brazil 55
Germany 55
France 54
Sweden 54
UK 53
Italy 51
Australia 50
Poland 48
S. Korea 47
Ireland 46
Argenna 45
Spain 42
Turkey 42
Japan 41
Russia 36
One of those five emerging countries is Brazil,
for example, which only two years ago, in 2011, was
the top global truster at 80. Today, trust Brazilians hold
for the four institutions has plunged to 55. Another of
the fi ve is Russia, which hasn’t shown much increase
in trust at all; it’s been at the bottom two years running,
32 in 2012 and 36 this year.
So while there is a correlation between economic
performance and trust, performance is not determina-
tive. Other factors come into play (see page 6 for more).
“Informed publics” vs. General Population
The Barometer shows a nine-point contrast in trust
between the general population (Trust Index score of 48)
and informed publics (Trust Index score of 57), which will
make it a challenge for business and government lead-
ers to build consensus and respond to serious issues of
the day. Broken down between developed and emerg-
ing countries, trust is signifi cantly higher among both
the general population and informed publics in emerg-
ing countries than in developed countries. In fact, no
developed countries were trusters based on the general
population and only two of nine were trusters based
on the informed publics.
Responses 6-9 only on 1-9 scale; 9 highest; Informed Publics ages 25-64
42013
|
Trust Barometer
Trust in Institutions – NGOs, Media, Government and Business
Drilling down into trust in each of the four institu-
tions shows some intriguing disparities and one
statistical commonality: trust has risen from 2012
across all institutions by 5 points (fi gure 2).
NGOs. Trust in NGOs remains high, with an
overall 88 percent of countries surveyed over
50 percent (the highest is Mexico, an emerg-
ing market, at 83 percent; the lowest is Japan,
a developed market, at 37 percent). The most
notable change over time is in China, where
only fi ve years ago trust in NGOs was 48 per-
cent; today it is 81 percent. Three of the top fi ve
countries with the highest trust in NGOs, like
China, are emerging markets.
Media. Trust in media, at 57 percent globally,
continues to improve with a fi ve-point increase
from 2012. Sixty-two percent of countries sur-
veyed have a trust score of 50 percent or above,
compared to 50 percent of countries surveyed
in 2008. Trust is signifi cantly higher in emerging
countries than in developed countries (fi gure 3).
Large gaps in trust also exist in how the general
population view types of media, with emerg-
ing markets placing more trust in social by 32
points, traditional by 14 points, online search
engines by 24 points, hybrid by 24 points and
owned by 22 points.
Trust in media breaks down along generational
lines, as well. Among all ages in the general
population, trust in traditional media and online
search engines is highest. But trust in the other
three categories of media drops among older
generations particularly (age 45+) to an average
of 34.5 percent for hybrid, 34 percent for owned
and 33 percent for social. Among the young-
est generation (ages 18-29), trust is highest in
online search engines (61 percent) and lowest
in owned media (44 percent).
Government. While trust in government is up,
among informed publics it remains below 50
percent in 62 percent of countries surveyed,
with 56 percent of those in developed countries.
Fifty percent of the general public who re-
ported trusting government less over the past
year agree that “corruption and fraud” and
“wrong incentives driving policies” account
Figure
3: Mainstream Media Reigns in Developed Markets,
Equivalence Among Sources in Emerging Markets
How much would you trust each type of source for general news
and information?
Figure 2: Trust on the Rise Across Institutions, But Weak Intensity
Persists
How much do you trust each institution to do what is right?
TRUST ON THE RISE ACROSS INSTITUTIONS, BUT WEAK INTENSITY PERSISTS
TRUST A GREAT DEAL
NGOS
BUSINESS
MEDIA
GOVERNMENT
2012 2013 2012 2013
2012
2013
2012
2013
Trust Total: 43%
Trust Total: 48%
Trust Total: 53%
Trust Total: 58%
Trust Total: 52%
Trust Total: 57%
Trust Total: 58%
Trust Total: 63%
How much you trust that instuon to do what is right
12%
15%
16%
17%
14%
19%
17%
22%
58%
58%
43%
41%
40%
51%
47%
32%
26%
30%
65%
71%
56%
58%
52%
TRADITIONAL MEDIA
ONLINE SEARCH
ENGINES
HYBRID MEDIA
SOCIAL MEDIA
OWNED MEDIA
Global
Developed
Emerging
MAINSTREAM MEDIA REIGNS IN DEVELOPED MARKETS,
EQUIVALENCE AMONG SOURCES IN EMERGING MARKETS
How much would you trust each type of source for general news and informaon?
58%
58%
43%
51%
51%
47%
65%
71%
59%
61%
49%
47%
44%
61%
60%
48%
45%
43%
56%
56%
40%
37%
37%
54%
49%
29%
29%
31%
TRADITIONAL MEDIA
ONLINE SEARCH
ENGINES
HYBRID MEDIA
SOCIAL MEDIA
OWNED MEDIA
18-29
30-44
45-64
65+
GLOBAL AGE BREAKDOWN
Responses 6-9 and 8-9 on 1-9 scale; 9 highest; Informed Publics ages 25-64
Responses 6-9 only on 1-9 scale; 9 highest; General Population
5
for their distrust most. Government’s per-
ceived incompetence (31 percent) also
drives mistrust. Government is trusted less
than business globally by nine points (59
percent vs. 50 percent).
A powerful gap also exists between trust
in government and trust in the credibility of
government leaders globally at 28 points
with government more trusted than govern-
ment leaders. In China, that gap extends
to 47 points followed by India at 35 points,
Germany at 32 points, the U.S. at 28 points
and France at 25 points. Government lead-
ers are less trusted than business leaders
across the board on a variety of criteria: their
ability to solve social or societal issues (15
percent vs. 19 percent); correct issues with-
in industries (15 percent vs. 26 percent);
and make ethical and moral decisions (14
percent vs. 20 percent).
Business. Trust in business, which rose
from 53 percent in 2012 to 58 percent in
2013, is 10 points higher than trust in gov-
ernment, which rose from 43 percent to 48
percent.
Business leaders, however, saw minimal
trust increases. Globally, only 43 percent
of informed publics trust CEOs as credible
spokespeople and only 18 percent of the
general population trust business leaders to
tell the truth regardless of how complex or
unpopular the truth is. The Barometer also
shows that trust is far lower in developed
countries. Of those with trust in CEOs lower
than 50 percent, 13 of 16 are developed
countries (fi gure 4).
More signifi cantly, as with government,
among the general population, the differ-
ence between trust in business and trust in
business leaders is nothing short of extraor-
dinary (fi gure 5). Globally, a 32-point gap
exists, while it’s a 35-point gap in the U.S.,
Australia and China; a 34-point gap in India;
and a 29-point gap in Germany. As noted
above, only 18 percent say they trust busi-
ness leaders to tell the truth. Business lead-
ers can take little solace knowing that it’s
even worse for government leaders, at only
13 percent trusting them to tell the truth.
Figure 5: Leadership Trust Gap
Gap in Trust in Institution vs. Trust in Leadership
33%
38%
38%
55%
71%
41%
France
Germany
US
India
China
Global
Trust in Government
Trust Government Leaders to tell the truth
37%
42%
50%
68%
67%
50%
France
Germany
US
India
China
Global
Trust in Business
Trust Business Leaders to tell the Truth
LEADERSHIP TRUST GAP
Gap in Trust in Instuon vs. Trust in Leadership
13%
32%
-28
24%
-47
20%
-35
6%
-32
10%
-28
8%
-25
-35
15%
-35
34%
-34
13%
-29
10%
-27
18%
-32
Figure
4: Majority of Markets Find Both Government and Business
Leaders Below 50 Percent in Their Credibility Rating
If you heard information about a company from each person,
how credible would the information be?
45%
52%
70%
55%
52%
73%
41%
52%
34%
36%
62%
55%
42%
22%
37%
39%
43%
27%
28%
56%
37%
34%
54%
26%
40%
35%
48%
38%
18%
36%
22%
32%
54%
23%
35%
22%
25%
54%
48%
35%
15%
31%
36%
41%
25%
27%
55%
37%
36%
56%
32%
47%
45%
60%
50%
Government official
or regulator Credibility
CEO Credibility
MAJORITY OF MARKETS FIND BOTH GOVERNMENT AND BUSINESS LEADERS
BELOW 50% IN THEIR CREDIBILITY RATING
Business leaders trusted
less than 50% in 16 of 26 markets
Government leaders trusted less
than 50% in 21 of 26 markets
Extremely Credible” and “Very Credible”; Informed Publics ages 25-64
General Population
62013
|
Trust Barometer
Trust Is Based on More Than Performance Alone
A built-in bias for particular industries, national identities and size impact how people feel
A variety of factors beyond economic perfor-
mance contribute to trust in business. The Ba-
rometer shows that three in particular – industry
category, nationality or location of headquarters
and size – play key roles in determining trust levels.
Industry. While trust in business is up, among
informed publics it’s not evenly distributed be-
tween industries (fi gure 6). Of 11 major industries,
for the seventh year, technology (77 percent) and,
for the fourth year, automotive (69 percent) re-
main the most trusted. Both may be covered
by a “reputation halo” due to a fl ourishing new
product fl ow, the global nature of their indus-
tries and the perception of fi nancial success.
Technology and automotive also are most-trust-
ed in both emerging and developed countries.
Food and beverage held steady as third-most-
trusted, modestly moving up from 64 percent
in 2012 to 66 percent in 2013. Telecommuni-
cations, which fell from its number two position
in 2011 (tied with automotive at 67 percent) to
number fi ve in 2012 (60 percent) held steady
there in 2013 (62 percent). Brewing and spirits
has slowly crept up since 2011, from 57 per-
cent to 59 percent in 2012 to 62 percent to-
day. Similarly, consumer packaged goods has
risen signifi cantly over the past four years – at
54 percent in 2009, today it is at 65 percent.
Of the 11 industries, banking (50 percent) and
fi nancial services (50 percent), on the other hand,
bring up the rear once again, though each re-
bounded from its 2012 depth (47 percent and
45 percent, respectively), a positive if unexcep-
tional change, not one that mitigates the risk
they continue to face. Developed countries in
particular are driving the low ranking for banks
and fi nancial services. (For more, see page 7).
Size. This year for the fi rst time, the Barom-
eter looked at the differences in trust in big
business and small business to do what’s
right, recognizing a signifi cant difference in per-
ceptions of the two. While among informed
publics globally trust in big business wins out
over trust in small business (70 percent vs. 62
percent), an inverse relationship of trust exists
between developed and emerging markets.
Developed countries place greater trust in
small business over big business (76 per-
cent vs. 53 percent), with the U.S. trust-
ing small business over big business by 31
points (86 percent vs. 55 percent) and the UK trusting small busi-
ness over big business by 30 points (78 percent vs. 48 percent).
The opposite is true in emerging countries (79 percent for big business vs.
70 percent for small business), which may see big business as a driver of
economic growth and opportunity. In China, for example, big business
is more trusted than small business by 24 points (89 percent vs. 65 per-
cent), while the gap in the UAE is 18 points (73 percent vs. 55 percent).
Nationality. Despite growing global mobility and connectiv-
ity, among informed publics, trust in companies headquartered in
emerging countries continues to face a trust discount. It remains
lower than trust in companies headquartered in developed coun-
tries. Of 17 countries, the bottom fi ve – Mexico, 31 percent; India,
34 percent; China, 35 percent; Russia, 36 percent; and Brazil, 41
percent – are all emerging. The most-trusted national identities are
Canada (76 percent), Germany (75 percent) and Sweden and Swit-
zerland (tied at 74 percent). Global trust in companies headquartered
in Canada, Germany and Sweden has remained steady since 2008.
Interestingly, while companies headquartered in a developed
country earn trust from those in both developed and emerg-
ing markets, companies headquartered in emerging markets
tend to be most trusted by those in other emerging markets only.
So trust in companies headquartered in China, India and Brazil, for
example, is considerably greater among other emerging coun-
tries. A gap of 39 points exists between trust in companies head-
quartered in China by emerging markets (58 percent) versus de-
veloped markets (19 percent). Gaps in trust of 21 points and 24
points exist between emerging markets’ and developed markets’
trust in companies headquartered in India and Brazil, respectively.
Figure
6: Slight Upticks in Many Scores, Financial Services and Banks
Remain Least Trusted
How much do you trust businesses in each of the following industries
to do what is right?
Technology #1
in all markets
surveyed*
SLIGHT UPTICKS IN MANY SCORES, FINANCIAL SERVICES AND
BANKS REMAIN LEAST TRUSTED
TRUST IN INDUSTRIES
2013
2012
77%
69%
66%
65%
62%
62%
59%
58%
53%
50%
50%
Technology
Automove
Food and beverage
Consumer packaged goods
Telecommunicaons
Brewing and spirits
Energy
Pharmaceucals
Media
Banks
Financial services
45%
47%
51%
53%
56%
59%
60%
62%
64%
66%
79%
Financial services
Banks
Media
Energy
Pharmaceucals
Brewing and spirits
Telecommunicaons
Food and beverage
Automove
Technology
77%
Technology
79%
Technology
2013: Top 3 in Developed Markets
#1 Technology
#2 Automove
#2 Brewing & Spirits
2013: Top 3 in Emerging Markets
#1 Technology
#2 Automove
#3 Consumer Packaged
Goods
#3 Energy
Consumer packaged goods
Responses 6-9 only on 1-9 scale; 9 highest; Informed Publics ages 25-64
7
“Extremely credible” and “very credible”; Informed Publics ages 35-64
Plagued by Scandal, Trust in the Financial Services Industry Takes a Hit
Globally, 63 percent say banking and fi nancial services behaviors are common across all business
Hardly a month passed in 2012 without another fi nancial services or-
ganization in crisis management. Whether allegations of mortgage
fraud at Deutsche Bank or money laundering at HSBC, Libor ma-
nipulation at Citi and Barclays (to name just two, both of which lost
their CEOs over it) or rogue traders at UBS, scandals drove news
coverage. In turn, among informed publics surveyed, 56 percent of
whom say that over the past year they have been aware of bank-
ing or fi nancial services scandals, the industry’s reputation suffered.
In fact, the Trust Barometer shows globally a dip in trust in banks
from 56 percent in 2008 to 45 percent today (fi gure 7). Of the 18
countries for which the Barometer has data back to 2008, over that
time trust in banks dipped in nine, eight of which are developed
countries. Over the past two years, trust in banking in the U.S. has
doubled from its lowest point at 25 percent in 2011 to 50 percent
in 2013. Eurozone trust in banking reached its low point in 2012.
Much of the trust people place in the banking and finan-
cial services industry rests on two attributes: perceived perfor-
mance and perceived behavior. In both, banks have fared poorly.
Performance: Of the top six areas in which banks operate – lend-
ing to small business, providing home mortgage loans, offering cred-
it cards, trading and investing in government debt, ensuring privacy
of personal information and overseeing IPOs – in fi ve of them, few-
er than 40 percent of informed publics in developed countries rate
them doing well, while the lone holdout, ensuring privacy of per-
sonal information, still remains below 50 percent. In emerging coun-
tries, privacy is the only area in which trust is more than 50 percent.
Canada and China rate banks as doing well in more than one of these
six areas – two in Canada, where overall trust in banks is 59 percent, and
fi ve in China, where trust in banks is 80 percent. In the UK, where over-
all trust in banks is 29 percent, all six areas fall below 40 percent trust.
Behavior: Among informed publics, the many
banking scandals of 2012 have caused a sig-
nifi cant trust defi cit linked to culture, corruption
and confl icts of interest (fi gure 8). Specifi cally,
among those who are familiar with banking/fi -
nancial services scandals over the past year, 25
percent of people felt corporate corruption was
the biggest cause of scandal while 23 percent
blamed corporate culture driven by compen-
sation and 11 percent blamed confl ict of inter-
ests. Cumulatively, these account for 59 percent.
People also point to lack of regulation (20 per-
cent), banks being seen as too large (13 per-
cent) and changes in the economy (6 percent).
As performance becomes a less important factor
in earning trust (see page 9), the importance of
how business behaves is growing. Only one in
fi ve respondents feel business leaders will make
ethical and moral decisions and only 18 percent
expect business leaders to tell the truth. Clearly
important, these behavioral aspects represent
a growing concern for people who see these
behaviors as fully within the control of business.
So the question becomes: to recapture and ex-
pand trust, do leaders in banking and fi nancial
services have what it takes (and are they willing
to modify their behavior) to overcome a damaged
industry reputation? Moreover, will business lead-
ers (outside fi nancial services) and governmen-
tal leaders, all of whom the Barometer suggests
are tarred with the same brush, listen and learn?
50%
SEVERE DROPS IN TRUST IN BANKS OVER FIVE YEARS, 2/3 OF
MARKETS NOW BELOW 50% TRUST LEVEL
2013
2008
-20
-19
-25
-19
-26
-24
+ 11
-13
-13
-25
-11
-20
-19
-25
-19
-19
-26
-26
-24
-13
-13
-25
-11
56%
72%
83%
61%
59%
49%
67%
52%
69%
53%
63%
51%
35%
26%
56%
42%
47%
45%
35%
45%
83%
80%
71%
60%
59%
54%
49%
49%
47%
44%
38%
32%
31%
31%
23%
22%
19%
11%
US Trust in Banking Industry has
doubled over past two years, from
25% (2011) to 50% (2013) among
Informed Publics 25-64.
How much you trust businesses in each of the following industries to do what is right?
Figure
7: Severe Drops in Trust in Banks Over Five Years, 2/3 of
Markets Now Below 50 Percent Trust Level
How much do you trust the banking industry to do what is right?
23%
25%
11%
20%
13%
6%
ASKED OF RESPONDENTS WHO ARE FAMILIAR WITH
BANKING/FINANCIAL SERVICES SCANDALS OVER PAST YEAR
–
56%
GLOBALLY
59% of causes of
scandals are internal
and within business’
control
CORPORATE CULTURE
DRIVEN BY COMPENSATION/BONUSES
CORPORATE
CORRUPTION
CONFLICTS OF INTEREST
CHANGES IN THE ECONOMY
BANKS ARE TOO LARGE
LACK OF
REGULATION
Figure 8 : Trust Defi cit in Banks Linked
to Culture
What do you think is the biggest cause of bank-
ing/fi nancial services scandals?
Responses 6-9 only on 1-9 scale; 9 highest; Informed Publics ages 35-64
Informed Publics, Ages 25-64
82013
|
Trust Barometer
Who Is Trusted, When Are They Trusted, Where Are They Trusted?
CEOs have a role to play, but it’s not always at center stage
CEOs may lead the organization, but an organization’s CEO is
not always the right person to be its leading public voice. In fact,
the types of individuals that topped the 2013 list of most credible
spokespeople remains the same – experts (academic or techni-
cal) and peers (a person like yourself). CEOs had a 5 percentage
point increase in trust from 2012 to 2013 among informed pub-
lics, though overall, trust, at 43 percent, remains uninspiring by
comparison.
When comparing the ranking of credibility between these fi ve
spokespeople in 2009 and 2013, the ranking is consistent, though,
both “a person like yourself” and “a regular employee” have trended
up the most since 2009, even more so than an academic or expert
on company issues (from 59 percent to 68 percent). For a person
like yourself, trust has risen from 47 percent to 60 percent; for a
regular employee trust has risen from 30 percent to 49 percent.
These fi ndings underscore the need for business to deploy an echo
chamber of third parties to reinforce a company’s vision to build
trust among all stakeholders.
Among the general population the 2013 Barometer reveals that
it’s not only important to take into account which people are com-
municating on behalf of an organization, but where – in what type
of media – they’re communicating.
Traditional media. When it comes to communicating in the tradi-
tional media, academics and media spokespeople are most trusted
in print (newspapers and magazines) – 24 percent and 25 percent,
while media spokespeople (who are usually media trained) are most
trusted on television (32 percent).
Company’s
CEO
Company’s
Employee
Passionate
or Acvist
Consumer
Academic
A company’s employee programs, benefits &
working condions
21%
63%
16% 13% 11%
How a company serves its customers and
priorizes customer needs ahead of company
profits
19% 30%
44%
16% 15%
A company’s situaon in a me of crisis
30%
35%
18% 22% 23%
A company’s innovaon efforts and new
product development
31% 31%
27% 25% 13%
How a company uses its resources and
influence to support the environment
21% 26%
34%
27% 13%
How a company supports programs that
posively impact the local community
22% 27%
35%
20% 23%
Partnerships with NGO’s and effort to address
societal issues
25%
20%
25%
23% 15%
A company’s financial earnings & operaonal
performance
34%
27% 23% 23% 12%
A company’s business pracces, both posive
& negave
23%
36%
29% 21% 15%
Accomplishments about a company’s senior
leadership
35% 34%
17% 19% 19%
INFLUENCER MESSAGE MAPPING
ENGAGEMENT
INTEGRITY
PRODUCTS
OPERATIONS
PURPOSE
Who is Trusted MOST to provide you with credible and honest informaon about:
Media
Spokesperson
Figure 9: Infl uencer Message Mapping
Who is trusted MOST to provide you with credible and honest information?
Hybrid media and social media. In new
media – social networking sites, blogs and
microblogging sites like Twitter – CEOs are
least credible. Instead, activist consumers are
most trusted communicating on these plat-
forms – by double.
Owned media. The Barometer proves that
CEOs are rarely the most trusted spokes-
person except via perhaps the most offi cial
platform – that is, the company website (27
percent).
When it comes to what topics and issues
spokespeople are most able to credibly ad-
dress, CEOs are most trustworthy in address-
ing operational issues only, such as, business
practices, fi nancial performance and the ac-
complishments of senior leadership (fi gure 9).
Peers such as the employee or activist con-
sumer, on the other hand, can speak most
credibly to more societal issues, such as em-
ployee programs and benefi ts, crisis situations,
customer satisfaction, the environment and
community involvement.
Understanding who can strengthen (or weak-
en) trust, and where they’re best used, can
go a long way to building trust since the right
people are used in the best possible way, no
longer addressing issues about which they
are not trusted.
General Population
9
Business Must Embrace Engagement and Integrity
Importance of operations decreased dramatically over the past fi ve years
The economic collapse in 2008 and numer-
ous high-profi le corporate scandals, driven
by the greed and improprieties of leadership,
have dramatically altered the trust dynamic
between stakeholder and institution. The in-
ternal and external actions of a company and
executive behavior are now linked with im-
mediate impact on the trust and credibility of
a business. But stakeholders now view the
relevancy of each differently than they did in
2008.
Data shows that in 2008, among the general
population, corporate reputation was driven
primarily by operational excellence (76 per-
cent). But over the past fi ve years the criteria
people use to consider leadership has gone
through an extraordinary transformation. To-
day, operational excellence, at 39 percent,
has fallen to near the bottom of the 16 trust
building attribute ranking revealed by the
Barometer. They are merely “table stakes” –
fundamental competencies everyone expects
companies to exhibit, but not much more.
Attributes that have risen in importance to
build trust are more engaging, external-fac-
ing behaviors and policies that ultimately con-
tribute to personal satisfaction (“treats em-
ployees well”), customer satisfaction (“listens
to customer needs and feedback”) and the
greater good (“has ethical business practices,”
“places customers ahead of profi ts” and “has
transparent and open business practices”)
(fi gure 11).
These 16 trust-building attributes are grouped
into fi ve trust performance clusters – in order
of importance (fi gure 10):
͚ engagement
͚ integrity
͚ products and services
͚ purpose
͚ operations
Companies, however ably or sincerely, that still
operate by 2008 standards are missing oppor-
tunities to maintain and build trust among stake-
holders. It is those enterprises that adapt to a
world in which engagement, integrity and pur-
pose are more important to trust than fi nancial
returns that will earn the License to Lead.
Figure 10: 16 Attributes to Building Trust
COMMUNICATES FREQUENTLY AND HONESTLY ON THE STATE OF
ITS BUSINESS
LISTENS TO CUSTOMER NEEDS AND FEEDBACK
TREATS EMPLOYEES WELL
PLACES CUSTOMERS AHEAD OF PROFITS
INTEGRITY
TAKES RESPONSIBLE ACTIONS TO ADDRESS AN ISSUE OR CRISIS
HAS TRANSPARENT AND OPEN BUSINESS PRACTICES
HAS ETHICAL BUSINESS PRACTICES
PURPOSE
OPERATIONS
DELIVERS CONSISTENT FINANCIAL RETURNS TO INVESTORS
HAS HIGHLY-REGARDED AND WIDELY ADMIRED TOP LEADERSHIP
RANKS ON A GLOBAL LIST OF TOP COMPANIES
PRODUCTS & SERVICES
IS AN INNOVATOR OF NEW PRODUCTS, SERVICES OR IDEAS
OFFERS HIGH QUALITY PRODUCTS OR SERVICES
WORKS TO PROTECT AND IMPROVE THE ENVIRONMENT
ADDRESSES SOCIETY’S NEEDS IN ITS EVERYDAY BUSINESS
CREATES PROGRAMS THAT POSITIVELY IMPACT THE LOCAL COMMUNITY
PARTNERS WITH NGOs, GOVERNMENT AND 3
RD
PARTIES TO ADDRESS
SOCIETAL NEEDS
ENGAGEMENT
Edelman Trust Barometer
research reveals 16
SPECIFIC ATTRIBUTES
which build trust.
These can be grouped into
FIVE PERFORMANCE
CLUSTERS listed here in
rank order of importance.
Figure 11: Trust Building Attributes – Large Gap in Expectation
vs. Performance
How important are each of the following actions to building trust?
DELIVERS CONSISTENT FINANCIAL RETURNS TO INVESTORS
IS AN INNOVATOR OF NEW PRODUCTS, SERVICES OR IDEAS
RANKS ON A GLOBAL LIST OF TOP COMPANIES, SUCH AS BEST
COMPANIES TO WORK FOR OR MOST ADMIRED COMPANIES
PARTNERS WITH NGOS, GOVERNMENT AND
THIRD PARTIES TO ADDRESS SOCIETAL ISSUES
ADDRESSES SOCIETY'S NEEDS IN ITS EVERYDAY BUSINESS
WORKS TO PROTECT AND IMPROVE THE ENVIRONMENT
COMMUNICATES FREQUENTLY AND
HONESTLY ON THE STATE OF ITS BUSINESS
HAS TRANSPARENT AND OPEN BUSINESS PRACTICES
HAS ETHICAL BUSINESS PRACTICES
TAKES RESPONSIBLE ACTIONS TO
ADDRESS AN ISSUE OR A CRISIS
PLACES CUSTOMERS AHEAD OF PROFITS
TREATS EMPLOYEES WELL
LISTENS TO CUSTOMER NEEDS AND FEEDBACK
OFFERS HIGH QUALITY PRODUCTS OR SERVICES
-32
-37
-36
-33
-30
-33
-31
-27
-23
-24
-11
-15
-16
-10
-18
Gap
Importance
Performance
58%
28%
57%
24%
54%
23%
53%
26%
41%
26%
38%
22%
38%
28%
37%
19%
47%
44%
49%
-22
HAS HIGHLY-REGARDED AND WIDELY
ADMIRED TOP LEADERSHIP
CREATES PROGRAMS THAT POSITIVELY IMPACT THE
LOCAL COMMUNITY IN WHICH THE COMPANY OPERATES
23%
33%
26%
25%
19%
58%
23%
59%
24%
61%
30%
62%
41%
63%
ENGAGEMENT INTEGRITY PRODUCTS/SERVICES PURPOSE
OPERATIONS
Responses 8-9 only on 1-9 scale, 9 highest; General Population
102013
|
Trust Barometer
trust in today’s skeptical, cluttered, multiplatform world – are won
or lost.
Certainly to maintain the License to Operate CEOs still need to have
the vision. But now, driven by 360-degree transparency and this
new inclusive management model, a vision won’t result in License
to Lead without robust engagement, vertically and horizontally within
the diamond, over how that vision is brought to life. CEOs must:
͚
share their vision through ongoing dialogue with those in both
halves of the diamond and begin to close the gap between the
expectations people have in a company in the 21st century and
actual performance, which often lags;
͚
enlist everyone in their vision by asking the right questions, observ-
ing reactions and behaviors, and listening to what people want,
need, like, dislike, etc.;
͚ adapt what they’ve seen and heard from social activists, action
consumers, employees and others in real and measurable ways;
and
͚
act responsively (and responsibly) by turning feedback into genuine ac-
tion as they innovate, build and market products and services that meet
consumer expectations yet still refl ect and reinforce the CEOs vision.
Underpinned by what we call public engagement – when policy and
communications are unifi ed to realize the full aspiration of public
relations – this new inclusive management model, refl ected in the
diamond-shaped infl uence dynamic, allows business to build trust
and become a positive force in society by giving them both the
permission and the means to participate meaningfully in an ongo-
ing global conversation.
It wasn’t long ago that communications was
top down, with organizational leaders on high,
imparting what people needed to know verti-
cally. It was a traditional pyramid of infl uence
– with elites at the pinnacle and the general
population on bottom. Choice of media was
limited, national boundaries were a given and
authority fi gures were revered (Joseph Alsop,
Walter Annenberg, Jack Welch, etc.). The ad-
vertising industry took care of speaking directly
to “the people.”
Today, the traditional pyramid of infl uence has
been rechristened the pyramid of authority. It
hasn’t disappeared, but it has been joined
by an inverted pyramid of community – en-
gaged employees, action consumers and so-
cial activists involved in real-time and continual
peer-to-peer dialogue – resulting in a new dia-
mond-shaped infl uence dynamic and inclusive
management model with the general popu-
lation in the middle, at the diamond’s widest
point – the mission-critical center (fi gure 12).
Unlike the vertical fl ow of information previous-
ly the norm, where information fl owed down
from the CEO to the general population, within
the pyramid of community, information fl ows
horizontally between its members and simul-
taneously bubbles up, eventually to the CEO.
Those in the upper half of the diamond can
lead the dialogue on what an organization
does, but that will only get them so far. Today,
it’s how a company does what it does that
matters. And it’s those in the lower half of the
pyramid who are concerned with the “how” the
most. It is with them that leaders must engage
to ensure the how is understood, noticed, sup-
ported and even celebrated.
This means that leaders not only need to pay
attention to those within the bottom half of the
diamond, but they need to actively engage
with them across the media cloverleaf (main-
stream, hybrid, social and owned media) to
reach them when and where they are (though
as noted in page 8, CEOs may not be the ones
actually doing the engaging). It’s here where
engagement, integrity and purpose – those
clusters of behaviors necessary to building
INCLUSIVE MANAGEMENT ACROSS THE MEDIA CLOVERLEAF
PYRAMID OF
COMMUNITY
(Horizontal)
PYRAMID OF
AUTHORITY
(Vercal)
Hybrid
SocialOwned
Tradional
ACTION CONSUMERS
EMPLOYEES
GENER AL POPULAT ION
SOCIAL
ACTIVIS
TS
ACTIVIS
TS
BOARD OF
DIRECTORS
ACADEMICS
TECHNICAL
EXPERTS
ELITE MEDIA
Search
&
Content
A New Infl uence Dynamic Underpinned by Public Engagement
Welcome – and get used to – a world in which what companies do is not as important as
how they do it
A PATH FOWARD
Figure 12: Embrace the new mandate: inclusive management
Activate across media cloverleaf, base in grounded leadership
Berland
Intelligent Engagement
On the cover, from top left: HSBC: REUTERS/
Bobby Yip; UBS Protest Sign: REUTERS/Luke
MacGregor;Bob Diamond: REUTERS/ Luke Mac
-
Gregor; Bo Xilai: REUTERS/ Cheryl Ravelo ; Lance
Armstrong: by Sebastian David Tingkær; Angela
Merkel: REUTERS/ Sebastien Pirlet; Rajat Gupta:
REUTERS/ Brendan McDermid; George Entwistle:
Associated Press/ Rex Featu
About the Edelman Trust
Barometer
The 2013 Edelman Trust Barometer is the firm’s
13th annual trust and credibility survey. The
survey was produced by research firm Edelman Ber-
land and consisted of 20-minute online interviews
conducted on October 16th – November 29th,
2012. The 2013 Edelman Trust Barometer online
survey sampled 26,000 general population re-
spondents with an oversample of 5,800 informed
publics ages 25-64 across 26 countries. All informed
publics met the following criteria: college-educated;
household income in the top quartile for their age in
their country; read or watch business/news media
at least several times a week; follow public policy
issues in the news at least several times a week.
For more information, visit lman.
com/or call 212.729.2166.
About Edelman
Edelman is the world’s largest public relations firm,
with 66 offices and more than 4,500 employees
worldwide, as well as affiliates in more than 30 cities.
Edelman was named Advertising Age’s top-ranked
PR firm of the decade in 2009 and one of its “A-List
Agencies” in both 2010 and 2011; Adweek’s “2011
PR Agency of the Year;” PRWeek’s “2011 Large
PR Agency of the Year;” and The Holmes Report’s
“2011 Global Agency of the Year” and its 2012 “Digital
Agency of the Year.” Edelman was named one of the
“Best Places to Work” by Advertising Age in 2010 and
2012 and among Glassdoor’s top ten “Best Places
to Work” in 2011 and 2012. Edelman owns specialty
firms Edelman Berland (research), Blue (advertising),
A&R Edelman (technology), BioScience Communi-
cations (medical communications), and agencies
Edelman Significa (Brazil), and Pegasus (China). Visit
for more information.
About Edelman Berland
The Trust Barometer is powered by Edelman Berland. Edelman Berland is a global, full-service market
research firm that provides corporate, non-profit and government clients with strategic intelligence to make
their communications and engagements with stakeholders the smartest they can be. The firm specializes
in qualitative and quantitative research, measurement, tracking and analysis in reputation, branding and
communications. Edelman Berland has more than 100 employees in offices serving clients in more than 50
countries and is part of Edelman, the world’s largest public relations company. Edelman Berland: strategic
intelligence for the smartest engagement possible.