lecture 3 aas&ir
Bạn đang xem bản rút gọn của tài liệu. Xem và tải ngay bản đầy đủ của tài liệu tại đây (426.28 KB, 8 trang )
1
Atomic Absorption
Spectroscopy
PHAM VAN HUNG, PhD
Atomic Absorption Spectroscopy
• AAS is commonly used for metal analysis
• A solution of a metal compound is sprayed into a
flame and vaporises
• The metal atoms absorb light of a specific
frequency, and the amount of light absorbed is a
direct measure of the number of atoms of the
metal in the solution
Metal Zn Fe Cu Ca Na
λ (nm) 214 248 325 423 589
Atomic Absorption Spectroscopy:
An Aussie Invention
• Developed by Alan Walsh (below) of the
CSIRO in early 1950s.
Principles of AAS
• The metal vapor absorbs energy from an
external light source, and electrons jump from
the ground to the excited states
• The ratio of the transmitted to incident light
energy is directly proportional to the
concentration of metal atoms present
• A calibration curve can thus be constructed
[Concentration (ppm) vs. Absorbance]
Absorption and Emission
Ground State
Excited States
Absorption Emission
Atomic Absorption
• When atoms absorb light, the incoming
energy excites an electron to a higher
energy level.
• Electronic transitions are usually
observed in the visible or ultraviolet
regions of the electromagnetic spectrum.
2
Atomic Absorption Spectrum
• An “absorption spectrum” is the
absorption of light as a function of
wavelength.
• The spectrum of an atom depends on its
energy level structure.
• Absorption spectra are useful for
identifying species.
Atomic Absorption/Emission/
Fluorescence Spectroscopy
Atomic Absorption Spectroscopy
• The analyte concentration is determined from
the amount of absorption.
Overview of AA
spectrometer.
Light Source
Light Source
Detector
Detector
Sample
Sample
Compartment
Compartment
• Emission lamp produces light frequencies unique to
the element under investigation
• When focussed through the flame these frequencies
are readily absorbed by the test element
• The ‘excited’ atoms are unstable- energy is emitted
in all directions – hence the intensity of the focussed
beam that hits the detector plate is diminished
• The degree of absorbance indicates the amount of
element present
Atomic Absorption Spectroscopy Atomic Absorption Spectroscopy
• It is possible to measure the concentration of
an absorbing species in a sample by applying
the Beer-Lambert Law:
Abs=−log
I
I
o
⎛
⎝
⎜
⎞
⎠
⎟
Abs =
ε
cb
ε
ε
= extinction coefficient
3
Atomic Absorption Spectroscopy
• Instrumentation
• Light Sources
• Atomisation
• Detection Methods
Light Sources
• Hollow-Cathode Lamps (most common).
• Lasers (more specialised).
• Hollow-cathode lamps can be used to detect
one or several atomic species
simultaneously. Lasers, while more sensitive,
have the disadvantage that they can detect
only one element at a time.
Hollow-Cathode Lamps
• The electric discharge ionises rare gas
(Ne or Ar usually) atoms, which in turn, are
accelerated into the cathode and sputter
metal atoms into the gas phase.
Hollow-Cathode Lamps
Hollow-Cathode Lamps
• The gas-phase metal atoms collide with
other atoms (or electrons) and are excited to
higher energy levels. The excited atoms
decay by emitting light.
• The emitted wavelengths are characteristic
for each atom.
Atomisation
• Atomic Absorption Spectroscopy (AAS) requires
that the analyte atoms be in the gas phase.
• Vapourisation is usually performed by:
–Flames
– Furnaces
–Plasmas
4
Flame Atomisation
• Flame AAS can only analyse solutions.
• A slot-type burner is used to increase
the absorption path length (recall Beer-
Lambert Law).
• Solutions are aspirated with the gas
flow into a nebulising/mixing chamber
to form small droplets prior to entering
the flame.
Flame Atomisation
Flame Atomisation
• Degree of atomisation is temperature
dependent.
• Vary flame temperature by fuel/oxidant
mixture.
Fuel Oxidant Temperature (K)
Acetylene Air 2,400 - 2,700
Acetylene Nitrous Oxide 2,900 - 3,100
Acetylene Oxygen 3,300 - 3,400
Hydrogen Air 2,300 - 2,400
Hydrogen Oxygen 2,800 - 3,000
Cyanogen Oxygen 4,800
Furnaces
• Improved sensitivity over flame sources.
• (Hence) less sample is required.
• Generally, the same temp range as flames.
• More difficult to use, but with operator skill
at the atomisation step, more precise
measurements can be obtained.
Furnaces Inductively Coupled Plasmas
• Enables much higher temperatures to be
achieved. Uses Argon gas to generate the
plasma.
• Temps ~ 6,000-10,000 K.
• Used for emission expts rather than absorption
expts due to the higher sensitivity and elevated
temperatures.
• Atoms are generated in excited states and
spontaneously emit light.
5
AAS - Calibration Curve
• The instrument is calibrated before use by testing the
absorbance with solutions of known concentration.
• Consider that you wanted to test the sodium content of
bottled water (A = 0.650?).
• The following data was collected using solutions of
sodium chloride of known concentration
0.760.520.380.18
Absorbance
8642
Concentration (ppm)
Calibration Curve for Sodium
Concentration (ppm)
A
b
s
o
r
b
a
n
c
e
2468
0.2
0.4
0.6
0.8
1.0
Use of Calibration curve to determine sodium
concentration {sample absorbance = 0.65}
Concentration (ppm)
A
b
s
o
r
b
a
n
c
e
2468
0.2
0.4
0.6
0.8
1.0
∴Concentration
Na
+
= 7.3ppm
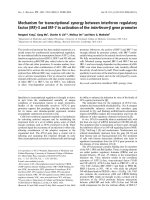
Sample Problem
• The nickel content in river water
was determined by AA analysis
after 5.00 L was trapped by ion
exchange. Rinsing the column
with 25.0 mL of a salt solution
released all of the nickel and
the wash volume was adjusted
to 75.00 mL; 10.00 mL aliquots
of this solution were analyzed
by AA after adding a volume of
0.0700 μg Ni/mL to each. A
plot of the results are shown
below. Determine the
concentration of the Ni in the
river water.
Determination of Nickel
Content by AA
y = 5.6x + 20
0
40
80
120
0 5 10 15
Volume of Nickel Added(mL)
Absorbance Units
Answer: 0.375 μg/mL
Infrared Spectroscopy
What is Infrared?
• Infrared radiation lies between the visible and microwave portions
of the electromagnetic spectrum.
• Infrared waves have wavelengths longer than visible and shorter
than microwaves, and have frequencies which are lower than
visible and higher than microwaves.
• The Infrared region is divided into: near, mid and far-infrared.
– Near-infrared refers to the part of the infrared spectrum that is
closest to visible light and far-infrared refers to the part that is
closer to the microwave region.
– Mid-infrared is the region between these two.
• The primary source of infrared radiation is thermal radiation (heat).
• It is the radiation produced by the motion of atoms and molecules
in an object. The higher the temperature, the more the atoms and
molecules move and the more infrared radiation they produce.
• Any object radiates in the infrared. Even an ice cube, emits
infrared.
6
What is Infrared? (Cont.)
Humans, at normal body temperature,
radiate most strongly in the infrared, at a
wavelength of about 10 microns (A
micron is the term commonly used in
astronomy for a micrometer or one
millionth of a meter). In the image to the
left, the red areas are the warmest,
followed by yellow, green and blue
(coolest).
The image to the right shows a cat in the
infrared. The yellow-white areas are the
warmest and the purple areas are the coldest.
This image gives us a different view of a
familiar animal as well as information that we
could not get from a visible light picture. Notice
the cold nose and the heat from the cat's eyes,
mouth and ears.
Infrared Spectroscopy
• Infrared spectroscopy is the measurement of the
wavelength and intensity of the absorption of mid-
infrared light by a sample. Mid-infrared is energetic
enough to excite molecular vibrations to higher energy
levels.
• The wavelength of infrared absorption bands is
characteristic of specific types of chemical bonds, and
infrared spectroscopy finds its greatest utility for
identification of organic and organometallic molecules.
The high selectivity of the method makes the estimation
of an analyte in a complex matrix possible.
Infrared Spectroscopy
The bonds between atoms in the molecule stretch and
bend, absorbing infrared energy and creating the
infrared spectrum.
Symmetric Stretch Antisymmetric Stretch Bend
A molecule such as H
2
O will absorb infrared light when the vibration
(stretch or bend) results in a molecular dipole moment change
Infrared Spectroscopy
A molecule can be characterized (identified) by its
molecular vibrations, based on the absorption and intensity
of specific infrared wavelengths.
Infrared Spectroscopy
For isopropyl alcohol, CH(CH
3
)
2
OH, the infrared absorption
bands identify the various functional groups of the molecule.
Capabilities of Infrared Analysis
Identification and quantitation of organic solid,
liquid or gas samples.
Analysis of powders, solids, gels, emulsions,
pastes, pure liquids and solutions, polymers,
pure and mixed gases.
Infrared used for research, methods
development, quality control and quality
assurance applications.
Samples range in size from single fibers only
20 microns in length to atmospheric pollution
studies involving large areas.
7
Applications of Infrared Analysis
Pharmaceutical research
Forensic investigations
Polymer analysis
Lubricant formulation and fuel additives
Foods research
Quality assurance and control
Environmental and water quality
analysis methods
Biochemical and biomedical research
Coatings and surfactants
Etc.
• Dispersive instruments: with a monochromator to be used
in the mid-IR region for spectral scanning and quantitative
analysis.
• Fourier transform IR (FTIR) systems
: widely applied and
quite popular in the far-IR and mid-IR spectrometry.
• Nondispersive instruments: use filters for wavelength
selection or an infrared-absorbing gas in the detection system
for the analysis of gas at specific wavelength.
Instrumentation
BRUKE TENSOR
TM
Series
Perkin Elmer
TM
Spectrum One
Instrumentation
Dispersive IR spectrophotometers
Simplified diagram of a double beam infrared spectrometer
Modern dispersive IR spectrophotometers are invariably double-beam
instruments, but many allow single-beam operation via a front-panel
switch.
Double-beam operation compensates for atmospheric absorption, for the
wavelength dependence of the source spectra radiance, the optical
efficiency of the mirrors and grating, and the detector instability, which
are serious in the IR region.⇒single-beam instruments not practical.
Double-beam operation allows a stable 100% T baseline in the spectra.
Dispersive spectrophotometers Designs
Null type instrument
8
Sample preparation techniques
The preparation of samples for infrared spectrometry is often the most
challenging task in obtaining an IR spectrum. Since almost all substances absorb
IR radiation at some wave length, and solvents must be carefully chosen for the
wavelength region and the sample of interest.
Infrared spectra may be obtained for gases, liquids or
solids (neat or in solution)
The end!