Immersive experience and customer responses towards mobile augmented reality applications
Bạn đang xem bản rút gọn của tài liệu. Xem và tải ngay bản đầy đủ của tài liệu tại đây (1.06 MB, 18 trang )
Cogent Business & Management
ISSN: (Print) (Online) Journal homepage: />
Immersive experience and customer responses
towards mobile augmented reality applications:
The moderating role of technology anxiety
Kim Nhan Vo, Angelina Nhat Hanh Le, Le Thanh Tam & Huong Ho Xuan |
To cite this article: Kim Nhan Vo, Angelina Nhat Hanh Le, Le Thanh Tam & Huong Ho Xuan
| (2022) Immersive experience and customer responses towards mobile augmented reality
applications: The moderating role of technology anxiety, Cogent Business & Management, 9:1,
2063778, DOI: 10.1080/23311975.2022.2063778
To link to this article: />
© 2022 The Author(s). This open access
article is distributed under a Creative
Commons Attribution (CC-BY) 4.0 license.
Published online: 28 Apr 2022.
Submit your article to this journal
View related articles
View Crossmark data
Full Terms & Conditions of access and use can be found at
/>
Vo et al., Cogent Business & Management (2022), 9: 2063778
/>
MARKETING | RESEARCH ARTICLE
Immersive experience and customer responses
towards mobile augmented reality applications:
The moderating role of technology anxiety
Received: 13 December 2021
Accepted: 04 April 2022
*Corresponding author: Vo Kim Nhan,
PhD. Candidate at University of
Economics Ho Chi Minh City and
Lecturer at Tien Giang University,
Vietnam
E-mail:
Reviewing editor:
Maria Palazzo, Universita degli Studi
di Salerno, ITALY
Additional information is available at
the end of the article
Kim Nhan Vo1*, Angelina Nhat Hanh Le2, Le Thanh Tam3 and Huong Ho Xuan4
Abstract: The purpose of this study is to investigate the impact of customer
immersive experience on attitude and adoption intention toward mobile augmen
ted reality applications (MAR apps). This paper also examines the moderating role of
technology anxiety on the relationship between immersive experience on attitude
and adoption intention toward MAR apps. A dataset of 322 customers and the
partial least square structural equation model (PLS-SEM) with the SmartPLS 3.2.8
statistical software were used to test the proposed hypotheses. The results show
that immersive experience significantly affects attitude and adoption intention
toward MAR apps. In addition, the vital role of technology anxiety in moderating the
relationship between customer immersive experience and their responses toward
MAR apps is revealed.
Subjects: Marketing; Customer Behavior
ABOUT THE AUTHORS
PUBLIC INTEREST STATEMENT
Vo Kim Nhan is a PhD candidate at the University
of Economics Ho Chi Minh City, Vietnam (UEH).
She is also a Lecturer at Tien Giang University,
Vietnam. Her research interests include business
management, marketing, customer behavior.
Assoc. Prof. Dr. Angelina Nhat Hanh Le is
a lecturer at the University of Economics Ho Chi
Minh City, Vietnam (UEH). Her research focuses
on marketing channels, brand management,
Internet marketing, meta-analysis, and green
marketing.
Assoc. Prof. Dr. Le Thanh Tam is the Head of the
Commercial Banking Department, School of
Banking and Finance, National Economics
University of Vietnam. Her current research
interests include economic development, finan
cial inclusion, fintech, rural finance, microfi
nance, banking and risk management, small and
medium enterprises.
Huong Ho Xuan is a PhD candidate at the
University of Economics Ho Chi Minh City,
Vietnam (UEH). He is also a lecturer in Quy Nhon
University, Vietnam. His current research inter
ests include social media marketing, service
marketing, brand management, and smart
retailing.
This study provides a more understanding of
using mobile augmented reality applications (MAR
apps) as an emerging marketing tool. This paper
also investigates empirically the impacts of
immersive experience on attitude and adoption
intention toward MAR apps. In addition, the cur
rent research examines the moderating role of
technology anxiety on the relationship between
customer immersive experience and their
responses toward MAR apps. Drawing on the
findings mentioned above that clarify how MAR
apps can be an interactive technology for markets
related to immersive experience, attitude, adop
tion intention, and technology anxiety, this study
provides the managerial implications for retailers
and customers.
© 2022 The Author(s). This open access article is distributed under a Creative Commons
Attribution (CC-BY) 4.0 license.
Page 1 of 17
Vo et al., Cogent Business & Management (2022), 9: 2063778
/>
Keywords: customer immersive experience; attitude; adoption intention; mobile
augmented reality applications; technology anxiety
1. Introduction
In recent years, consumers have pervasively changed from shopping at traditional stores to
internet shopping due to the global COVID-19 pandemic (Alimamy & Gnoth, 2022; Al-Hattami &
Gomez Corona, 2021. The pandemic makes a huge transformation in the global business land
scape (Irawan et al., 2020) in which technology devices as mobile applications have been largely
used in shopping online (Fernandes et al., 2020). Mobile augmented reality applications (MAR apps)
is an emerging technology affecting multiple sectors (research, industry, education, tourism,
advertising and retailing, entertainment, etc.) because of their potential benefits (Daniel &
Berinyuy, 2010; Hilken et al., 2018; Javornik et al., 2022). Hsu et al. (2021) indicated that ARbased sales have increased from more than $12.0 billion in 2020 to $72.8 billion in 2024. Emerging
technologies as MAR apps have changed the world and how people contact each other. This
technology has been more popular because of its interactive features (Lu & Smith, 2007) and
has various options for customers (Kim & Forsythe, 2008a). Customers can try on and experience
virtual augmented reality products, then they evaluate which are the best products suitable for
their demands before making decisions. In recent years, many companies have applied augmen
ted reality (AR) in creating more informative and fully interactive products to suit their customer
demands (Zubizarreta et al. 2008a). Many organizations have applied AR technologies in their
mobile phone applications, i.e. YouCam, IKEA catalog (Alimamy & Gnoth, 2022; Javornik et al.). This
“magic mirror” transforms customers’ shopping experience by allowing them to understand
products that they are going to purchase from different aspects and options. According to
Moorhouse et al. (2018), an emerging technology such as MAR apps is the latest technological
innovation that may revolutionize consumer behaviors. From above arguments, it is likely that MAR
apps is a potential and effective marketing tool in all markets, especially in developing markets as
Vietnam.
In a marketing context, previous studies have demonstrated that AR technologies can be
applied in order to enhance customer immersion (Georgiou & Kyza, 2017; Hilken et al., 2018;
Hudson et al., 2019; Yim et al.). Mekni and Lemieux (2014) stated that MAR apps can provide
attractive and informative virtual products in order to make customers satisfied. This technology
can also give customers additional information about the products (Baier et al., 2015) before
making purchasing decisions (Javornik, 2016; Pantano et al.). Virtual glasses can be used to create
added value for customers and impact their perception (Oyman et al., 2022; Verhagen et al., 2014).
In addition, virtual make-up mirrors compliment users and make them enjoyable. In a retailing
context, there is an enormous change in customer cognition and behavior thanks to AR technol
ogies (Mauroner et al. 2022). The application of AR technologies can be more beneficial for
customers via mobile apps or virtual try-on websites (Dacko, 2017) because when being immersed
in virtual products via MAR apps, customers can be intensively enhanced in their positive emotions,
as well as cognitive and affective responses (Rese et al., 2017).
The emerging technologies like AR have been promoted in a number of developed markets
(Jessen et al., 2015; Oyman et al., 2022; Qin et al., 2021). Applying virtual technologies like AR to
facilitate consumer immersive experience should help companies achieve their goals successfully
(Heller et al., ; Hilken et al., 2018). However, whether and how customers’ immersive experiences
impact on attitude and adoption intention toward MAR apps in the context of developing markets
such as Vietnam has largely been ignored. Thus, first of all, the research gap that this study would
like to address is to investigate the crucial role of immersive experience in facilitating both attitude
and adoption intention toward MAR apps among Vietnamese consumers. The nature of immersive
experience that is enabled by MAR apps is thoroughly discussed, and the mediating role of attitude
toward MAR apps on the relationship between immersive experience and the adoption intention of
MAR apps is also further scrutinized in this study. In addition, consumers might possess different
Page 2 of 17
Vo et al., Cogent Business & Management (2022), 9: 2063778
/>
personal tendencies regarding general technologies that affect their perceptions, evaluations, and
preferences pertaining to MAR technologies. Technology anxiety refers to a personal state of
nervous concern an individual experiences while using technology devices (Meuter et al., 2003;
Oyman et al., 2022). Yang and Forney (2017) has demonstrated the moderating effect of technol
ogy anxiety on the relationship between customer expectations and the intention to use mobile
shopping. A high level of the fear of using MAR apps would cause consumers to avoid adopting
emerging technologies such as MAR apps and vice versa (Li & Xu, 2020). Therefore, consumers’
technology anxiety is integrated as a moderating variable in our research model.
In short, this study contributes to the existing literature by (1) investigating the impacts of
consumer immersive experience when using try-on MAR apps on both their attitude and adoption
intention, (2) scrutinizing the mediating role of attitude toward MAR apps on the relationship
between immersive experience and adoption intention, and (3) examining the moderating role
of technology anxiety on the relationship between immersive experience and its two outcomes.
The empirical findings will provide valuable guidance for business and retailing practitioners to
properly apply and effectively utilize immersive-experience-enabled technologies such as MAR
apps that can facilitate customer’s attitude toward MAR apps and eventually boost their adoption
intention.
2. Literature review and hypotheses development
2.1. Customer’s immersive experience with MAR apps
Researchers have defined immersion in different ways based on contextual environments, such as
education (Radianti et al., 2020), tourism (Hudson et al., 2019; Tsai, 2020), retailing (Peukert et al.,
2019; Song et al., 2019) because of its amazing potentials (Daniel & Berinyuy, ; Hilken et al., 2018).
From the technological perspective, immersion is often used to describe the level of media’ quality
(Flavián et al., 2019). According to the study of Suh and Prophet (2018), immersive technology is
technology (e.g., augmented reality, virtual reality) that offers the user immersive experiences
while using the technology. From a psychological perspective, Brown and Cairns (2004) stated that
immersion is a multi-dimensional psychological state explained by the flow theory of
Csikszentmihalyi (1988), such as engagement, engrossment, and total immersion. Later on, Carù
and Cova (2006) also explained that immersion refers to the user experience, such as engagement,
engrossment, and total immersion. Having the relationships between technical and human psy
chological states, Hilken et al. (2018) argued that immersion was influenced by user personality
traits through user experience using new technology as AR. Weibel et al. (2010) also stated that
immersion can be understood as a natural psychological state, engaging in an engrossing and
certain activity. Moreover, Witmer and Singer (1998) explained that immersion refers to
a psychological state of having attachment with an environment that provides stimuli and experi
ences. On the other hand, immersion is considered as a state of consciousness where the physical
self is lost by being surrounded by the environment and can be categorized into tactical, strategic,
narrative, spatial, cognitive, sensory, psychological, and emotional immersion (Parvinen et al.,
2015). Yim et al. (2017) defined customer immersion as the levels of user feeling which were
absorbed in, involved with, and engrossed in virtual environment.
In social perspective, Carù and Cova (2007) argued that immersion is a process of accessing an
experience through which a consumer becomes one with the experience by being immersed in
a secure spatial environment. In experience economy perspective, Pine et al. (2021) argued that
immersion is considered as a physical or virtual apart of the experience. Agarwal and Karahanna
(2000) stated that immersion is a dimension of cognitive absorption which is able to enhance and
shape user attitude, adoption intention. In recent studies, immersion has different states including
engagement, engrossment, and total immersion based on cognitive and affective human experi
ence (Georgiou & Kyza, 2018). In the current studies, the customer immersion concept was
examined as a customer’s immersive experience in virtual environments (Hansen & Mossberg,
2013; Hudson et al.). Immersion is considered as deep involvement in the present. Song et al.
Page 3 of 17
Vo et al., Cogent Business & Management (2022), 9: 2063778
/>
(2018) also showed that immersion is a human psychological state of deep involvement with
technological devices. In related immersion concepts, Blumenthal and Jensen (2019) suggested
three levels of involvement, namely, involvement triggers, involvement worlds and a state of
immersion.
Common to all these definitions is the customer immersive experience described by the user’s
deep involvement and immersive experience in the present moment (Georgiou & Kyza, 2018, ;
Hansen & Mossberg, 2013; Yim et al.). In this study, immersion concept can be defined as customer
immersive experience absorbed in, involved with, and engrossed in virtual environment (Georgiou
& Kyza, 2018; Song et al., 2018; Yim et al.). In general, while customer immersion has been viewed
as an individuals’ experience focusing on unidimensional construct or multidimensional construct
(Hudson et al., ; Song et al., 2018; Yim et al.).
2.2. Attitude and adoption intention toward MAR apps
Attitude refers to an individual’s feeling or opinion about performing a particular behavior (Ahmad
& Abdulkarim, 2018; Azjen, 1980). Attitude toward MAR apps in the current study is considered as
customers positive or negative feelings about using MAR apps. Ryan and Deci () argued that human
behavior is driven by individual and external motivational factors, so a positive attitude leads to
a high motivation to have adoption intention. Moreover, the technical acceptance model (Davis,)
and theory of planned behavior (Azjen, 1980) also explains the relationship between attitude and
adoption intention, so customers’ attitude toward MAR apps can lead to customers’ adoption
intention using MAR apps. As mentioned above, immersive experience refers to an individual’s
internal psychological states, which were engaged in, involved with, and engrossed in virtual
environment (Yim et al.), so immersive experience can lead to attitude and adoption intention
regarding MAR apps. Thus, attitude toward MAR apps will be influenced by internal human states,
which we refer to as immersive experience in this study, then lead to the intention to use MAR
apps. Thus, we expect that attitude might play an intermediate role in the relationship between
immersive experience and intention to use MAR apps:
Hypothesis 1: Immersive experience is positively related to customers’ attitude toward MAR apps
Hypothesis 2: Attitude toward MAR apps positively affect their adoption intention toward MAR
apps.
Behavioral responses, which are outcomes of cognitive and affective responses, refer to
conviction or intention for human behavior (Suh & Prophet). Prior research indicates that affective
responses (i.e. enjoyment) directly positively influence the intention to use MAR (Yim et al.).
Kowalczuk et al. (2021) also stated that affective responses (i.e. immersion) have a direct impact
on behavioral responses (i.e. reuse intention) using MAR app. After virtual try-on MAR apps,
customers intend to use this MAR apps in their shopping in the future. In this study, the behavioral
intention is considered as the adoption intention or to continue using MAR apps. In light of the
above analysis, the following hypotheses in this study were proposed:
Hypothesis 3: Immersive experience will lead to adoption intention toward MAR apps
2.3. Moderating role of technology anxiety
As above mentioned, technology anxiety is considered as an individual trait reflecting an anxious or
emotional state when considering use or actually using technology (Meuter et al., 2003; Oyman et al.,
2022; Venkatesh et al., 2014). A person with a high level of anxiety for using MAR apps can have
a reduced adoption intention to try on virtual technologies as MAR apps. A high level of technology
anxiety has impact on consumer attitudes and can cause them to avoid adopting new technologies
Page 4 of 17
Vo et al., Cogent Business & Management (2022), 9: 2063778
/>
(Li & Xu). Customers with high level of anxiety will be less likely to adopt MAR apps than customers
with low level of anxiety. Yang and Forney (2017) also proposed a moderating effect of technology
anxiety on the relationship between expectations and the intention to use mobile shopping.
Therefore, customers with high technology anxiety are not ready to spend more time trying on
MAR apps-based products and vice versa. Based on the discussion above, technology anxiety mod
erates the relationship between immersive experience and its outcomes.
Hypothesis 4: Technology anxiety positively moderates the relationship between immersive
experience and (a) attitude toward MAR apps, (b) adoption intention regarding MAR apps.
3. Method
3.1. Sampling approach
Participants, who have not used MAR apps yet, were chosen to avoid previous effects (Daassi &
Debbabi, 2021). They were asked to download two fashion MAR apps (Nikhashemi et al., 2021),
namely “YouCam Makeup” and “FormexTryOn” (Daassi & Debbabi, 2021; Song et al., 2018) which
were selected for this survey. “YouCam Makeup” app was mainly interesting to young females
(Daassi & Debbabi, 2021), whereas the Formex watch app has no sex bias, which means that
both males and females can try it on (Qin et al., 2021; Song et al., 2018). Authors suggested two
different MAR apps to diversify participants’ choice, avoid sex bias, and increase generalizability
in the current study (Daassi & Debbabi, 2021, Rauschnabel et al., 2019). In previous studies
(Daassi & Debbabi, 2021; Park and Yoo, 2020; Wang et al., 2021), “YouCam Makeup” app was
chosen for their survey and experiment studies. This app has developed to allow users to
virtually try on thousands of shades of eye shadows, lip colors, and eye lash styles on their
own reflections. To use the app, participants were asked to download “YouCam Makeup” app on
their smartphone. Then they could visit the app, select a range of different cosmetic products
they were interested in, such as lipstick colors, eyeliner, blush, and eyeshadow to try on. If
customers did not want to “try on” the makeup themselves, they could select a model with
a similar skin tone and see what the makeup looked like on them (Daassi & Debbabi, 2021).
Likewise having been developed by a Swiss watch company, “Formex TryOn” application pro
vides customers with a try-on experience (Song et al., 2018). This app allows users to try on
a Formex watch on their wrist, and can change straps and models of Formex watch. It seems
that most people tend to be more than happy to answer questions if respondents selected are
informed about the objectives, time of survey. Then they can experience MAR apps and answer
the questionnaire.
3.2. Sample and data collection
The method of collecting data was convenient to sampling in Ho Chi Minh city, Vietnam. Customers
going shopping at supermarkets in Ho Chi Minh city were chosen because Ho Chi Minh City is the
largest/busiest city and the commercial hub of Vietnam. E-commercial platforms have also drama
tically increased. Tp. Ho Chi Minh City has the highest average income per month compared to other
regions of Vietnam (Vietnam E-business Index, 2021) and the highest e-commerce development
index (Vietnam E-business Index, 2021). Because of a data bias of online surveys, this study con
ducted the survey by face-to-face. The respondents were asked directly for AR try-on experience, then
completed the survey. Participants were encouraged to describe their own experiences when using
AR try on websites or mobile applications. Therefore, Ho Chi Minh city was chosen to conduct research
samples. Up to now, prior research relevant to augmented reality technology remain limited. Because
the latest AR technology was not popular yet, Ho Chi Minh City was chosen for conducting the main
survey with convenient sampling from 450 people aged from 15 years onward.
Page 5 of 17
Vo et al., Cogent Business & Management (2022), 9: 2063778
/>
3.3. Procedure
There are three main steps consisting of fifteen minutes introduction, letting participants try on
MAR apps for twenty minutes and completing the survey in ten minutes, with a five minute break
among steps (Georgiou & Kyza, 2017; Kowalczuk et al., 2021; Sung, 2022). In the first step, a set of
instructions about how to use MAR apps as well as some benefits of MAR apps were given. Then,
participants were required to download two suggested fashion apps, namely “YouCam Makeup”
and “Formex TryOn” on their smartphone for Android or iPhone. Next step, participants were asked
some screening questions by multiple choice to ensure set criteria suitable for the study, such as
being willing and understanding the instructions, difficulties with downloading MAR apps, then
respondents spent fifteen minutes for virtual try-on, providing an incomplete response (Jessen
et al., 2015; Rauschnabel et al., 2019). In the final step, participants were asked to complete the
questionnaire and receive a research credit for their participation (Flavián et al., 2017). In some
cases, respondents can be given extra time for their participation. In order to collect the data, ten
data collectors were recruited and trained in the above-mentioned steps to ensure data collection
suitable for the study’s purpose. These collectors were given a financial incentive to motivate their
data collection (Nikhashemi et al., 2021). Certainly, the questionnaire was designed to control data
collectors and respondents in the period of data collection. All subjects were asked to meet the
criteria to ensure compliance with suggested and controllable requirements (Shin and Jeong,
2021). For instance, “Have you ever used an app to virtually try on products, such as clothes,
makeup, or eyeglasses, etc.?” to check whether respondents have had prior experiences with
virtual try-on apps (Feng and Xie, 2019; Nikhashemi et al., 2021). The purpose of the main study
is to evaluate the measurement model and structural model by PLS-SEM tool. Evaluating the
measuring model measurement by testing the scales of reliability analysis and validity analysis.
Structural model was evaluated by Bootstrapping (N = 5000).
3.4. Measurement
Almost all constructs in this study used scales from previous high-ranked journals. These above
constructs were adopted from previous scales in the high-ranked journal written in English with
adjustments and adaptations suitable for the context. The scale of customer immersive experience
was measured through three items on the scale by Yim et al. () formed by three items. Regarding
the outcomes of the research model, customer responses were assessed by attitude toward MAR
apps and adoption intention regarding the MAR apps measured (Rese et al., 2017). Respondents
were asked to evaluate different attitudes and behaviors of others, all of which were based on
sample frames selected intentionally. Additionally, these customer response variables were mea
sured by adapting five-item scales of each. In addition to a moderating construct, the framework
posits that individual differences (e.g. technology anxiety) have moderating effects between
customer immersive experience and its outcomes. Technology anxiety was measured by
Venkatesh et al. (2014) consisting of four items (e.g. “I feel apprehensive about using MAR apps”).
Because the scales in the current study were adopted from previous studies, it was necessary to
use control variables to reduce systematic errors in data collection and analysis. Three control
variables used in this study, including privacy concern, education and gender are used to reduce
systematic errors in data collection and data analysis. These control variables were evaluated to
test their effects on adoption intention (e.g. Rauschnabel and Ro (2017), Moore and McElroy (2012),
and Venkatesh et al. (2014). A questionnaire was initially adopted in English and then translated
back into Vietnamese. Vietnamese-English translation needed to be consistent in content in the
questionnaire to avoid data bias. All items of construct scales were measured on 7-point Likert
scale (from 1 = entirely disagree to 7 = completely agree).
4. Results
4.1. The results of descriptive analysis
In the data set of samples, the majority of respondents were female (59%) and urban (56%), age
level between 25 and 55 (87%). Most of respondents were at undergraduate degree level or below
Page 6 of 17
Vo et al., Cogent Business & Management (2022), 9: 2063778
/>
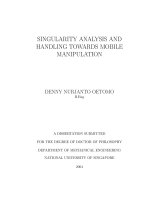
Table 1. Characteristics of respondents
Characteristic
Gender
Frequency of
Mobile apps experience
Age (years old)
Area
Education
Monthly Income
(million VND)*
Frequency (n = 332)
Percentage (%)
Female
Item
196
59
Male
136
41
Daily
40
12
Some times a week
34
10
Once a month
131
39
Some times a month
83
25
Some times a year
44
13
15≤ Age <25
27
8
25≤ Age <35
98
30
35≤ Age <45
119
36
45≤ Age <55
73
22
Age ≥ 55
15
5
Urban
187
56
Rural
145
44
Secondary school
4
1
High school
11
3
Intermediate
37
11
College
105
32
Bachelor
132
40
Postgraduate
25
8
Others
18
5
Income < 5
9
3
5≤ Income <10
36
31
10≤ Income <15
127
28
15≤ Income<20
131
29
Income ≥ 20
29
9
332
100
Total
* VND: Vietnam dong(Source: Author’s calculation)
(87%), and almost all respondents were using mobile apps in their experience. In terms of income
per month, 3% respondents had an income less than five million VND, 28% respondents from 10 to
15 million VND per month, 29% respondents had an income from 15 to 20 million VND. The most
impressive percentage is 31% of customers’ monthly income from 5 to 10 million and the rest
made more than 10 million VND. The characteristics of chosen respondents are showed in Table 1.
4.2. Validation of measurement model
According to Hair Jr et al. (2016), partial least squares – with structural equation modeling (PLSSEM) software was recently utilized in retailing settings, particularly augmented reality applications
(Nikhashemi et al., 2021), thus using PLS-SEM is suitable for our study. Moreover, the Partial Least
Square (PLS) to analyze the collection data because of some reasons like PLS-SEM’s small sample
size capabilities, using the HTMT criterion for discriminant validity testing, not necessarily assessing
a PLS path model’s goodness-of-fit, etc. (Hair et al., 2019).
In order to evaluate the scales’ reliability in the measurement model, previous studies of (Hair
Jr et al., 2016; Hair Jr et al., 2017) in related to PLS-SEM showed that Cronbach’s alpha (CA),
composite reliability (CR), average variance extracted (AVE) and factor loadings were used to test
Page 7 of 17
Vo et al., Cogent Business & Management (2022), 9: 2063778
/>
Table 2. Accuracy analysis of constructs and indicators
Constructs/dimensions
Factor loading
Immersive experience
While I was using this
augmented reality service,
I was absorbed in what
I was doing
0.889
I was immersed in the task
that I was performing
0.938
I felt completely immersed
0.911
Attitude toward the AR
apps
I am positive about the AR
app.
0.842
The AR app is so interesting
that you just want to learn
more about it.
0.906
It just makes sense to use
the AR app.
0.907
The use of the AR app is
a good idea.
0.857
Other people should also
use the AR app
0.756
Adoption intention
regarding the AR apps
CA
CR
AVE
0.900
0.938
0.834
0.907
0.931
0.731
0.906
0.930
0.727
0.933
0.952
0.832
If I were to buy this product
in the future, I would . . .
. . . download or use the AR
app immediately.
0.818
. . . give the AR app priority
over the printed catalogue.
0.887
. . . .l recommend using the
AR app to my friends.
0.905
. . . . use the AR app
regularly in the future.
0.878
. . . give the AR app priority
over the catalogues of
other providers.
0.798
Technology anxiety
I feel apprehensive about
using AR apps.
0.883
It scares me to think that
I could lose a lot of
information using AR apps
by hitting the wrong key.
0.905
I hesitate to use AR apps
for fear of making mistakes
I cannot correct.
0.900
I have avoided technology
because it is unfamiliar to
me
0.959
Note. AVE = average variance extracted; CA: Cronbach Alpha, CR = composite reliability;
Page 8 of 17
Vo et al., Cogent Business & Management (2022), 9: 2063778
/>
Table 3. Table Fornell-Larcker criterion and Heterotrait-Monotrait ratio (*)
1
2
1. Attitudinal response
toward AR apps
0.855
2. Adoption intention
regarding the AR apps
0.481/0.523*
0.853
3. Immersive
experience
0.72/0.630*
0.387/0.424*
3
0.913
indicators’ reliability. The results (see, Table 2) revealed that all Cronbach’s alpha value and
composite reliabilities were superior to the recommended value of 0.7, showing that the con
structs’ reliability was significant in measurement model. The average variance extracted (AVE)
and value of factor loadings is used to test the constructs’ convergence validity. The results (see,
Table 2) showed that all factor loadings were greater than 0.7 and AVE values were higher than
0.5. Thus,the constructs’ convergence validity has a satisfactory results (Hair Jr et al. (2016).
4.3. The discriminant validity
According to (Hair Jr et al. (2017), the aim of this study is to evaluate the discriminant validity three
valid PLS-SEM criteria were followed: (i) the loading coefficients must be greater than the cross
loads; (ii) the inter-construct correlations must be less than the square root of the AVE values; and
(iii) HTMT values of the latent variables were lower than 0.85 (Hair Jr et al., 2016) and the
heterotrait-monotrait (HTMT) ratio must be less than 0.9. Therefore, the measurement model
was validated by the above results (see, Table 3).
4.4. Testing the structural model and its relationships
According to Hair Jr et al. (2017) and the results in this study, all collinearity Statistics (VIF) values is
less than 5.0., thus collinearity phenomenon among predictor variables did not occurs. Moreover, the
SRMR value in this study is 0.049, which is less than 0.08. Therefore, the model has a good fit and can
evaluate the structural model measurement. The structural model was analyzed through R2 value
and the value of the significance of relations in research model (P-value) using bootstrapping with
5,000 samples. The structural model was tested and the results are displayed in Table 4, R2 value is
used to measure the fit of the model and the predicting power of the structural model Hair Jr et al.
(2017). According to Henseler et al. (2010), effect size (f2) refers to “the increase in R2 relative to the
proportion of variance of the endogenous latent variable that remains unexplained.” Effect size (f2)
values of 0.02, 0.15, and 0.35 showed that small, medium, and large effects, respectively (Henseler
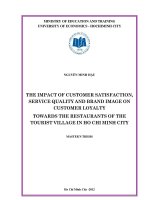
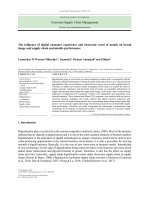
et al., 2009). As can be seen in Table 4 and figure 1, all the model hypotheses were supported.
4.5. Testing the hypotheses in the proposed model
5. The quality of the proposed model
The value of SRMR was 0.049, which is less than 0.08, asserting a good fit to test the hypotheses in
the model. Moreover, Stone-Geisser Indicator (Q2) and R-squared (R2) values of the endogenous
constructs were used to assess the predictive relevance and predictive power of the proposed
research model. As described in Figure 1, the results of R2 of immersive experience (0.631), attitude
toward MAR apps (0.508), adoption intention regarding MAR apps (0.346) all obtained the sub
stantial level (Henseler et al., 2009), thus indicating the endogenous construct’s predictive power in
the current model. Moreover, according to variables, the Q2 result of immersive experience was
higher than zero, thus proving the predictive relevance of other latent. In addition, after calculating
t-test from 5000 samples of bootstrapping analysis, Cohen’s Indicator in Table 5 were used to
evaluate the effect size (f2) of construct’s relationships (Henseler et al., 2009) with the values range
from 0.18 to 0.36, proving that the robustness of the relationships of latent variables had medium
and strong effect sizes level (Hair Jr et al., 2017). In general, these above analysis reveal that there
Page 9 of 17
Vo et al., Cogent Business & Management (2022), 9: 2063778
/>
Table 4. Hypothesis testing results
Paths
(hypotheses)
Original sample
(O)
Sample mean
(M)
Standard
deviation
(STDEV)
T statistics
(|O/STDEV|)
P values
Results
Immersive
experience ->
Attitudinal
response toward
AR apps (H1)
0.572
0.572
0.048
4.840
0.000a
Significant
Attitudinal
response toward
AR apps ->
Adoption intention
(H2)
0.258
0.264
0.076
3.385
0.001b
Significant
0.147
0.150
0.059
2.482
0.013b
Significant
Moderating 1(H4a)
0.126
0.132
0.049
2.591
0.01b
Significant
Moderating 2
(H4b)
0.019
0.015
0.052
2.358
0.013d
Significant
Age -> Adoption
intention regarding
the app
0.086
0.086
0.045
1.903
0.06c
Significant
Education ->
Adoption intention
regarding the app
0.111
0.111
0.048
2.306
0.021d
Significant
Income ->
Adoption intention
regarding the app
0.156
0.155
0.051
3.078
0.002b
Significant
Privacy concern ->
Adoption intention
regarding the app
0.198
0.199
0.074
2.666
0.008b
Significant
Mediating effects
Direct effects
Immersive
experience ->
Adoption intention
(H3)
Moderating
effects
Control variables
Note: Ap ≤ 0.001. bp <0 .005. cp <.01. dp < .10.N = 332, Bootstrap sample size 5,000. R2 Immersive experience: 63.4% Q2: 0.475
was a qualified structural model. In the next step, direct relationships, mediating, and moderating
effects will be described and analyzed below.
Direct and mediating effects:
According to Zhao et al. (2010), using bootstrapping test (5,000 samples) in PLS-SEM software
can examine the moderating, mediating effects instead of replace the Baron-Kenny’s procedure as
well as the Sobel’s test. The results in Table 5 pointed out that most of the hypotheses among
latent variables were statistically significant. In detail, indirect effects of H1 (β = 0.572, t = 4.840,
p < 0.001), H2 (β = 0.258, t = 3.385, p < 0.005) had a significant impact in their indirect relationships
in research model. Table 5 shows how mediating variable impacts, consisting of hypotheses H3
(β = 0.147, t = 2.482, p < 0.05) were supported at 99%, 95% confidence level, respectively, thus H3
were supported. These analyses is essential for testing the control variables of privacy concern,
education, income and gender on adoption intention regarding MAR apps. The f2 values of attitude
Page 10 of 17
Vo et al., Cogent Business & Management (2022), 9: 2063778
/>
Figure 1. Research framework
and hypothesis-testing results.
toward MAR apps on adoption intention regarding MAR apps at 0.36, pointing out that the strength
of the relationships had strong effect sizes.
Moderating effects:
The purpose of the present study is to examine the moderation (the interaction effect) (moderation)
of technology anxiety on the interrelationships adoption intention and its antecedents. SmartPLS
software was used in this study to test the interaction (Hair et al., 2016). In detail, hypothesis H4a was
supported (β = 0.126, t = 2.591, p < 0.001), indicating that technology anxiety moderated the effect of
attitude toward MAR apps and adoption intention. On other hand, hypothesis H4b, which proposed
that technology anxiety moderated the effect of immersive experience and adoption intention, was
also acceptable (β = 0.126, t = 2.591, p > 0.01). The strength of the interaction effects of two
moderating relationship H4a (f2 = 0.26) and H4b (f2 = 0.18) were revealed with medium effect sizes.
Therefore, the results of this study pointed that technology anxiety strengthened the relationship
between immersive experience and its antecedents.
6. The effect of control variables
Control variable analysis to test their effects on adoption intention regarding MAR apps. Among the
four control variables, privacy concern, income, and education level had significant effects on
adoption intention regarding MAR apps as the dependent variable. Specifically, privacy concern
had a positive effect on adoption intention regarding MAR apps (β = 0.198, t = 2.66, p < 0.01).
Similarly, other control variables as education level (β = 0.11, t = 2.306, p < 0.1) and income
monthly (β = 0.156, t = 3.078, p < 0.1) had a positive effect on this dependent variable. The impact
of age level on adoption intention regarding MAR apps was acceptable (β = 0.086, t = 1.903,
p < 0.1). The results are revealed in Table 5, proving control variables, including privacy concern,
education, age, and income monthly, were significant.
Page 11 of 17
Vo et al., Cogent Business & Management (2022), 9: 2063778
/>
7. Discussions and implications
Our study aims at developing and empirically testing the dynamic model connecting customer
immersive experience, attitude and adoption intention toward MAR apps under the contingency
role of technology anxiety. Based on the data from 322 online shopping participants, the testing
results demonstrate that all proposed hypotheses are supported. The finding that immersive
experience has significant and positive effects on customers’ attitude and adoption intention
toward MAR apps helps confirm our argument regarding the enormous potential of interactive
technologies like MAR apps in providing added value to customers and resulting in profitability
to online retailers. While previous studies (Kowalczuk et al., 2021; Song et al., 2018) focus on
students using MAR apps at campus of universities where it is easy for them to download,
install, and virtual try-on, in our study, customers with different ages and education levels are
investigated to identify their responses after trying MAR apps. In addition, consistent with
a number of prior studies (e.g. Song et al., 2018; Yim et al.), our finding supports that MAR
apps enable customers and potential users by touching them through camera on smartphone,
then customers are confident to make purchase decisions. MAR apps help customers see how
many products can fit them personally (Rese et al., Rese et al., 2017). When customers interact
with the objects, they feel immersed in MAR apps, their adoption intention toward MAR apps
increases. AR-based apps shape customer behaviors through introducing digital information into
customers’ perceptions (Hinsch et al., 2020). Moreover, MAR apps obviously support retailers to
establish long-lasting relationships with their customers, so this technology has the potential to
change the way customers socialize, interact, and conduct their business. MAR apps give
retailers profitable benefits in stimulating customers to virtual try-on, increase their brand
awareness and customer loyalty. In particular, AR technology enables retailers to redesign
and reshape mobile apps-based retail stores by promoting customers’ immersive experience.
Retailers can apply MAR apps to provide customers with virtual try-on experience to identify
which are the best products suitable for their requirements. Thus, MAR apps are important tools
for retailers to generate a memorable experience and make customers become more immersed
and engaged.
Our study also examines the moderating role of technology anxiety on the relationships
between adoption intention using MAR apps and its antecedents in the model. The results reveal
that customers with high level of technology anxiety tend to perceive that the benefits of
emerging technologies like MAR apps are more considerable, and they are more willing to spend
time using MAR apps and frequently use these virtual try-on apps when shopping online. Our
moderating finding provides additional evidence to advocate that technology anxiety as customer
traits plays a crucial role in moderating the relationships between their immersive experience and
its outcomes. Kim and Forsythe (2008a) also study technology anxiety as moderator variable on
the relationship between attitude and intended usage of virtual try-on apps, however their finding
indicates insignificant impact on the virtual try-on process via online virtual experience. Our
finding contributes to the existing knowledge regarding the moderating role of technology anxiety
when consumers experience MAR apps in retail settings, especially in the developing market of
Vietnam.
8. Theoretical implications
Our study contributes to the literature pertaining to customers’ adoption intention toward MAR
apps in several ways. First of all, previous empirical studies have focused on some psychological
states such as customer engagement (e.g. (Ho et al., 2021; Jessen et al., 2015), presence (e.g.
(Orús et al., 2022; Wang et al., 2021), and flow (Arghashi & Yuksel, 2022; Barhorst et al., 2021). In
this study, customer immersive experience is also considered as one of the psychological states
possessing direct and indirect positive relationships with the adoption intention using MAR apps in
the context of a Vietnamese developing market. In addition, the adoption intention of MAR apps
can be considered as an antecedent of purchase decision or consumer behavior as the Theory of
Planned Behavior (Ajzen, 1991). The use of MAR apps enables customer immersive experience that
lead to positive attitude and adoption intention which, in turn, facilitate purchase decisions.
Page 12 of 17
Vo et al., Cogent Business & Management (2022), 9: 2063778
/>
Regarding the usage of interactive technologies, individual traits ready for adopting new tech
nologies as personal innovativeness, sensation seeking tendency (Huang & Liu, 2019; Jung et al.,
2015; Suh & Prophet,) have been advocated to moderate customer evaluation, feelings on adop
tion responses. Our moderating finding demonstrates technology anxiety, also as one of individual
traits pertaining to the apprehension of new technologies, has a crucial impact on the relationships
from immersive experience to attitude and adoption intention toward MAR apps.
9. Managerial implications
Drawing on the above findings that clarify how MAR apps can be an interactive technology for
markets related to immersive experience, attitude, adoption intention, and technology anxiety,
this study provides the following managerial implications for retailers.
First of all, future MAR apps are expected to be applied for getting more information about
products (e.g., make-up, shoes, glasses, clothing, etc.) and for online shopping anywhere, anytime
via smartphones, and for enhancing consumer immersive experience. MAR apps based virtual
stores will affect the way in which retailers pay attention to their consumers. Due to virtual tryon through smartphones, customers feel more engaged in these augmented reality activities that
influence their positive evaluation related to product choices. With MAR apps, customers can
virtually try on products on their smartphone without having to visit physical stores. According
to Oyman et al. (2022), AR market is estimated to be $50 billion before 2024, 71% of consumers
shopped more frequently from retailers using AR and they would be willing to pay more for the
products offered via AR. Thus, retailers should provide products through MAR apps to create
immersive experience for their customers.
Moreover, this research uncovers that after virtual try-on MAR apps, customers’ immersive
experience leads to positive attitudes, then they are more willing to use MAR apps again in future
purchases. The finding also shows that the positive attitude reinforces their adoption intention.
Managers should keep in mind that if customers have positive ideas about MAR apps, in the future,
when they intend to buy products, they will use these technologies in their purchase process, and
might even recommend others to use them.
Last but not least, the moderating effect of technology anxiety on adoption intention suggests
that firms pay attention to customer’s technology anxiety. Daassi and Debbabi (2021) argue that
young people tend to have less technology anxiety about virtual try-on apps than older people. The
results show that customers are more interested in interactive technology as MAR apps. Recently,
new technologies are increasingly applied in the retailing sector, individual traits such as technol
ogy anxiety should get more attention because it is closely related to avoidance behaviors. The
increasing appearance of fraud on smartphones and mobile applications makes customers more
anxious about providing personal information. Thus, online business firms should be concern about
users’ technology anxiety and provide easy-to-use MAR apps and ensure their secured personal
information.
10. Limitations and future research
This study aimed to explain the moderated mediating effects on customer immersive experience
using MAR apps; however, there are some limitations. Firstly, the data of this study was only
collected in Ho Chi Minh city, which are presented for urban and rural area of Vietnam, respectively.
Future studies could extend the data collection (e.g. other developing countries in same Asian
region) to reach a more general results. Secondly, this study can narrow the target samples as
student. Because most of students use their smartphones applications and integrate them into
their daily lives, they tend to feel more immersed in and more readily adopt new technologies than
others (i.e. older consumers). Thus, students have become significant targets as potential con
sumers of new MAR apps, serving as candidate population for future research. Moreover, most
respondents focused on some MAR apps, more MAR apps-related functional features can be
applied for future research. This study only evaluated adoption intention regarding MAR apps as
Page 13 of 17
Vo et al., Cogent Business & Management (2022), 9: 2063778
/>
a dependent variable, future research can add variables that derive from adoption intention
regarding MAR apps, such as actual purchase behavior or decision comfort.
Acknowledgments
This research is funded by Vietnam National Foundation
for Science and Technology Development (NAFOSTED)
under grant number 502.02–2020.30.
Funding
This work was supported by the The author(s) disclosed
receipt of the following financial support for the research,
authorship and/or publication of this article: This work was
supported by the University of Economics Ho Chi Minh City’s
academic fund [502.02–2020.30]. This research is funded by
Vietnam National Foundation for Science and Technology
Development (NAFOSTED) under grant number 502.02–
2020.30 [502.02–2020.30]. This research is funded by
Vietnam National Foundation for Science and Technology
Development (NAFOSTED) under grant number 502.02–
2020.30 [502.02–2020.30]. This research is funded by
Vietnam National Foundation for Science and Technology
Development (NAFOSTED) under grant number 502.02–
2020.30 [502.02–2020.30].
Author details
Kim Nhan Vo1
E-mail:
Angelina Nhat Hanh Le2
Le Thanh Tam3
Huong Ho Xuan4
1
University of Economics Ho Chi Minh City, Lecturer at
Tien Giang University, Vietnam.
2
School of Management, University of Economics Ho Chi
Minh City, Ho Chi Minh City Vietnam.
3
School of Banking and Finance, National Economics
University, Ha Noi, Vietnam.
4
School of International Business and Marketing,
University of Economics Ho Chi Minh City, Ho Chi Minh
City Vietnam.
Disclosure statement
No potential conflict of interest was reported by the author(s).
Citation information
Cite this article as: Immersive experience and customer
responses towards mobile augmented reality applica
tions: The moderating role of technology anxiety, Kim
Nhan Vo, Angelina Nhat Hanh Le, Le Thanh Tam & Huong
Ho Xuan, Cogent Business & Management (2022), 9:
2063778.
References
Agarwal, R., & Karahanna, E. (2000). Time flies when
you’re having fun: Cognitive absorption and beliefs
about information technology usage. MIS
Quarterly, 24(4), 665–694. />3250951
Ahmad, N., & Abdulkarim, H. (2018). The impact of flow
experience and personality type on the intention to
use virtual World. International Journal of Human–
Computer Interaction, 35(12), 1074–1085. https://doi.
org/10.1080/10447318.2018.1509500
Ajzen, I. (1991). The theory of planned behavior.
Organizational Behavior and Human Decision
Processes, 50(2), 179–211. />0749-5978(91)90020-T
Al-Hattami, H. M., & Gomez Corona, C. (2021).
Determinants of intention to continue usage of
online shopping under a pandemic: COVID-19.
Cogent Business & Management, 8(1), 1936368.
/>
Alimamy, S., & Gnoth, J. (2022). I want it my way! The
effect of perceptions of personalization through
augmented reality and online shopping on customer
intentions to co-create value. Computers in Human
Behavior, 128, 107105. />2021.107105
Arghashi, V., & Yuksel, C. A. (2022). Interactivity, inspira
tion, and perceived usefulness! How retailers’ ARapps improve consumer engagement through flow.
Journal of Retailing and Consumer Services, 64,
102756. />102756
Azjen, I. (1980). Understanding attitudes and predicting
social behavior. Englewood Cliffs.
Baier, D., Rese, A., & Schreiber, S. (2015). Analyzing online
reviews to measure augmented reality acceptance at
the point of sale: The case of IKEA. In Successful
technological integration for competitive advantage in
retail settings edited by E. Pantano (pp. 168–189).
Hershey, PA: Business Science Reference.
Barhorst, J. B., McLean, G., Shah, E., & Mack, R. (2021).
Blending the real world and the virtual world: Exploring
the role of flow in augmented reality experiences.
Journal of Business Research, 122, 423–436. https://doi.
org/10.1016/j.jbusres.2020.08.041
Blumenthal, V. (2020). Consumer immersion in managed
visitor attractions: The role of individual responses
and antecedent factors. Scandinavian Journal of
Hospitality and Tourism, 20(1), 4–27. />10.1080/15022250.2020.1725624
Blumenthal, V., & Jensen, Ø. (2019). Consumer immersion
in the experiencescape of managed visitor attrac
tions: The nature of the immersion process and the
role of involvement. Tourism Management
Perspectives, 30, 159–170. />tmp.2019.02.008
Brown, E., & Cairns, P. (2004), A grounded investigation of
game immersion ,Paper presented at the CHI’04
extended abstracts on Human factors in computing
systems.
Carù, A., & Cova, B. (2006). How to facilitate immersion in
a consumption experience: Appropriation operations
and service elements. Journal of Consumer
Behaviour: An International Research Review, 5(1),
4–14. />Carù, A., & Cova, B. (2007). Consumer immersion in an
experiential context. Consuming Experience, Chapter
3, 34–47, London: Routledge. />14705931030032004
Csikszentmihalyi, M. (1988). The flow experience and its
significance for human psychology. In M.
Csikszentmihalyi & I. S. Csikszentmihalyi (Eds.),
Optimal experience: Psychological studies of flow in
consciousness (pp. 15–350). Cambridge, MA:
Cambridge University Press.
Daassi, M., & Debbabi, S. (2021). Intention to reuse
AR-based apps: The combined role of the sense of
immersion, product presence and perceived realism.
Information & Management, 58(4), 103453. https://
doi.org/10.1016/j.im.2021.103453
Dacko, S. G. (2017). Enabling smart retail settings via mobile
augmented reality shopping apps. Technological
Forecasting and Social Change, 124, 243–256. https://
doi.org/10.1016/j.techfore.2016.09.032
Davis, F. D. (1989). Perceived usefulness, perceived ease
of use, and user acceptance of information
technology. MIS Quarterly, 13(3), 319–340. https://
doi.org/10.2307/249008
Page 14 of 17
Vo et al., Cogent Business & Management (2022), 9: 2063778
/>
Feng, Y., & Xie, Q. (2019). Privacy concerns, perceived
intrusiveness, and privacy controls: An analysis of
virtual try-on apps. Journal of Interactive Advertising,
19(1), 43–57.
Fernandes, N., Barfknecht, C., & Wright, L. T. (2020). Keep
customers coming back: Enhancing value and satis
faction in a mobile shopping application context.
Cogent Business & Management, 7(1), 1788874.
/>Flavián, C., Ibáñez-Sánchez, S., & Orús, C. (2019).
Integrating virtual reality devices into the body:
Effects of technological embodiment on customer
engagement and behavioral intentions toward the
destination. Journal of Travel & Tourism Marketing, 36
(7), 847–863. />2019.1618781
Georgiou, Y., & Kyza, E. A. (2017). The development and
validation of the ARI questionnaire: An instrument
for measuring immersion in location-based aug
mented reality settings. International Journal of
Human-Computer Studies, 98(1), 24–37. https://doi.
org/10.1016/j.ijhcs.2016.09.014
Georgiou, Y., & Kyza, E. A. (2018). Relations between
student motivation, immersion and learning out
comes in location-based augmented reality settings.
Computers in Human Behavior, 89(1), 173–181.
/>Hair, J. F., Risher, J. J., Sarstedt, M., & Ringle, C. M. (2019).
When to use and how to report the results of PLSSEM. European Business Review, 31(1), 2–24.
Hansen, A. H., & Mossberg, L. (2013). Consumer immer
sion: A key to extraordinary experiences & . In
Handbook on the experience economy. 209–227.
Edward Elgar Publishing
Heller, J., Chylinski, M., de Ruyter, K., Mahr, D., & Keeling, D. I.
(2019). Let me imagine that for you: Transforming the
retail frontline through augmenting customer mental
imagery ability. Journal of Retailing, 95(2), 94–114.
/>Henseler, J. (2010). On the convergence of the partial
least squares path modeling algorithm.
Computational Statistics, 25(1), 107–120.
Hilken, T., de Ruyter, K., Chylinski, M., Mahr, D., &
Keeling, D. I. (2017). Augmenting the eye of the
beholder: Exploring the strategic potential of aug
mented reality to enhance online service
experiences. Journal of the Academy of Marketing
Science, 45(6), 884–905. />s11747-017-0541-x
Hilken, T., Heller, J., Chylinski, M., Keeling, D. I., Mahr, D., & de
Ruyter, K. (2018). Making omnichannel an augmented
reality: The current and future state of the art. Journal
of Research in Interactive Marketing, 12(4), 509–523.
/>Hinsch, C., Felix, R., & Rauschnabel, P. A. (2020). Nostalgia
beats the wow-effect: Inspiration, awe and meaningful
associations in augmented reality marketing. Journal
of Retailing and Consumer Services, 53, 101987.
Ho, X. H., Nguyen, D. P., Cheng, J. M. S., & Le, A. N. x.
(2022). Customer engagement in the context of retail
mobile apps: A contingency model integrating spatial
presence experience and its drivers. Journal of
Retailing and Consumer Services, 66(1), 102950.
/>Hsu, S. H.-Y., Tsou, H.-T., & Chen, J.-S. (2021). Yes, we do.
Why not use augmented reality? customer responses
to experiential presentations of AR-based
applications. Journal of Retailing and Consumer
Services, 62(1), 102649. />conser.2021.102649
Huang, T.-L., & Liu, B. S. (2021). Augmented reality is
human-like: How the humanizing experience inspires
destination brand love. Technological Forecasting and
Social Change, 170(1), 120853. />1016/j.techfore.2021.120853
Hudson, S., Matson-Barkat, S., Pallamin, N., & Jegou, G.
(2019). With or without you? Interaction and
immersion in a virtual reality experience. Journal of
Business Research, 100(1), 459–468. />10.1016/j.jbusres.2018.10.062
Irawan, M. Z., Rizki, M., Joewono, T. B., & Belgiawan, P. F.
(2020). Exploring the intention of out-of-home
activities participation during new normal conditions
in Indonesian cities”. Transportation Research
Interdisciplinary Perspectives, 8, 100237.
Javornik, A. (2016). It’s an illusion, but it looks
real!’Consumer affective, cognitive and behavioural
responses to augmented reality applications. Journal
of Marketing Management, 32(9–10), 987–1011.
/>Javornik, A., Marder, B., Barhorst, J. B., McLean, G.,
Rogers, Y., Marshall, P., & Warlop, L. (2022). What lies
behind the filter?’Uncovering the motivations for
using augmented reality (AR) face filters on social
media and their effect on well-being. Computers in
Human Behavior, 128(1), 107126. />1016/j.chb.2021.107126
Jessen, A., Hilken, T., Chylinski, M., Mahr, D., Heller, J.,
Keeling, D. I., & de Ruyter, K. (2020). The playground
effect: How augmented reality drives creative custo
mer engagement. Journal of Business Research, 116(1),
85–98. />Jung, T., Chung, N., & Leue, M. C. (2015). The determinants
of recommendations to use augmented reality tech
nologies: The case of a Korean theme park. Tourism
Management, 49(1), 75–86. />tourman.2015.02.013
Kim, J., & Forsythe, S. (2008a). Sensory enabling technology
acceptance model (SE-TAM): A multiple-group struc
tural model comparison. Psychology & Marketing, 25
(9), 901–922. />Kim, J., & Forsythe, S. (2008b). Adoption of virtual try-on
technology for online apparel shopping. Journal of
Interactive Marketing, 22(2), 45–59. />10.1002/dir.20113
Kowalczuk, P., Siepmann, C., & Adler, J. (2021).
Cognitive, affective, and behavioral consumer
responses to augmented reality in e-commerce:
A comparative study. Journal of Business Research,
124(1), 357–373. />2020.10.050
Li, A., & Xu, Y. (2020). A study of Chinese consumers’
adoption behaviour toward virtual fitting rooms.
International Journal of Fashion Design, Technology
and Education, 13(2), 140–149. />1080/17543266.2020.1758798
Lu, Y., & Smith, S. (2007), Augmented reality e-commerce
assistant system: Trying while shopping, Paper pre
sented at the international conference on humancomputer interaction.Springer
Mauroner, O., Le, L., & Best, S. (2016). Augmented reality
in advertising and brand communication: An experi
mental study. International Journal of Information
and Communication Engineering, 10(2), 422–425.
Mekni, M., & Lemieux, A. (2014). Augmented reality:
Applications, challenges and future trends. Applied
Computational Science, 20, 205–214.
Meuter, M. L., Ostrom, A. L., Bitner, M. J., & Roundtree, R.
(2003). The influence of technology anxiety on consu
mer use and experiences with self-service technologies.
Page 15 of 17
Vo et al., Cogent Business & Management (2022), 9: 2063778
/>
Journal of Business Research, 56(11), 899–906. https://
doi.org/10.1016/S0148-2963(01)00276-4
Moore, K., & McElroy, J. C. (2012). The influence of per
sonality on Facebook usage, wall postings, and
regret. Computers in Human Behavior, 28(1),
267–274. />Moorhouse, N., Tom Dieck, M. C., & Jung, T. (2018).
Technological innovations transforming the consumer
retail experience: A review of literature. In Augmented
reality and virtual reality (pp. 133–143). Springer.
Nikhashemi, S. R., Knight, H. H., Nusair, K., & Liat, C. B. (2021).
Augmented reality in smart retailing: A. Journal of
Retailing and Consumer Services, 60, 102464.
Orús, C., Ibáñez-Sánchez, S., & Flavián, C. (2021).
Enhancing the customer experience with virtual and
augmented reality: The impact of content and device
type. International Journal of Hospitality
Management, 98(1), 103019. />j.ijhm.2021.103019
Oyman, M., Bal, D., & Ozer, S. (2022). Extending the tech
nology acceptance model to explain how perceived
augmented reality affects consumers’ perceptions.
Computers in Human Behavior, 128(1), 107127.
/>Pantano, E., Rese, A., & Baier, D. (2017). Enhancing the online
decision-making process by using augmented reality:
A two country comparison of youth markets. Journal of
Retailing and Consumer Services, 38(5) 81–95. https://
doi.org/10.1016/j.jretconser.2017.05.011
Park, M., & Yoo, J. (2020). Effects of perceived interactivity
of augmented reality on consumer responses: A
mental imagery perspective. Journal of Retailing and
Consumer Services, 52, 101912.
Parvinen, P., Oinas-Kukkonen, H., & Kaptein, M. (2015).
E-selling: A new avenue of research for service
design and online engagement. Electronic
Commerce Research and Applications, 14(4),
214–221. />007
Peukert, C., Pfeiffer, J., Meißner, M., Pfeiffer, T., &
Weinhardt, C. (2019). Shopping in virtual reality
stores: the influence of immersion on system
adoption. Journal of Management Information
Systems, 36(3), 755–788. />07421222.2019.1628889
Pine, B. J., Pine, J., & Gilmore, J. H. (1999), The experience
economy: Work is theatre & every business a stage.
Harvard Business Press
Qin, H., Peak, D. A., & Prybutok, V. (2021). A virtual market
in your pocket: How does mobile augmented reality
(MAR) influence consumer decision making? Journal
of Retailing and Consumer Services, 58(1), 102337.
/>Radianti, J., Majchrzak, T. A., Fromm, J., & Wohlgenannt, I.
(2020). A systematic review of immersive virtual
reality applications for higher education: Design ele
ments, lessons learned, and research agenda.
Computers & Education, 147(4) 103778. https://doi.
org/10.1016/j.compedu.2019.103778
Rauschnabel, P. A., Felix, R., & Hinsch, C. (2019).
Augmented reality marketing: How mobile AR-apps
can improve brands through inspiration. Journal of
Retailing and Consumer Services, 49, 43–53.
Rauschnabel, P. A., & Ro, Y. K. (2016). Augmented rea
lity smart glasses: An investigation of technology
acceptance drivers. International Journal of
Technology Marketing, 11(2), 123–148. https://doi.
org/10.1504/IJTMKT.2016.075690
Rese, A., Baier, D., Geyer-Schulz, A., & Schreiber, S. (2017).
How augmented reality apps are accepted by con
sumers: A comparative analysis using scales and
opinions. Technological Forecasting and Social
Change, 124(1), 306–319. />techfore.2016.10.010
Ryan, R. M., & Deci, E. L. (2000). Intrinsic and extrinsic
motivations: Classic definitions and new directions.
Contemporary Educational Psychology, 25(1), 54–67.
/>Shin, H. H., & Jeong, M. (2021). Travelers’ motivations to
adopt augmented reality (AR) applications in a tour
ism destination. Journal of Hospitality and Tourism
Technology, 12(2), 389–405.
Song, H. K., Baek, E., & Choo, H. J. (2019). Try-on experi
ence with augmented reality comforts your decision.
Information Technology & People, 33(4), 1214–1234.
/>Suh, A., & Prophet, J. (2018). The state of immersive
technology research: A literature analysis. Computers
in Human Behavior, 86(1), 77–90. />1016/j.chb.2018.04.019
Sung, E., Han, D. I. D., & Choi, Y. K. (2022). Augmented
reality advertising via a mobile app. Psychology &
Marketing, 39(3), 543–558.
Tsai, S.-P. (2020). Augmented reality enhancing place
satisfaction for heritage tourism marketing. Current
Issues in Tourism, 23(9), 1078–1083. />10.1080/13683500.2019.1598950
Venkatesh, V., Morris, M. G., Davis, G. B., & Davis, F. D.
(2003). User acceptance of information technology:
Toward a unified view. MIS Quarterly, 27(3), 425–478.
/>Verhagen, T., Vonkeman, C., Feldberg, F., & Verhagen, P.
(2014). Present it like it is here: Creating local pre
sence to improve online product experiences.
Computers in Human Behavior, 39(1), 270–280.
/>Wang, Y., Ko, E., & Wang, H. (2021). Augmented reality
(AR) app use in the beauty product industry and
consumer purchase intention. Asia Pacific Journal of
Marketing and Logistics, 34(1), 110–131. https://doi.
org/10.1108/APJML-11-2019-0684
Weibel, D., Wissmath, B., & Mast, F. W. (2010). Immersion
in mediated environments: The role of personality
traits. Cyberpsychology, Behavior, and Social
Networking, 13(3), 251–256. />cyber.2009.0171
Witmer, B. G., & Singer, M. J. (1998). Measuring presence
in virtual environments: A presence questionnaire.
Presence: Teleoperators and Virtual Environments, 7
(3), 225–240. />105474698565686
Yang, K., & Forney, J. C. (2013). The moderating role of
consumer technology anxiety in mobile shopping
adoption: Differential effects of facilitating conditions
and social influences. Journal of Electronic Commerce
Research, 14(4), 334.
Page 16 of 17
Vo et al., Cogent Business & Management (2022), 9: 2063778
/>
Yim, M. Y.-C., Chu, S.-C., & Sauer, P. L. (2017). Is augmented
reality technology an effective tool for commerce? An
interactivity and vividness perspective. Journal of
Interactive Marketing, 39(1), 89–103. />1016/j.intmar.2017.04.001
Zhao, X., Lynch, J. G., Jr., & Chen, Q. (2010). Reconsidering
Baron and Kenny: Myths and truths about mediation
analysis. The Journal of Consumer Research, 37(2), 197–
206.
Zubizarreta, J., Aguinaga, I., & Amundarain, A. (2019).
A framework for augmented reality guidance in
industry. The International Journal of Advanced
Manufacturing Technology, 102(9–12), 4095–4108.
/>
© 2022 The Author(s). This open access article is distributed under a Creative Commons Attribution (CC-BY) 4.0 license.
You are free to:
Share — copy and redistribute the material in any medium or format.
Adapt — remix, transform, and build upon the material for any purpose, even commercially.
The licensor cannot revoke these freedoms as long as you follow the license terms.
Under the following terms:
Attribution — You must give appropriate credit, provide a link to the license, and indicate if changes were made.
You may do so in any reasonable manner, but not in any way that suggests the licensor endorses you or your use.
No additional restrictions
You may not apply legal terms or technological measures that legally restrict others from doing anything the license permits.
Cogent Business & Management (ISSN: ) is published by Cogent OA, part of Taylor & Francis Group.
Publishing with Cogent OA ensures:
•
Immediate, universal access to your article on publication
•
High visibility and discoverability via the Cogent OA website as well as Taylor & Francis Online
•
Download and citation statistics for your article
•
Rapid online publication
•
Input from, and dialog with, expert editors and editorial boards
•
Retention of full copyright of your article
•
Guaranteed legacy preservation of your article
•
Discounts and waivers for authors in developing regions
Submit your manuscript to a Cogent OA journal at www.CogentOA.com
Page 17 of 17