Báo cáo Y học: Substrates modulate the rate-determining step for CO binding in cytochrome P450cam (CYP101) A high-pressure stopped-flow study pdf
Bạn đang xem bản rút gọn của tài liệu. Xem và tải ngay bản đầy đủ của tài liệu tại đây (263.69 KB, 8 trang )
Substrates modulate the rate-determining step for CO binding
in cytochrome P450cam (CYP101)
A high-pressure stopped-flow study
Christiane Jung
1
, Nicole Bec
2
and Reinhard Lange
2
1
Max-Delbru
¨
ck-Center for Molecular Medicine, Protein Dynamics Laboratory, Berlin, Germany;
2
Institut National de la Sante
´
et de la Recherche Me
´
dicale, Unite
´
128, IFR24, Montpellier, France
The high-pressure stopped-flow technique is applied to study
the CO binding in cytochrome P450cam (P450cam) bound
with homologous substrates (1R-camphor, camphane, nor-
camphor and norbornane) and in the substrate-free protein.
The activation volume DV
#
of the CO on-rate is positive for
P450cam bound with substrates that do not contain methyl
groups. The k
on
rate constant for these substrate complexes
is in the order of 3 · 10
6
M
)1
Æs
)1
. In contrast, P450cam
complexed with substrates carrying methyl groups show a
negative activation volume and a low k
on
rate constant of
% 3 · 10
4
M
)1
Æs
)1
.Byrelatingk
on
and DV
#
with values for
the compressibility and the influx rate of water for the heme
pocket of the substrate complexes it is concluded that the
positive activation volume is indicative for a loosely bound
substrate that guarantees a high solvent accessibility for the
heme pocket and a very compressible active site. In addition,
subconformers have been found for the substrate-free and
camphane-bound protein which show different CO binding
kinetics.
Keywords: high-pressure stopped-flow; cytochrome P450;
CO ligand binding; protein dynamics.
Cytochromes P450 represent a big superfamily of heme-type
monooxygenases that catalyze the conversion of diverse
substrates [1]. Besides the main route of the reaction cycle
from the substrate to the product there are side reactions
which lead to the production of cytotoxic oxygen species
such as hydrogen peroxide or of water in the oxidase
reaction. These so-called uncoupling processes have been
observed in many cytochrome P450 systems [2]. However,
the structural parameters of the protein and the substrate
which are responsible for the uncoupling process are not
well understood. Data are increasingly accumulated indica-
ting that the dynamics of the protein structure and in
particular the accessibility of the active site for water
molecules are very important [3]. In the oxidized form of
P450 the high-spin/low-spin state equilibrium reflects a
time-averaged population of water molecules at the sixth
iron co-ordination site. This equilibrium can be monitored
using the heme Soret band [4]. However, for the iron-
reduced form there is no spectral signal that could be used
directly to monitor the water exchange. An indirect method
is a water replacement technique using a probe molecule. In
a large number of studies [4–9] using different approaches
we found that the CO iron ligand is a good probe for the
polarity and therefore for the presence of water molecules in
the heme environment of cytochrome P450cam.
To get a further insight into the dynamics of the water
exchange process in different substrate P450 complexes we
used the high-pressure stopped-flow technique [10,11]. The
activation volume as well as the rate constant for the CO
on-reaction obtained from such studies should allow us to
quantitate dynamic properties of the heme pocket when
P450 complexed with homologous substrates is studied.
High-pressure flash photolysis studies on ferrous heme
model complexes and heme proteins with imidazole as
proximal ligand show that the sign of the activation volume
for the overall on-reaction depends on the nature of the
ligand indicating two main steps, the iron-ligand bond
formation (negative DV
#
) and the entry of the ligand into
the protein (positive DV
#
), which can be rate-limiting [12]. It
was found that the overall activation volume for the CO
ligand binding in heme proteins with histidine proximal
ligand is always negative indicating that the bond formation
is the rate-limiting step. Considering these results it was
surprising that cytochromes P450 do not seem to show the
same behaviour. Lange et al. [11] have determined the
activation volumes for the CO binding in several cyto-
chromes P450 in the absence of a substrate using the
stopped-flow technique under high pressure. It turned out
that all the proteins which have a cysteine as proximal
ligand have a small positive activation volume of (+1)–
(+6) cm
3
Æmol
)1
. It was concluded that the transition state
in the sulfur ligand class proteins is structurally very close to
the ground state and that the negatively charged sulfur from
the cysteine ligand produces specific electronic properties
which may be the origin for this behaviour. However, flash
photolysis studies under pressure for P450cam in the
presence of various substrate analogues [13] indicate that
even negative activation volumes are possible. Due to the
Correspondence to C. Jung, Max-Delbru
¨
ck-Center for Molecular
Medicine, Protein Dynamics Laboratory, Robert-Ro
¨
ssle-Strasse 10,
13125 Berlin, Germany.
Fax: + 49 30 94063329, Tel.: + 49 30 94063370,
E-mail:
Abbreviations: P450, cytochrome P450; P450cam, 1R-camphor-
hydroxylating P450 from Pseudomonas putida (CYP101); P420,
denatured and nonactive form of P450; TMCH, 3,3,5,5-
tetramethylcyclohexanone; FTIR, Fourier transform infrared
(Received 28 January 2002, revised 9 April 2002, accepted 2 May 2002)
Eur. J. Biochem. 269, 2989–2996 (2002) Ó FEBS 2002 doi:10.1046/j.1432-1033.2002.02980.x
fact that in all these substrate complexes the cysteine ligand
is the same, the specific electronic structure of the proximal
ligand cannot be the origin for the positive activation
volume observed for some substrate complexes. To be sure
that this result is not only specific for CO rebinding induced
by flash photolysis we extended the high-pressure stopped-
flow study on P450cam by a homologous series of camphor
analogues (1R-camphor, camphane, norcamphor and nor-
bonane) and substrate-free protein. These camphor ana-
logues lack characteristic groups which are relevant for a fit
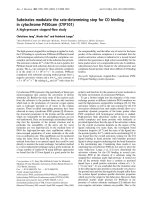
of the substrate into the heme pocket (Fig. 1). It will be
shown that the activation volume of the CO on-rate is
positive for P450cam bound with substrates which lack
methyl groups, are loosely bound, have a higher water influx
rate [3] and form a more compressible active site [7]. In
addition, subconformers have been found for the substrate-
free and camphane-bound protein which show different CO
binding kinetics.
MATERIALS AND METHODS
Cytochrome P450cam from Pseudomonas putida expressed
in Escherichia coli TB1 was isolated and purified as
described [14]. The absorbance ratio e
392nm
/e
280nm
of the
purified protein was 1.3. Substrate removal was performed
by dialysis against 50 m
M
Tris/HCl buffer, pH 7.4 and
Sephadex G-25 (medium) gel chromatography and final
dialysis against 100 m
M
potassium phosphate buffer, pH 7.
The concentrated substrate-free P450cam stock solution
was 1.1 m
M
. To have comparable conditions to previous
other experiments we used 100 m
M
potassium phosphate
buffer, pH 7.3 (20 °C), 10% (w/w) glycerol to which
aliquots of the P450cam stock solution were added.
1R-camphor was from Sigma. Camphane, norcamphor
and norbornane were from Aldrich.
Substrate analogues were added to the substrate-free
protein as few microliters aliquot of an ethanolic stock
solution. Because the substrates have different dissociation
constants [3] the substrate concentration was chosen such
that substrate complex was completely formed. The amount
of high-spin state content at 20 °Cwasestimatedfromthe
Soret band spectrum of the oxidized protein using the fit
procedure described earlier [4]. The P450cam concentration
before mixing was 5–6 l
M
in all experiments. We always
mixed equal volumes of an enzyme solution with the CO
solution. The buffer and substrate composition was the
same in both volumes. Both solutions were carefully deoxy-
genated by purging with argon before the experiment, and
the same amount of sodium dithionite was added to each
syringe to have always a constant final dithionite concen-
tration of 1.7 m
M
. This dithionite concentration guaranteed
that P450 remained reduced during the stopped-flow
experiment. The CO containing solution was prepared by
adding an appropriate volume of a CO saturated buffer
stock solution to the syringe. The CO stock buffer solution
is % 1m
M
at 20 °C calculated by the Henry’s law [15].
Because the binding kinetics strongly differ for the different
substrate complexes the final CO concentration has to be
varied to stay in a time window which can be resolved by the
stopped-flow-spectrometer. All stopped-flow experiments
were carried out between 3.8 °Cand5.6°C. The tempera-
ture was stable during the experiment (± 0.2 °). After each
stopped-flow experiment the recovered protein solution was
checked for possible P420 formation using the CO differ-
ence spectrum. There was no spectral difference to the
solution at the beginning indicating that P420 was not
formed during the high-pressure stopped-flow experiment.
The high-pressure stopped-flow apparatus used is inter-
faced with the Aminco DW2 spectrometer and is described
in [10,11]. All kinetic traces were recorded in the dual-
wavelength mode of the Aminco using the wavelength of
the maximum at k
1
¼ 446 nm and the minimum at k
2
¼
406 nm.
We have previously found for P450s that the observed
rate constant for the CO binding is linearly related to the
CO concentration indicating bimolecular binding kinetics
[11,16]. To get the k
on
rate constants the time curves for the
absorbance difference DA(t) were fitted with bimolecular
kinetics as described recently [5] (Eqn 1).
[P450]
0
, [P450CO]
1
,[CO]
0
, e,andl are the initial P450
concentration, the final P450-CO concentration, the initial
CO concentration, the extinction coefficient at 446 nm, and
the optical pathlength, respectively. eÆl, [P450CO]
1
,and
k
on,i
were used as fit parameters. The subscript letter i
indicates the first or second phase in case of two-phase
kinetics (see below).
Fig. 1. Structure of the active site of cytochrome P450cam and of
camphor analogues. Top, heme and amino acids contacting the sub-
strate 1R-camphor, PDB accession no. 3cpp; bottom, substrate ana-
logues used in the high-pressure stopped-flow study.
DA
i
ðtÞ¼e Á ‘ Á
"
P450½
0
exp k
on;i
Á t Áð½CO
0
À½P450
0
Þ
ÂÃ
À 1
exp k
on;i
Á t Áð½CO
0
À½P450
0
Þ
ÂÃ
À
½P450
0
½CO
0
À½P450CO
1
#
ð1Þ
2990 C. Jung et al.(Eur. J. Biochem. 269) Ó FEBS 2002
Three shots at each pressure were taken and fitted. The
k
on
values for the same pressure were averaged. The
averaged values were used for further analysis to get
the activation volumes DV
#
according to Eqn. 2.
@ ln k
on
@P
T
¼À
DV
#
RT
;
@ ln K
@P
T
¼À
DV
RT
ð2Þ
For the camphane complex and the substrate-free
complex two bimolecular processes were required to get a
reasonable fit indicating subconformer equilibrium. We
used a linear combination as the simplest approximation
(Eqn 3). The fraction w for one phase is used to estimate the
equilibrium constant K ¼ w/(1–w) for the subconformer
equilibrium. The reaction volume DV between the subcon-
former is calculated according to Eqn. 2.
DAðtÞ¼w Á DA
1
ðtÞþð1 À wÞÁDA
2
ðtÞð3Þ
RESULTS
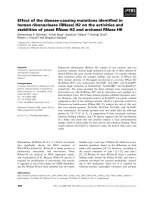
Figure 2 shows the typical time traces obtained from the
stopped-flow measurements. There is a delay time of 0.622 s
after the trigger signal was initiated and before the two
volumes with the enzyme and the CO are mixed. At the
lowest absorbance the time is set to zero for fitting. The data
for the different substrate complexes show that the binding
rate can decrease or increase with increasing pressure. As an
example, Fig. 2 demonstrates the results for 1R-camphor,
where the rate increases with pressure, and for norbornane,
where the rate decreases with pressure. The bimolecular rate
constants given in Fig. 2 are obtained by nonlinear least-
square fitting the time curves using a single bimolecular
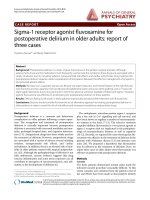
process according to Eqn (1). Figure 3 shows the plot of the
logarithm of the rate constant vs. the pressure which is linear.
The activation volume, obtained from the slope of this linear
dependence, is strongly negative by % )19.6 cm
3
Æmol
)1
for
the CO binding in the 1R-camphor-bound P450cam. In
contrast, the activation volumes are positive for the norcam-
phor-bound as well as for the norbornane-bound proteins
(% +8 cm
3
Æmol
)1
for both, Table 1). While the CO binding
in 1R-camphor-bound P450cam is very slow (k
on
% 3 ·
10
4
M
)1
Æs
)1
) the rate is significantly increased for both of the
other substrates (k
on
% 381 · 10
4
M
)1
Æs
)1
, norcamphor and
k
on
% 332 · 10
4
M
)1
Æs
)1
, norbornane).
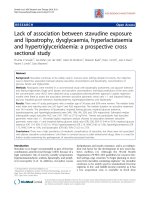
In contrast to P450cam bound with 1R-camphor, nor-
camphor and norbornane, the time curves for substrate-free
P450cam and P450cam bound with camphane could not be
fitted satisfactorily with only one bimolecular process.
Figure 4 shows the data for the camphane complex as an
example. As the simplest approximation we used a linear
combination of two bimolecular processes to fit the curves.
At 1 bar the fractions of the slow and the fast phases are
approximately equal. For the camphane complex the
fraction of the slow phase is almost constant up to 1150
bar (52–55%) but increases to 75% at further pressure
elevation up to 1380 bar (Fig. 5, Table 1). The activation
volumes DV
#
for both binding phases are negative. The
absolute value of DV
#
for the fast phase is approxi-
mately twice that of the slow phase ()18.2 cm
3
Æmol
)1
vs.
)10.6 cm
3
Æmol
)1
, Table 1). In the pressure range higher
than 1150 bar, the activation volumes become even more
negative (Table 1).
For substrate-free P450cam the fraction w of the fast phase
gradually increases from % 54% at 1 bar to %65% at 1000
bar. The plot of ln(w/(1 ) w)), which corresponds to the
logarithm of the equilibrium constant between the fast phase
conformer to the slow-phase conformer, vs. the pressure,
allows the estimation of the reaction volume DV ¼ V
fast
)
V
slow
to be approximately +11 cm
3
Æmol
)1
(Fig. 6). The
activation volumes, DV
#
are positive in both phases
(10.4 cm
3
Æmol
)1
for the fast phase and % 4.7 cm
3
Æmol
)1
for
the slow phase; Table 1, Fig. 6). The binding rate constants
for both phases in substrate-free P450cam are significantly
higher (k
on,slow
% 29.5 · 10
4
M
)1
Æs
)1
and k
on,fast
% 297 ·
10
4
M
)1
Æs
)1
) compared to the respective values for camphane
(k
on,slow
% 1.6 · 10
4
M
)1
Æs
)1
and k
on,fast
% 7.8 · 10
4
M
)1
Æs
)1
)
andalsofor1R-camphor (k
on
$ 3 · 10
4
M
)1
Æs
)1
). In com-
parison to the other substrate complexes which also have
positive activation volumes (norcamphor, norbornane), the
rate constant for the fast phase in substrate-free P450cam is
similar or slightly lower, while for the slow phase it is
approximately 10 times smaller (Table 1).
DISCUSSION
The high-pressure stopped-flow study on the CO binding in
cytochrome P450cam revealed two important results: (a)
The substrate complexes studied can be divided into two
Fig. 2. Time-dependent absorbance change at
446 nm recorded at low and high pressure in the
stopped-flow experiment on cytochrome
P450cam bound with two different substrates.
Bottom, 1R-camphor; top, norbornane. The
curves for norbornane were offset for better
view. The rate constants k
on
are obtained by
fitting the curves with a bimolecular kinetics as
described in Materials and methods. The k
on
mean values are given with their ± SD.
Experimental conditions are summarized in
Table 1.
Ó FEBS 2002 High-pressure stopped-flow for P450 CO binding (Eur. J. Biochem. 269) 2991
groups. The one group is characterized by a positive
activation volume and a fast CO binding (substrate-free,
norcamphor and norbornane). The other group shows a
negative activation volume and slow CO binding kinetics
(1R-camphor and camphane). (b) There are two complexes
which show two-phase CO binding kinetics (substrate-free,
camphane). In the following both these findings will be
discussed.
The presence of methyl groups in the substrate changes
the rate-determining step for CO binding
Unno et al. [13] reported CO flash photolysis experiments
under high pressure on cytochrome P450cam bound with
various camphor analogues and on the substrate-free
protein. They found that 1R-camphor, fenchone, 3-endo-
bromocamphor and 3,3,5,5-tetramethylcyclohexanone
show negative activation volumes and slow rebinding
kinetics while the substrates norcamphor and adamantane
and the substrate-free protein have positive activation
volumes and fast rebinding kinetics. Stopped-flow and flash
photolysis studies should give comparable results at normal
temperatures (> 5 °C). Indeed, our data confirm qualita-
tively the finding by Unno et al. although other camphor
analogues except norcamphor have been used. Combining
the data from the flash photolysis and the stopped-flow
studies, we sort the substrate analogues into two classes:
classI(negativeDV
#
,smallk
on
:1R-camphor, camphane,
fenchone, 3-endo-bromocamphor and 3,3,5,5-tetramethyl-
cyclohexanone) and class II (positive DV
#
, large k
on
:
norcamphor, norbornane and adamantane and the sub-
strate-free protein). All class I substrates possess methyl
groups while class II substrates do not. We conclude that the
methyl groups present in the substrate are the relevant
structural entities which modulate significantly the CO
binding properties of P450cam. The crystal structure for
1R-camphor-bound protein [17] shows that 1R-camphor is
held in an optimal orientation by (a) the hydrogen bond
Table 1. Activation volume DV
#
and binding rate constant k
on
for the CO binding in cytochrome P450cam bound with different substrates obtained from stopped-flow measurements as function of the hydrostatic
pressure monitored at the Soret band.
Experimental conditions
a
k
on
b
DV
#b
Substrate
High-spin
(%at20°C)
P450cam
(l
M
)
Substrate
(l
M
)
CO
(l
M
)
T
°C Pressure(bar)
Slow phase
(10
4
M
)1
Æs
)1
)
Fast phase
(10
4
M
)1
Æs
)1
)
Pressure range
(bar)
Slow phase
(cm
3
Æmol
)1
)
Fast phase
(cm
3
Æmol
)1
)
Substrate-free 5.1 3.05 – 20 5.0 1 29.50 ± 0.70 (46%) 297 ± 7 (54%) 35–1140 4.6 ± 2.0 10.2 ± 2.1
Norcamphor 41.1 2.94 4000 10 4.5 1 – 381 ± 43 (100%) 206–1214 – 7.6 ± 2.0
Norbornane 69.9 3.18 2000 5 3.8 1 – 332 ± 14 (100%) 208–1418 – 8.4 ± 0.8
Camphane 91.8 2.68 400 50 4.8 1
1150
1380
1.60 ± 0.02 (52%)
2.50 ± 0.04 (55%)
6.00 ± 0.10 (75%)
7.8 ± 0.1 (48%)
24.2 ± 0.4 (45%)
117.9 ± 1.8 (25%)
11–1150
1150–1490
)10.6 ± 1.1
)53.1 ± 21.9
)18.2 ± 3.8
)138.8 ± 27.8
1R-Camphor 96.5 2.80 400 50 5.6
20.0
1
1
3.00 ± 0.03 (100%)
2.95 ± 0.04 (100%)
–
–
14–1515
4–1311
)19.6 ± 0.9
)13.2 ± 0.8
–
–
a
100m
M
potassium phosphate buffer, pH 7.3, 10% (w/w) glycerol, substrate dissociation constants [3]: norcamphor (345 l
M
), norbornane (47 l
M
), camphane (1.1 l
M
), 1R-camphor (0.8 l
M
), 1.7 m
M
sodium dithionite, values for concentrations correspond to the mixture.
b
The mean values for k
on
and DV
#
are given with their ± SD.
Fig. 3. Plot of lnk
on
against the pressure for cytochrome P450cam
bound with different substrates. The experimental conditions are given in
Table 1. r
2
is the regression coefficient for the linear regression ana-
lysis: 1R-camphor (0.97); norcamphor (0.71) and norbornane (0.93).
2992 C. Jung et al.(Eur. J. Biochem. 269) Ó FEBS 2002
between its keto group and the hydroxyl group of the
amino-acid residue Tyr-96, and (b) by hydrophobic contacts
of its methyl groups C-8, C-9 to Val295 and Asp297 in the
b
3
sheet, and of the methyl group C-10 to Val247 in the
I helix and Thr185 in the F helix (Fig. 1). Disturbing these
interactions leads to a higher substrate mobility and acces-
sibility of the heme pocket for water molecules [5–9,18,19
1
].
We have recently found for the same homologous series
of camphor analogues used for this stopped-flow study that
the amount of high-spin state content which can be trapped
by a negative temperature jump (fast freezing) from 297 K
to 77 K depends strongly on the presence of substrate
methyl groups and correlates with the initial high-spin state
content at 297 K [3]. The slope of the loss of the high-spin-
state content DHS with the temperature change DT (from
297 K to 77 K within 10 min) represents a water influx rate
for the heme pocket. The inverse value of the water influx
rate has been defined in [3] as rigidity factor. As seen in
Table 2 the water influx rate is clearly smaller for substrate
complexes with negative activation volume for CO binding
(camphor and camphane) compared to those substrate
complexes with positive activation volumes (norcamphor,
norbornane). In addition, the resulting CO complex has a
smaller compressibility for substrates causing a negative
activation volume compared to those with positive activa-
tion volume (Table 2).
It has been discussed in various papers [12,13,23] that a
positive activation volume indicates that the entry of CO
into the protein is the rate-limiting step of CO binding. In
contrast, a negative activation volume points to the Fe-CO
bond formation as the rate-limiting step. However, the
Fe-CO bond formation step itself (geminate binding) is very
fast and independent of CO concentration [24] if the CO
molecule has found the optimal place close to the iron. It is
Fig. 6. Plot of lnk
on
against the pressure for substrate-free cytochrome
P450cam. Inset: logarithm of the equilibrium constant K ¼ w/(1 ) w)
with w being the fraction of the fast phase. The activation volume DV
#
(10.9 ± 0.8 cm
3
Æmol
)1
) is obtained from the slope of the linear fit. r
2
is
the regression coefficient for the linear regression analysis: slow phase
(0.37, this slow regression coefficient is caused essentially by the
extreme points around 35 bar and 300 bar); fast phase (0.71).
Fig. 5. Plot of lnk
on
against the pressure for cytochrome P450cam
bound with camphane. Inset: fraction of the slow phase. r
2
is the
regression coefficient for the linear regression analysis: slow phase (0.92
for P < 1200 bar, 0.75 for P > 1200 bar); fast phase (0.72 for
P < 1000 bar, 0.93 for P > 1000 bar).
Fig. 4. Time-dependent absorbance change
at 446 nm recorded in the stopped-flow experi-
ment on cytochrome P450cam bound with
camphane. The experimental curve is fitted
with a single and with two bimolecular bind-
ing processes according to Eqns (1) and (2).
Only two processes fit the experimental curve
well. Experimental conditions are summarized
in Table 1.
Ó FEBS 2002 High-pressure stopped-flow for P450 CO binding (Eur. J. Biochem. 269) 2993
the probability of finding this optimal place which causes
the rate limitation. This suggestion can be explained for
P450cam using the values for the activation enthalpy DH
on
#
and activation entropy DS
on
#
of CO binding in substrate-free
and 1R-camphor-bound P450cam determined from flash
photolysis studies by Kato et al.[25].DH
on
#
is 31.8 kJÆmol
)1
for camphor-bound P450cam. This value is increased to
61.9 kJÆmol
)1
in substrate-free protein. The activation
enthalpy may be written as DH
on
#
¼ DE
on
#
+ PÆDV
#
[15]
where DE
on
#
is the internal energy of activation which may be
assigned to the energy needed to break bonds or other
contacts (e.g. hydrogen bonds) or to induce a conformational
change accompanied with forming the transition state for
CO binding. PÆDV
#
is the volume work which has to be
applied to the system for CO binding. The energetic
contribution of this volume work to DH
on
#
is, however,
negligibly small ()0.0019 kJÆmol
)1
for camphor-bound;
+0.00046 kJÆmol
)1
and +0.000102 kJÆmol
)1
for substrate-
free P450cam at 1 bar using the activation volumes from
Table 1). The larger value for DH
on
#
in substrate-free
P450cam indicates therefore that stronger bonds or more
bonds have to be broken during CO binding which let
one expect a slower binding rate compared to camphor-
bound P450cam. However, DS
on
#
is )43.6 JÆK
)1
Æmol
)1
for
camphor-bound and +98.7 JÆK
)1
Æmol
)1
for substrate-free
P450cam. The energetic contribution of the entropic
term (–TÆDS)at5°C to the free enthalpy of activation DG
on
#
is 12.13 kJÆmol
)1
and )27.45 kJÆmol
)1
for camphor-bound
and substrate-free P450cam, respectively. Therefore, DG
on
#
for substrate-free P450cam is lower (34.44 kJÆmol
)1
)than
DG
on
#
for camphor-bound P450cam (43.93 kJÆmol
)1
)mean-
ing that k
on
(free) > k
on
(bound). Thus, the entropic part is the
major contribution which makes CO binding in substrate-
free P450cam faster than in the presence of camphor [23]. The
large positive activation entropy in substrate-free P450cam
may indicate that the CO molecule travels along many
pathways to the heme iron. Along each pathway, however,
many contacts (e.g. contacts to many water molecules) have
to be broken, reflected in the large positive activation
enthalpy. The higher flexibility, respective stronger compres-
sibility (Table 2) of the structure in substrate-free P450cam is
in agreement with this view.
In contrast, in the presence of camphor the activation state
is highly ordered as seen by the negative activation entropy.
Camphor makes the protein and the heme pocket more rigid
(smaller compressibility, Table 2) and the CO molecule has
few or even only one pathway to approach the heme iron
where it immediately sticks in the right position for bond
formation leading to volume contraction (negative activa-
tion volume). Along each of these few pathways obviously
only a small number of contacts are necessary to cleave (low
positive value for DH
on
#
, e.g. because less water molecules are
present). In conclusion, CO binding in camphor-bound
P450cam is statistically disfavoured and therefore slow.
Table 2. Comparison of k
on
and DV
#
for the CO binding in cytochrome P450cam bound with class I and II substrates obtained from stopped-flow
(SF, Table 1), flash photolysis (F [13]), and FTIR-flash photolysis (F-FTIR [5]), studies.
Substrate Method
T
(°C)
k
on
(10
4
M
)1
Æs
)1
)
DV
#
(cm
3
Æmol
)1
)
Water influx
rate DHS%/
(KÆ10 min) [3]
b
a
(GPa
)1
) [7]
Class I
1R-Camphor SF 5.6 3.0 )19.6 0.147 0.00713
SF 20.0 2.95 )13.2
F 20.0 10.0 )31.0
F-FTIR
b
26.8 9.8 (1939.1 cm
)1
)–
Camphane SF 4.8 1.6 (52%) & 7.8 (48%) )10.6 & )18.2 0.302 0.00638
F-FTIR
b
26.8 10.4 (61%; 1939.4 cm
)1
)
& 49.7 (25%; 1949.2 cm
)1
)
–
Bromocamphor F 20.0 55 )32.0 – 0.00981
TMCH F 20.0 75 )14.0 – –
Fenchone F 20.0 150 )20.0 – 0.01271
Class II
Substrate-free SF 5.0 29.5 (46%) & 297 (54%) 4.6 & 10.2 – 0.01228
F 20.0 850 4
F-FTIR
b
26.8 158.1 (54%; 1941.1 cm
)1
)
& 132.5 (8%; 1951.9 cm
)1
)
& 381.3 (31%; 1960.1 cm
)1
)
–
Norbornane SF 3.8 332 8.4 0.538 –
F-FTIR
b
26.8 343.8 (1953.3 cm
)1
)–
Norcamphor SF 4.5 381 7.6 0.571 0.01445
F 20.0 1000 3.0
F-FTIR
b
26.8 340.8 (1946.1 cm
)1
)–
Adamantane F 20.0 1300 7.0 – 0.0113
a
b is the isothermal compressibility determined from the following equation using the absolute value for the slope of the linear pressure-
induced red-shift of the Soret band maximum m in P450cam-CO. m
0
is the Soret band maximum extrapolated to 1 bar using the regression
parameters for the particular substrate complex given in [7]. const has been assumed to be equal to 1. b ¼À
1
V
½
@V
@P
T
const: Á
1
m
o
½
@m
@P
T
;
b
The
values in parantheses give the percentage population and the CO stretch mode frequency of the substate. The FTIR data are obtained for a
D
2
O buffer solution [5].
2994 C. Jung et al.(Eur. J. Biochem. 269) Ó FEBS 2002
Extending this conclusion to all the other substrate
complexes of P450cam studied, we note that for the class I
substrates CO binding is disfavoured because of a rigid
heme pocket and the search for the optimal place near the
heme for CO-iron bond formation appears to be rate-
limiting. In contrast, the CO entry into the protein and the
CO migration through the protein to the heme iron favours
statistically CO binding for class II substrates. The lack of
methyl groups in the substrate and the higher substrate
mobility and water accessibility are the relevant structural
parameters which allow that another step besides diffusion
becomes rate-determining when going from the Ôhypothet-
icalÕ protein-free heme to the protein. This step is purely
entropically driven. The positive activation volume in P450
is therefore indicative rather for a high solvent accessibility
of the heme pocket than for a diffusion limited process.
Subconformers of P450cam have different
k
on
and D
V
#
for CO binding
The CO binding time traces for substrate-free and cam-
phane-bound P450cam had to be fitted with two processes.
Biphasic kinetics were also observed for substrate-free
P450cam in the flash photolysis study under pressure by
Unno et al. [13]. At a first glance one could suppose that
cytochrome P420 was formed during the experiment as
discussed by Unno et al. However, in our studies the
spectral analysis before and after the stopped-flow experi-
ments as well as a spectral comparison with the substrate
complexes with mono-phase behaviour clearly excludes this
possibility (data not shown). Because biphasic kinetics are
observed already at ambient pressure we conclude that
rather an equilibrium of subconformers with different CO
binding behaviour exists than a pressure dependence of the
activation volume for the pressure range lower than % 1100
bar. Indeed, conformational substates in P450cam have
been observed and extensively studied by FTIR using the
CO stretch vibration mode as spectroscopic probe [6,8,9,
14,26]. Many of the substrate complexes of P450cam-CO
studied reveal conformational substates at low temperatures
(< 160 K). At room temperature however, the transitions
between substates become rather fast resulting in an
averaged CO stretch infrared band or in shift of the
equilibrium to only one substate. Many of the substrate
complexes appear therefore as a single substate at room
temperature [9] (e.g. 1R-camphor, norcamphor, norborn-
ane). In contrast, the infrared spectra of substrate-free and
camphane-bound P450cam-CO are an overlap of several
subconformer bands even at room temperature which can
be merged into two main subconformer ensembles [sub-
strate-free: at % 1940 cm
)1
(% 60%) and % 1952–1963 cm
)1
(% 40%) and camphane: at % 1941 cm
)1
(% 60%) and
1955–1962 cm
)1
(% 40%)] [6,9]. This subconformer beha-
viour could explain the biphasic CO binding kinetics
observed in our stopped-flow studies. The fractions of slow
and fast phases match approximately the population of the
main subconformer ensembles in both P450 complexes.
Because the activation volumes for both phases in substrate-
free, respective camphane-bound, P450cam are qualitatively
similar (positive for substrate-free and negative for cam-
phane) we exclude that one of the two phases in the
camphane complex is caused by a fraction of P450 that has
not bound camphane. Recently, we have found by CO flash
photolysis time-resolved FTIR studies [5] that the subcon-
formers have different CO rebinding rate constants. This
finding agrees with the observation in the present stopped-
flow study. Within the same P450 complex the subcon-
formers with the higher CO stretching mode frequency
generally rebind faster (Table 2).
In addition, in substrate-free P450cam-CO the popula-
tion and the CO stretching mode frequency shift of the
subconformers with higher CO stretch frequencies show an
inverse behaviour on changes of hydrostatic and osmotic
pressure [6]. This indicates that the CO ligand in these
subconformers is more influenced by the solvent, which is in
line with the higher positive activation volume for the fast
phase compared to the slow phase of the CO binding curves
obtained in the stopped-flow experiments (Table 1). In the
static pressure dependence study [6] the population of the
subconformer with the higher CO stretching mode fre-
quency increases by % 11% with increasing pressure (from
% 62% at 1 bar to % 73% at 1600 bar) and the reaction
volume is in the order of 9 cm
3
Æmol
)1
. In the present
stopped-flow experiment we found that the fraction w of the
fast phase increases by % 11% (from % 54% at 1 bar to
% 65% at 1000 bar) which may reflect a pressure-induced
shift of the subconformer equilibrium to a higher-frequency
(faster CO binding) subconformer. The reaction volume
(DV ¼ V
fast
) V
slow
) obtained from the plot of ln(w/(1 ) w))
vs. pressure is approximately +11 cm
3
Æmol
)1
and seems to
be in reasonable agreement with the value of the static high-
pressure study.
In contrast to substrate-free protein, the fast phase in
stopped-flow CO binding kinetics of the camphane com-
plex, which we assign to the fast rebinding in the FTIR flash
photolysis experiment and to the higher-frequency CO
stretching mode, shows a more negative activation volume
()18.2 cm
3
Æmol
)1
) than the slow phase ()10.6 cm
3
Æmol
)1
).
This behaviour is different to substrate-free P450cam. This
might indicate that the subconformers in the camphane
complex do not originate from different solvent accessibility
but for example from different orientations of the substrate
itself within the heme pocket. The strong increase of the
negative value of the activation volume at pressures higher
than % 1100 bar (Fig. 5) might indicate that the volume
is actually pressure dependent or the compressibility is
changed, for example, due to substrate rearrangement in the
heme pocket.
Summarizing the outcome of the present high-pressure
stopped-flow study under consideration of the different
flash photolysis studies and diverse other studies on
P450cam we suggest that the accessibility of the protein
for water molecules is a relevant property which is
modulated by substrate binding. The positive sign of the
activation volume for CO binding is rather indicative for
solvent accessibility and flexibility of the protein than for
diffusion-controlled CO binding or for a specific electronic
structure of the thiolate proximal ligand compared to the
imidazole proximal ligand as earlier assumed [11]. Con-
cerning the functional significance one may conclude at least
for the camphor-hydroxylating cytochrome P450cam sys-
tem that a suboptimal fit of the substrate in the heme pocket
increases the mobility of the substrate, facilitates the access
for water molecules and makes the heme pocket more
compressible. Under these conditions the tight structural
coupling for a specific proton transfer is disturbed which
Ó FEBS 2002 High-pressure stopped-flow for P450 CO binding (Eur. J. Biochem. 269) 2995
may favour the formation of hydrogen peroxide or of water
in the oxidase reaction over the substrate hydroxylation
[26,27]. For example, with 1R-camphor only % 3–7% of the
consumed dioxygen is released as hydrogen peroxide while
with norcamphor 20–40% of H
2
O
2
is formed [26,28]. Both
substrate P450cam complexes show monophasic CO bind-
ing but with different sign of the activation volume (negative
for camphor and positive for norcamphor).
ACKNOWLEDGEMENTS
We thank Dieter Schwarz for critical reading of the manuscript.
Financial support from the Deutsche Forschungsgemeinschaft (Sk35/
3–1,2,4), the Institut National de la Sante
´
et de la Recherche Me
´
dicale
and the Deutscher Akademischer Austauschdienst in the frame of the
PROCOPE programme (312/pro-ms) is acknowledged.
REFERENCES
1. Lewis, D.F.V. (1996) Cytochromes P450 ) Structure, Function and
Mechanism. Taylor & Francis Ltd, London.
2. Bast, A. (1986) Is formation of reactive oxygen by cytochrome
P-450 perilous and predictable? Trends Pharm. Sci. 7, 266–270.
3.Schulze,H.,HuiBonHoa,G.&Jung,C.(1997)Mobilityof
norbornane-type substrates and water accessibility in cytochrome
P-450cam. Biochim. Biophys. Acta 1338, 77–92.
4. Jung, C., Ristau, O. & Rein, H. (1991) The high-spin/low-spin
equilibrium in cytochrome P-450 – a new method for determin-
ation of the high-spin content. Biochim. Biophys. Acta 1076,
130–136.
5. Contzen, J. & Jung, C. (1998) Step-scan time-resolved FTIR
spectroscopy of cytochrome P-450cam carbon monoxide complex:
asaltlinkinvolvedintheligandrebindingprocess.Biochemistry
37, 4317–4324.
6. Jung, C., Ristau, O., Schulze, H. & Sligar, S.G. (1996) The CO
stretching mode infrared spectrum of substrate-free cytochrome
P-450cam-CO: effect of solvent conditions, temperature, and
pressure. Eur. J. Biochem. 235, 660–669.
7. Jung, C., Hui Bon Hoa, G., Davydov, D., Gill, E. & Heremans, K.
(1995) Compressibility of the heme pocket of substrate
analogue complexes of cytochrome P-450cam-CO: The effect
of hydrostatic pressure on the Soret band. Eur. J. Biochem. 233,
600–606.
8. Schulze, H., Ristau, O. & Jung, C. (1994) The carbon monoxide
stretching modes in camphor-bound cytochrome P450cam – the
effect of solvent conditions, temperature, and pressure. Eur.
J. Biochem. 224, 1047–1055.
9. Jung, C., Schulze, H. & Deprez, E. (1996) The role of the polarity
of the heme environment for the CO stretch modes in cytochrome
P-450cam-CO. Biochemistry 35, 15088–15094.
10. Balny, C., Saldana, J.L. & Dahan, N. (1984) High pressure
stopped flow spectrometry at low temperature. Anal. Biochem.
139, 178–189.
11. Lange, R., Heiber-Langer, I., Bonfils, C., Fabre, I., Negishi, M. &
Balny, C. (1994) Activation volume and energetic properties of the
binding of CO to hemeproteins. Biophys. J. 66, 89–98.
12. Taube, D.J., Projahn, H D., van Eldik, R., Magde, D. &
Traylor, T.G. (1990) Mechansim of ligand binding to heme and
hemeproteins. High-pressure study. J. Am. Chem. Soc. 112, 6880–
6886.
13. Unno, M., Ishimori, K., Ishimura, Y. & Morishima, I. (1994)
High-pressure flash photolysis study of heme proteins: effect of
substrate analogues on the recombination of carbon monoxide to
cytochrome P450
CAM
. Biochemistry 33, 9762–9768.
14.Jung,C.,HuiBonHoa,G.,Schro
¨
der, K L., Simon, M. &
Doucet, J.P. (1992) Substrate analogue induced changes of the
CO-stretching mode in cytochrome P-450cam carbon monoxide
complex. Biochemistry 31, 12855–12862.
15. Atkins, P.W. (1986) Physical Chemistry, 3nd edn. Oxford Uni-
versity Press, Oxford, UK.
16. Contzen, J., Ristau, O. & Jung, C. (1996) Time-resolved Fourier-
transform infrared studies of the cytochrome P-450cam carbon-
monoxide complex bound with (1R)-camphor and (1S)-camphor.
FEBS Lett. 383, 13–17.
17. Poulos, T.L., Finzel, B.C. & Howard, A.J. (1987) High-resolution
crystal structure of cytochrome P450
cam
. J. Mol. Biol. 195,
687–700.
18. Atkins, W.M. & Sligar, S.G. (1989) Molecular Recognition in
cytochrome P-450: alteration of regioselective alkane hydroxyla-
tion via protein engineering. J. Am. Chem. Soc. 111, 2715–2717.
19. Das, B., Helms, V., Lounnas, V. & Wade, R.C. (2000) Multicopy
molecular dynamics simulations suggest how to reconcile
crystallographic and product formation data for camphor enan-
tiomers bound to cytochrome P450cam. J. Inorg. Biochem. 81,
121–131.
20. Hasinoff, B.B. (1974) Kinetic activation volumes of the binding of
oxygen and carbon monoxide to hemoglobin and myoglobin
studied on a high-pressure flash photolysis apparatus. Biochemis-
try 13, 3111–3117.
21. Caldin, E.F. & Hasinoff, B.B. (1975) Diffusion-controlled kinetics
in the reaction of ferroprotoporphyrin IX with carbon monoxide.
J. Chem. Soc. Faraday Trans. I 71, 515–527.
22. Traylor, T.G., Magde, D., Taube, D.J., Jongeward, K.A.,
Bandyopadhyay, D., Luo, J. & Walda, K.N. (1992) Geminate
recombination of carbon monoxide complexes of heme and heme
proteins. J. Am. Chem. Soc. 114, 417–429.
23. Stochel, G. & van Eldik, R. (1999) Elucidation of inorganic
reaction mechanisms through volume profile analysis. Coord.
Chem. Rev. 187, 329–374.
24. Te
´
treau,C.,DiPrimo,C.,Lange,R.,Tourbez,H.&Lavalette,D.
(1997) Dynamics of carbon monoxide binding with cytochromes
P450. Biochemistry 36, 10262–10275.
25. Kato, M., Makino, R. & Iizuka, T. (1995) Thermodynamic
aspects of the CO-binding reaction to cytochrome P-450cam.
Relevance with their biological significance and structure. Bio-
chim. Biophys. Acta 1246, 179–184.
26. Jung, C. (2000) Insight into protein structure and protein-ligand
recognition by Fourier transform infrared spectroscopy. J. Mol.
Recognition 13, 325–351.
27. Vidakovic, M., Sligar, S.G., Li, H. & Poulos, T.L. (1998)
Understanding the role of the essential Asp251 in cytochrome
P450cam using site-directed mutagenesis, crystallography, and
kinetic solvent isotope effect. Biochemistry 37, 9211–9219.
28. Atkins, W.A. & Sligar, S.G. (1988) Deuterium isotope effects in
norcamphor metabolism by cytochrome P-450cam: Kinetic evi-
dence for the two-electron reduction of a high-valent iron-oxo
intermediate. Biochemistry 27, 1610–1616.
2996 C. Jung et al.(Eur. J. Biochem. 269) Ó FEBS 2002