MICRO-ELECTRO-MECHANICAL- SYSTEMS (MEMS) AND FLUID FLOWS pptx
Bạn đang xem bản rút gọn của tài liệu. Xem và tải ngay bản đầy đủ của tài liệu tại đây (1.07 MB, 37 trang )
P1: SKH/ary P2: ARK/MBL/dat QC: NBL/abe T1: NBL
November 24, 1997 11:46 Annual Reviews AR049-19
Annu. Rev. Fluid Mech. 1998. 30:579–612
Copyright
c
1998 by Annual Reviews Inc. All rights reserved
MICRO-ELECTRO-MECHANICAL-
SYSTEMS (MEMS) AND FLUID
FLOWS
Chih-Ming Ho
Mechanical and Aerospace Engineering Department, University of California at Los
Angeles, Los Angeles, California 90095; e-mail:
Yu-Chong Tai
Electrical Engineering Department, California Institute of Technology, Pasadena,
California 91125; e-mail:
KEY WORDS: flow control, MEMS, micro transducers, size effect, surface force
ABSTRACT
The micromachining technology that emerged in the late 1980s can provide
micron-sized sensors and actuators. These micro transducers are able to be inte-
grated with signal conditioning and processing circuitry to form micro-electro-
mechanical-systems (MEMS) that can performreal-timedistributed control. This
capability opens up a new territory for flow control research. On the other hand,
surface effects dominate the fluid flowing through these miniature mechanical
devices because of the large surface-to-volume ratio in micron-scale configura-
tions. We needtoreexaminethesurfaceforcesinthemomentumequation. Owing
to their smallness, gas flows experience large Knudsen numbers, and therefore
boundary conditions need to be modified. Besides being an enabling technology,
MEMS also provide many challenges for fundamental flow-science research.
1. INTRODUCTION
During the past decade, micromachining technology has become available to
fabricate micron-sized mechanical parts. Micromachines have had a major
impact on many disciplines (e.g. biology, medicine, optics, aerospace, and
mechanical and electrical engineering). In this article, we limit our discussion
to transport phenomena, specifically emphasizing fluid-dynamics issues. This
579
0066-4189/98/0115-0579$08.00
Annu. Rev. Fluid. Mech. 1998.30:579-612. Downloaded from arjournals.annualreviews.org
by CALIFORNIA INSTITUTE OF TECHNOLOGY on 09/08/05. For personal use only.
P1: SKH/ary P2: ARK/MBL/dat QC: NBL/abe T1: NBL
November 24, 1997 11:46 Annual Reviews AR049-19
580 HO & TAI
emerging field not only provides miniature transducers for sensing and actua-
tion in a domain that we could not examine in the past, but also allows us to
venture into a research area in which the surface effects dominate most of the
phenomena.
Figure 1 shows a scanning-electronic-microscope (SEM) picture of an elec-
trostatically driven motor (Fan et al 1988a). This device signifies the beginning
of the micromachine field. A comb structure (Tang et al 1989) derived from
the micro motor concept eventually evolved into the airbag sensor, which re-
duces the damage caused by automobile collisions and is used now on almost
all American-made cars. During the development of the micro motor, it was
found that the frictional force between the rotor and the substrate is a function
of the contact area. This result departs from the traditional frictional law (i.e.
f = µN), which says that the frictional force is linearly proportional to the
normal force, N, only. In the micro motor case, the surface forces between the
rotor and the substrate contribute to most of the frictional force. However, the
traditional frictional law describes situations with a dominating body force that
do not depend on the contact area. Deviations from the conventional wisdom
are commonly found in the micro world. This makes the micromachine field a
new technology as well as a new scientific frontier.
The micromachining process uses lithography to expose the designed photo-
resist patterns; the unwanted portion is then selectively etched away. These
proceduresaresimilartothose used in integratedcircuit(IC)fabricationbutwith
Figure 1 A micro motor (Fan et al 1988a). A piece of human hair is shown in front of the motor
to illustrate its minute size.
Annu. Rev. Fluid. Mech. 1998.30:579-612. Downloaded from arjournals.annualreviews.org
by CALIFORNIA INSTITUTE OF TECHNOLOGY on 09/08/05. For personal use only.
P1: SKH/ary P2: ARK/MBL/dat QC: NBL/abe T1: NBL
November 24, 1997 11:46 Annual Reviews AR049-19
MEMS & FLUID FLOWS 581
a difference: 3-D and freestanding structures are common features, because of
thenatureofmechanicalparts. Severalmanufacturingtechnologiessuchasbulk
micromachining, surface micromachining, and LIGA (acronym forthe German
phrase LIthographe, Galvanoformung, und Abformung) have been developed
to make various micromachines. A brief introduction of these technologies can
be found in a paper by Ho & Tai (1996). For detailed information, readers are
referred to Petersen 1982, Seidel 1987, and Ristic 1994.
Micromachines have several unique features. First, typical micromachined
transducersizesareontheorderof100microns,whichcanbeoneormoreorders
of magnitude smaller than traditional sensors and actuators. The drastic reduc-
tion in inertia resulting from these smaller sizes means a substantial increase in
the frequency response. Second, batch processing—which is characteristic of
IC fabrication—can be used to make many transducers for distributed sensing
and actuation over a wide area. This capability enables us to sense certain flow
characteristics in a 2-D domain and to perform control at the proper locations.
Potential application areasinclude the manipulationof separationovera smooth
contour or the reduction of surface shear stress in a turbulent boundary layer.
Third, micromachine manufacturing technology is derived from, although not
completely compatible with, IC fabrication so it is possible to integrate the IC
with micro transducers to provide logic capability. Integrated microelectronics
and micromachines constitute the micro-electro-mechanical-system (MEMS),
which can execute sense–decision–actuation on a monolithic level.
In biomedical applications, fluid transport is commonly required in drug
delivery and in chemical and DNA analyses. When dealing with flow in con-
figurations of microns or less, we have observed many unexpected phenomena
that are similar to the aforementioned experience of frictional force between
solid surfaces. Sir Eddington (1928) once said “We used to think that if we
know one, we know two, because one and one are two. We are finding that we
must learna great dealmore about‘and’.” Indeed, theflows in macro andmicro
configurations are not quite the same. The unique features in micromechanics
are perhaps the most intriguing ones for researchers in basic fluid mechanics.
We still have a great deal of difficulty in understanding these features, because
not much is known about the complex surface effects that play major roles in
these events. The search for their answers will excite researchers for years to
come. In this paper, we first report and discuss the fundamental micro-fluid-
mechanics issues and then review flow sensing and control using MEMS.
2. SIZE EFFECTS
2.1 Ratio Between Surface Force and Body Force
Length scale is a fundamental quantity that dictates the typeof forces governing
physical phenomena. Body forces are scaled to the third power of the length
Annu. Rev. Fluid. Mech. 1998.30:579-612. Downloaded from arjournals.annualreviews.org
by CALIFORNIA INSTITUTE OF TECHNOLOGY on 09/08/05. For personal use only.
P1: SKH/ary P2: ARK/MBL/dat QC: NBL/abe T1: NBL
November 24, 1997 11:46 Annual Reviews AR049-19
582 HO & TAI
scale. Surface forces depend on the first power or the second power of the
characteristic length. Because of the difference in slopes, the body force must
intersect with the surface force. In biological studies (Went 1968), empirical
observations indicated that a millimeter length is the approximate order of the
demarcation. Experiences gathered in MEMS also show that surface forces
dominate in sizes smaller than a millimeter. For example, the friction expe-
rienced by the 100-micron-diameter micro motor (Fan et al 1988a,b) must be
caused mainly by the surface force, because the rotor started to move when
the contact area between the rotor and the substrate was reduced by placing
dimples on the lower surface of the rotor.
2.2 Ratio Between Device and Intrinsic Length Scales
Besides the large surface force, the large surface-to-volume ratio is another
characteristic inherent in small devices. This ratio is typically inversely pro-
portional to the smaller length scale of the cross section of the device and is
about one micron in surface micromachined devices. Therefore, the surface-
to-volume ratio is much larger in a micro device than in a macro device,
which accentuates the role of surface force as well as other surface effects in
general.
In micro flows, the Reynolds number is typically very small and shows the
ratio between the viscous force and the inertial force. However, in the case
when gas is the working fluid, the size can be small enough to further modify
the viscous effect when the device length scale is on the order of the mean free
path. For large Knudsen-number flows, the flow velocity at the surface starts
to slip (Knudsen 1909, Kennard 1938); therefore, the viscous shear stress is
much reduced. For liquid flows, the distance between molecules is on the order
of angstroms. The non-slip condition has always been used as an empirical
result. By using a molecular dynamics approach (Koplik et al 1989, Koplik
& Banavar 1995), the non-slip condition at the solid surface is established in
Couette and Poiseuille liquid flows. On the other hand, molecular ordering has
been observed and results in oscillatory density profiles in the vicinity of the
wall, which are a few molecular spacings thick. In the case of a moving contact
line at the fluid/fluid/solid interface, the non-slip condition needs to be relaxed
(Dussan & Davis 1974). Typical micromachined devices have a length scale
much larger than the molecular spacing of simple liquids. Hence, the non-slip
boundary condition should hold in the absence of a moving contact line.
In other situations, the bulk flow instead of the boundary condition is mod-
ified. For example, most solid surfaces have electrostatic surface charges,
which can attract ions in liquid flows to form an electric double layer (EDL)
(see Section 3.2). The thickness of the EDL varies from a few nm to 100s of
nm (Hunter 1981), which can be comparable to the order of micro-flow length
Annu. Rev. Fluid. Mech. 1998.30:579-612. Downloaded from arjournals.annualreviews.org
by CALIFORNIA INSTITUTE OF TECHNOLOGY on 09/08/05. For personal use only.
P1: SKH/ary P2: ARK/MBL/dat QC: NBL/abe T1: NBL
November 24, 1997 11:46 Annual Reviews AR049-19
MEMS & FLUID FLOWS 583
scale. In these cases, the bulk flow can be affected by this electrically charged
layer (Mohiuddin Mala et al 1996).
3. SURFACE FORCES
For fluid flows in MEMS, new phenomena arise because of certain surface
forces that are usually ignored in macro scales. Here, a brief survey is given on
several kinds of surface forces (Israelachvili 1991). Before the discussion of
someseemingly differentsurfaceforces, itisimportant to knowthatthese forces
originate from intermolecular forces. Moreover, even though basic intermolec-
ular forcesare short range (<1 nm) in nature, they can cumulatively lead to very
long-range (>0.1 µm) effects (e.g. surface-tension effects in liquids). Another
important point is that all intermolecular forces are fundamentally electrostatic
(coulombic). This is established by the Hellman-Feynman theorem that states
that once the spatial electron distribution is determined from the Schr¨odinger
equation, all intermolecular forces can then be calculated using classical elec-
trostatics. However, in practice this cannot always be done, and empirical or
semiempirical laws of forces are still useful. In the following, we then treat
the following surface forces differently even though they are the same in origin
from the point of view of quantum mechanics.
3.1 Van der Waals Forces
The van der Waals forces are the weakest among all the forces, but they are
important because they are always present. The van der Waals forces are short
range in nature but, in cases where large molecules or surfaces are involved,
they can produce an effect longer than 0.1 µm. In general, van der Waals forces
have three parts: orientation force, induction force, and dispersion force. All
have an interaction free energy that varies with the inverse sixth power of the
distance (1/r
6
) and are, hence, short range. The orientation force is the dipole–
dipole interaction force between polar molecules. The induction force arises
from the interaction between a polar molecule and a nonpolar molecule. The
permanent dipole of the polar molecule induces a weak dipole in the nonpolar
molecule and then produces a dipole-induced dipole-interaction force. The
dispersion force is then the induced-dipole–induced-dipole interaction force.
Interestingly, the dispersion forces act on all atoms and molecules even when
they are totally neutral, as are those of helium and oxygen. The source of the
dispersion force between two nonpolar molecules is the following: Although
the averaged dipole moment of a nonpolar molecule is zero, at any instant there
exists a finite dipole moment depending on the exact position of the electrons
around its nucleus. This instantaneous dipole moment can then generate an
interaction force with nearby molecules.
Annu. Rev. Fluid. Mech. 1998.30:579-612. Downloaded from arjournals.annualreviews.org
by CALIFORNIA INSTITUTE OF TECHNOLOGY on 09/08/05. For personal use only.
P1: SKH/ary P2: ARK/MBL/dat QC: NBL/abe T1: NBL
November 24, 1997 11:46 Annual Reviews AR049-19
584 HO & TAI
Altogether, van derWaals forces play an important role inmany macroscopic
phenomena (e.g. adhesion, surface tension, physical adsorption, wetting of
surfaces, properties of thin films, and behaviors of condensed proteins and
polymers). In MEMS, the van der Waals forces can have significant effects in
structures with large surface-to-volume ratios (e.g. long and thin polysilicon
beams [Mastrangelo & Hsu 1992]) and large-and-thin comb-drive structures
[Tang et al 1989]) whenever they are in contact with another surface. Stiction
or adhesion of the structure to the substrate can often be observed as a major
problem in the operation of these structures. Nevertheless, the van der Waals
forces between two contacting surfaces are in many cases hard to be separately
distinguished from electrostatic (coulombic) forces, which are discussed in the
next section.
3.2 Electrostatic Forces
Electrostatic, or coulombic, force is present between charged molecules or par-
ticles. The force has an inverse-square dependence on the distance, 1/r
2
,soit
is rather long range when compared to the van der Waals forces. In MEMS
devices, the electrostatic force can have a significant effect even up to 10 µm
away and becomes more important when lengths are less than 0.1µm. One can
always produce an electrostatic force by providing an electrical potential differ-
ence between two electrodes. However, problems deriving from electrostatic
force in MEMS often occur because of rather uncontrollable surface-trapped
charges. In fact, any surface is likely to carry some charge, because of broken
bonds and surface charge traps. In the case where the surface is a good insu-
lator, such as with SiO
2
, trapped charges can induce very high voltage from a
few hundreds to a few thousands of volts (Wolf 1990).
For charged surfaces in liquids (e.g. water), new phenomena happen mainly
as a result of charge redistribution in the liquid. Basically, the final surface
charge is balanced by counterions in the liquid by an equal but opposite total
charge. The surface electrical potential attracts counterions to the wall and
forms a thin (<1 nm) layer of immobile ions. Outside this layer, the distri-
bution of the counterions in liquid mainly followed the exponential decaying
dependence away from the surface. This is called the diffuse electric double
layer (EDL). EDL has a characteristic length (Debye length), which depends
inversely on the square root of the ion concentration in the liquid. For example,
in pure water the Debye length is about 1 µm; in 1 mole of NaCl solution, the
Debye length is only 0.3 nm. Inside the EDL, a very large electrostatic force
then exists. This may cause a behavior change in the fluid flow if the double
layer thickness is significant compared to the flow field size (Mohiuddin Mala
et al 1996). This is especially true in dilute solutions where the Debye length
is large.
Annu. Rev. Fluid. Mech. 1998.30:579-612. Downloaded from arjournals.annualreviews.org
by CALIFORNIA INSTITUTE OF TECHNOLOGY on 09/08/05. For personal use only.
P1: RPK
March 20, 1998 17:6 Annual Reviews Caption3
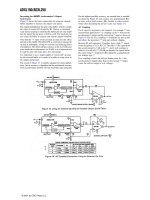
Figure 2 A micro channel system with integrated micro pressure sensors (Pong et al 1994)
Figure 18 Instantaneous surface shear stress measured by an imaging chip (Ho et al 1997).
Annu. Rev. Fluid. Mech. 1998.30:579-612. Downloaded from arjournals.annualreviews.org
by CALIFORNIA INSTITUTE OF TECHNOLOGY on 09/08/05. For personal use only.
P1: RPK
March 20, 1998 17:6 Annual Reviews Caption3
Figure 19 Vertical velocity contours ofan flap actuator interacting witha longitudinal vortex pair.
The phase angle: 0
◦
and 360
◦
flap on the surface; 180
◦
flap at its upmost location.
Figure 22 A micro system for surface shear-stess reduction (Ho et al 1997).
Annu. Rev. Fluid. Mech. 1998.30:579-612. Downloaded from arjournals.annualreviews.org
by CALIFORNIA INSTITUTE OF TECHNOLOGY on 09/08/05. For personal use only.
P1: SKH/ary P2: ARK/MBL/dat QC: NBL/abe T1: NBL
November 24, 1997 11:46 Annual Reviews AR049-19
MEMS & FLUID FLOWS 585
3.3 Steric Forces
This is a special case involving chain molecules (e.g. polymers) attached at
the surface on one end with the other end dangling into the solution (liquid for
most of the cases), where they are mobile. A different class of forces, known
as steric forces, arises whenever another molecule or surface approaches and
is a result of an entropy change caused by the confined chain molecules. The
complex molecules can produce complex interactions, and steric forces can be
either attractive or repulsive. They can be rather long range (>0.1µm), and
they are important when a fluid flow has a significant amount of long-chain
molecules.
4. FLOWS IN MICRO CONFIGURATIONS
Fluids driven by pumps flowing through channels and valves are generic con-
figurations in biomedical analytical systems. When the sizes of these devices
are in the micron range, the measured data show different behaviors from those
expected in larger devices. The exact physical mechanisms are not known,
although the surface forces, which were not considered in classical analyses,
are believed to be responsible for these interesting phenomena. This provides a
new domain for research opportunities. In this review, we limit the discussion
to simple fluids, which have small molecules. More complex fluids (e.g. non-
Newtonian or multiphase fluids) are commonly used in biomedical systems.
Much richer findings are expected in the future.
4.1 Gas Flows in Micro Channels
Flow through a straight channel is one of the simplest but most common config-
urations in micro fluidic systems. Mass flow rates in small channels with dia-
meters of about 30 microns were measured by Knudsen (1909) while studying
the non-slip/slip boundary condition. Recent interests are triggered by micro-
machine activities(Pfahler et al 1990), which includeapplications fortransport-
ing fluids in biomedical diagnosis and electronic device cooling (Tuckermann
& Pease 1982, Joo et al 1995). Helium is a common gas used in most experi-
ments becauseit has alarge meanfree path (about 2 × 10
−7
m underlaboratory
conditions). The Knudsen number based on a channel height of 1 micron is 0.2.
A micro channel with integrated micro pressure sensors (Figure 2, color insert)
was fabricated to study the flow field (Liu et al 1993b, Pong et al 1994). Slip
flow is observed, and the measured mass flow rate (Pfahler et al 1991, Pong
et al 1994, Arkilic et al 1995, Harley et al 1995, Liu et al 1995, Shih et al 1995,
1996) is higher than that based on the non-slip boundary condition (Figure 3).
For other gases (e.g. nitrogen, oxygen, and nitrous oxide), the Knudsen
number is about a factor of four smaller, but surface slip still exits. The mass
Annu. Rev. Fluid. Mech. 1998.30:579-612. Downloaded from arjournals.annualreviews.org
by CALIFORNIA INSTITUTE OF TECHNOLOGY on 09/08/05. For personal use only.
P1: SKH/ary P2: ARK/MBL/dat QC: NBL/abe T1: NBL
November 24, 1997 11:46 Annual Reviews AR049-19
586 HO & TAI
Figure 3 Mass flow rate and pressure drop of helium in a micro channel (Shih et al 1996).
flow rate can be calculated from the Navier-Stokes equation with a slip bound-
ary condition (Kennard 1938, Beskok & Karniadakis 1992 & 1993, Arkilic &
Breuer 1993). An accommodation constant is introduced to represent the tan-
gential momentum transfer between the impingingmolecules and the wall. The
value of the constant should be ≤1. However, the predicted mass flow rate is
sensitive tothe accommodation constant (Figure 3), which actually functions as
a matching coefficient. Direct simulation of the Monte Carlo method (DSMC)
has been carried out by many investigators (Oh et al 1995, Piekos & Breuer
1995, 1996, Beskok etal 1996, Oran et al 1998). The mean streamwise velocity
in the micro channel is typicallyin the very low subsonic range (<1 m/s), which
can be several orders of magnitude smaller than the molecular thermal velocity
of 1000 m/s (Oh et al 1995). Computing the converging solution is a challenge
for very low Mach-number flows.
In themicro channel,high pressuredrops are observed. This isbecause ofthe
small transverse dimension, which causes high viscous dissipation. A drop of
a few atmospheres in pressure of several mm is common (Pong et al 1994, Shih
et al1995). The densityof thegas canchange so much that thepressure doesnot
decrease linearly with streamwise distance as in typical creeping flows. Rather,
Annu. Rev. Fluid. Mech. 1998.30:579-612. Downloaded from arjournals.annualreviews.org
by CALIFORNIA INSTITUTE OF TECHNOLOGY on 09/08/05. For personal use only.
P1: SKH/ary P2: ARK/MBL/dat QC: NBL/abe T1: NBL
November 24, 1997 11:46 Annual Reviews AR049-19
MEMS & FLUID FLOWS 587
the compressibility effect causes the pressure to decrease more slowly. On the
other hand, the rarefaction effect caused by the high Knudsen number works
against the compressibility and keeps the pressure toward thelinear distribution
(Arkilic & Breuer 1993). The two effects are not equal, so the net result is a
nonlinear pressure distribution.
Because the pressure distribution is not sensitive to the accommodation con-
stant, it turns out to be a useful property for examining the analytical results.
When the accommodation constant is varied, no appreciable change in the
predicted pressure distribution can be observed. The measured pressure dis-
tributions along the channel are plotted against the theoretical prediction. The
measured pressure distribution agrees well with the analytical result (Figure 4).
4.2 Liquid Flows in Micro Channels
Even though the non-slip boundary of simple liquids with molecules is estab-
lished by experimental studies and by molecular dynamics simulation (Koplik
1989), this does not make the study of liquid flow through micro channels a
routine process. On the contrary, it seems to be an even richer problem than gas
flow. For liquid flows through capillary tubes (Migun & Prokhorenko 1987) or
micromachined channels (Pfahleret al1990, 1991), the measuredflowrates and
pressure drops across the channel were compared with the Stokes flow solution.
Figure 4 Pressure distribution of nitrous oxide in a micro channel.
Annu. Rev. Fluid. Mech. 1998.30:579-612. Downloaded from arjournals.annualreviews.org
by CALIFORNIA INSTITUTE OF TECHNOLOGY on 09/08/05. For personal use only.
P1: SKH/ary P2: ARK/MBL/dat QC: NBL/abe T1: NBL
November 24, 1997 11:46 Annual Reviews AR049-19
588 HO & TAI
Viscosity is the matching constant. Size effects are apparent in these results.
The value of viscosity deviates from the conventional value for micron-size
channels.
The molecular structure of the liquid also affects the flow. Molecules with
no electrical charge can have a dipole configuration (e.g. water). Pfahler et al
(1991) found that the value of the viscosity of polar isopropanol decreases from
the nominal value for a channel height smaller than 40 microns and reaches
an asymptotic value at a channel height of about 10 microns (Figure 5). The
verticalaxis is theratio betweenthe apparent viscosityand nominalviscosity. It
isreasonablethatthesizeeffectbecomesmorepronouncedforanarrowchannel.
However, it is interesting to note that the apparent viscosity is lower, not
higher, in the narrower channel. The apparent viscosity actually represents the
integral effects of the surface forces. More definitive experiments are needed
to identify the role of specific surface effects. For example, when the surface-
to-volume ratio gets large, will the surface viscous force also be a function of
the surface property (i.e. hydrophobic or hydrophilic)? For nonpolar silicon
oil, the data (Figure 5) cannot support a clear trend of viscosity variation in this
range of channel size.
Figure 5 Size effect on liquid flow in channels (Pfahler et al 1991).
Annu. Rev. Fluid. Mech. 1998.30:579-612. Downloaded from arjournals.annualreviews.org
by CALIFORNIA INSTITUTE OF TECHNOLOGY on 09/08/05. For personal use only.
P1: SKH/ary P2: ARK/MBL/dat QC: NBL/abe T1: NBL
November 24, 1997 11:46 Annual Reviews AR049-19
MEMS & FLUID FLOWS 589
4.3 Diffusion in Micro Channels
The sacrificial etching technique (Nathanson 1967, Preston 1972, Howe &
Muller 1983) is a fundamental technique used in surface micromachining for
producing a free-standing structure, such as the diaphragm above a cavity or
cantilever beam. The micro channel shown in Figure 2 was fabricated by this
method. The sacrificial etching process for making that channel was to deposit
a thin line of sacrificial material—in this case phosphosilicate glass (PSG)—
after whicha structural layerof silicone nitridewas placed on top. Hydrofluoric
acid (HF) was used as an etchant to remove the PSG from one end of this thin
line. When the PSG was etched away, a long micro channel was formed (Monk
et al 1993, Liu et al 1993a). The channel in Figure 2 is 1.2 microns high and
4000-microns long.
This process is an important micromachine manufacturing technique, and
it also motivates us to examine mass diffusion in micro geometries. The HF
diffuses from the reservoir, which is located at one end of the micro channel,
towards the PSG/HF interface. The rate at which the solid PSG dissolves into
the HF acid is a function of the reaction rate and the concentration of the acid.
The concentration of HF at the moving interface is dictated by the diffusion
process and the reaction rate. Basically, this phenomenon is governed by a 1-D
diffusion equation with an unknown boundary condition. It is similar to the
Deal-Grove problem, but the reaction rate changes its power dependence on the
acid concentration (Judge 1971) in the present case.
Nevertheless, a closed-form analytical solution can be obtained (Liu 1993a),
and it matches wellwith the measured data (Figure 6). On the otherhand, a size
effect is observed. The etch rate is not a constant during the etching and de-
creases asetching timeincreases. During thewhole etchingperiod, the etch rate
of athickerchannel isalways higher than that of a thin channel (Liu et al1993a).
The etch rate at the beginning of the etching process is plotted in Figure 7
and decreases almost linearly with the channel thickness in the tested range
of 1.2 to 0.25 microns. This is not expected from the 1-D diffusion analysis.
There are many types of ions in the liquid phase. It is possible that the presence
of the EDL affects the etch rate. The F
−
ions and HF
−
2
ions are responsible
for removing the PSG, and their diffusion is very likely to be retarded by the
electric double layer.
4.4 Flow Through Micro Nozzles
Flow through a nozzle experiences viscous dissipation. In the case of Stokes
flow, the pressure drop increases with decreasing Reynolds number—a
well-established result. A recent experiment (Hasegawa et al 1997) shows
that the predicted pressure drop underestimates the measured value when the
size of the nozzle is smaller than 35 microns (Figure 8). The excess pressure
Annu. Rev. Fluid. Mech. 1998.30:579-612. Downloaded from arjournals.annualreviews.org
by CALIFORNIA INSTITUTE OF TECHNOLOGY on 09/08/05. For personal use only.
P1: SKH/ary P2: ARK/MBL/dat QC: NBL/abe T1: NBL
November 24, 1997 11:46 Annual Reviews AR049-19
590 HO & TAI
Figure 6 The progress of the etching front as a function of time for various HF concentrations
(Liu et al 1993a).
= 49%; ᭜ = 38.2%; ᭡ = 26.5%; — = 13.8%; ×=7.2%; ᭹ = 3.6%.
Data points are plotted against predicted curves.
Figure 7 Size effect as a function of etching rate.
Annu. Rev. Fluid. Mech. 1998.30:579-612. Downloaded from arjournals.annualreviews.org
by CALIFORNIA INSTITUTE OF TECHNOLOGY on 09/08/05. For personal use only.
P1: SKH/ary P2: ARK/MBL/dat QC: NBL/abe T1: NBL
November 24, 1997 11:46 Annual Reviews AR049-19
MEMS & FLUID FLOWS 591
drop can be a factor of four or five times higher than the predicted value for wa-
ter flow through an 8.8-micron nozzle. When nonpolar silicon oil was used, the
excess pressuredrops were lower than that of water, which has polarmolecules.
The dependence of the measured flow property on the fluids used in the test is a
common feature in micro flows whenever a size effectis observed. It is interest-
ing to note that differences between polar and nonpolar materials, which have
been reported in micro channel flow (Pfahler et al 1991), are again observed in
this flow.
It has been reported that the EDL retards the flow. This causes an apparent
viscosity that is higher than the nominal viscosity (Mohiuddin Mala et al 1996).
This isthe opposite of the resultsobserved inthe micro-channel liquid-flow data
(Pfahler et al 1991) but follows the trends reported in the micro-nozzle flow
experiment (Hasegawa et al 1997). In this nozzle experiment, the ion content
in the water was varied by adding NaCl in order to examine the effect of the
EDL. No discernible difference in the pressure measurements was reported by
the authors. Unfortunately, distilled water rather than deionizedwater was used
Figure 8 Size effect of pressure drop across micro nozzles as a function of Reynolds number
(Hasegawa et al 1997). o, 8.8 µm; ,13µm;
᭛,27µm; +,35µm; × , 109 µm; •, numerical
simulation.
Annu. Rev. Fluid. Mech. 1998.30:579-612. Downloaded from arjournals.annualreviews.org
by CALIFORNIA INSTITUTE OF TECHNOLOGY on 09/08/05. For personal use only.
P1: SKH/ary P2: ARK/MBL/dat QC: NBL/abe T1: NBL
November 24, 1997 11:46 Annual Reviews AR049-19
592 HO & TAI
before the NaCl was added. Water is known to contain ions easily, but the level
of the ion content in their distilled water is unknown. Nevertheless, the excess
pressure drop across the micro nozzle provides additional evidence for the size
effect in the micro flows.
4.5 Air Damping in MEMS
Mechanical or electromechanical resonant devices have been widely used in
oscillators or filters, and operational theories for these devices have been es-
tablished in large apparatus. As MEMS technology develops, these resonators
are becoming smaller. These devices are typically 1- to 2-µm thick and about
100 × 100 µm
2
in area. Some important milestones for these kinds of de-
vices are the laterally driven comb-drive polysilicon micro resonators (Tang
et al 1989), Analog Device’s integrated polysilicon ADXL-50 accelerometers
(Analog Device Inc. 1991), flexural polysilicon micro gyros (Juneau & Pisano
1996), and the cascade 300-kHz micromechanical filters (Wang & Nguyen
1997). In these cases, the micro flows are shear driven (Beskok et al 1996)
instead of pressure driven, as in the channel and nozzle flows.
Air damping in microstructures is an underexplored but important issue,
because it directlyinfluences thequality (Q)factor, of thedevices. Forexample,
it has been shown (Nguyen 1995) that the Q factor of a polysilicon resonator
can be as high as 100,000 in vacuum but drops to 100 in atmospheric air. This
actually illustrates that air damping may be the most important factor when
compared to other effects like thermal vibration and fatigue. The strong air
damping is due to the dramatic increase in surface-to-volume ratio.
In order to systematically investigate air damping, the air pressure is divided
into three regions (Newell 1968). In the first region where the pressure is in
low vacuum, air damping is negligible when compared to the intrinsic damping
(internal friction) within the resonator. Experimentally, this region happens
roughly below 10–100 Pa for microresonators. The damping in this region is
largelydependentonthesurface-to-volumeratio,thesurfacequality(thesurface
may be more lossy than the bulk material), and the material. In the second
region, momentum transfer between the resonator and individual air molecules
dominates the damping. Here, little or no interaction between air molecules
happens, and a simple model has been derived based on the assumption that the
rate of momentum transfer is proportional to the difference in velocity between
the air molecules and the resonators (Christian 1966). The result is that the Q
factor is inversely proportional to the ambient pressure (Q
∼
=
1/p). This region
typicallyends around 10
3
Pa. Inthethirdregion, thepressureishigh enough that
air molecules do interact with each other, and viscous damping dominates the
behavior of the resonators. In this region, the Q factor is inversely proportional
Annu. Rev. Fluid. Mech. 1998.30:579-612. Downloaded from arjournals.annualreviews.org
by CALIFORNIA INSTITUTE OF TECHNOLOGY on 09/08/05. For personal use only.
P1: SKH/ary P2: ARK/MBL/dat QC: NBL/abe T1: NBL
November 24, 1997 11:46 Annual Reviews AR049-19
MEMS & FLUID FLOWS 593
to the fluid viscosity (Q
∼
=
1/µ). The boundary condition must change from slip
to non-slip flow when the surrounding pressure increases. What is the Knudsen
number for this change in the boundary condition? Do other surface forces play
a role in resonator performance? There is not enough experimental evidence
to answer these questions yet.
When the viscous damping of laterally driven microstructures was studied
(Zhang & Tang 1994), it was found that the simple Couette and Stokes flow
model can significantly underestimate the damping in microstructures, and that
this discrepancy is larger for smaller resonators. Most of the microstructures
have a complex configuration. For example, the comb structure and the sur-
rounding walls can also play an important role. The detailed geometry of the
device (e.g. the resonator’s thickness and edges) needs to be considered for
more accurate modeling.
An example illustrating the importance of the geometry details is the dy-
namic response of a thin squeeze-film. In a numerical simulation of a micro
accelerometer (Yang & Senturia 1996), the squeeze-film in a low air-pressure
environment has a frequency response about four orders of magnitude better
than that at atmospheric pressure conditions. When the geometry is slightly
altered by placing small etching holes through the accelerometer film, the flat
portion of the frequency response is extended by three decades beyond that of
a solid film (Figure 9).
The displacement of some MEMS devices can be much larger than their
transverse dimension. Other interesting air-damping problems arise. A flap
device (Miller et al 1996) driven by an electromagnetic field has an off-plane
displacement 1000 times larger than the thickness of the flap. The measured
Q factors depend on the magnitude of the displacement. It is believed that the
nonlinear viscous damping contributes to this phenomenon. This again is a
rather unexplored issue.
4.6 Micro Flow Diagnosis
Measuring flow properties in a micro configuration is a challenging task, be-
cause the sensors need to be much smaller than the size of the device under
study. In addition, the momentum and the energy of the flow is very small. For
example, the kinetic energy flux in the channel with helium flow (Figure 2) is
about 5.4 × 10
−13
J/s for inlet pressure at 20 psig. Therefore, only an extremely
small amount of momentum and energy exchange between flow and sensor is
allowed so as not to alter the flow. For these reasons, a very limited number of
sensors have been developed for micro flow measurements.
The micro channel with integrated pressure sensors (Figure 2) is one exam-
ple. A very small duct (0.25 micron high and 1 micron wide) is used to connect
Annu. Rev. Fluid. Mech. 1998.30:579-612. Downloaded from arjournals.annualreviews.org
by CALIFORNIA INSTITUTE OF TECHNOLOGY on 09/08/05. For personal use only.
P1: SKH/ary P2: ARK/MBL/dat QC: NBL/abe T1: NBL
November 24, 1997 11:46 Annual Reviews AR049-19
594 HO & TAI
Figure 9 The dynamic response of a thin squeeze-film (Yang & Senturia 1996).
not-very-small micro sensors (compared to the size of the channel) to the chan-
nel for increased spatial resolution. Time-averaged pressure can be obtained
by this arrangement. If unsteady pressure data are needed, questions about the
calibration procedures and even the physical meaning of the data may arise.
Furthermore, even though the pressure sensor has a high frequency response,
we do not know the constraints of the small duct imposed on the unsteady
pressure field. For temperature measurement, thermocouples of 4 microns ×
4 microns have been developed for measuring surface temperature along a
20-micron channel (Figure 10; Zohar et al 1996). In high Knudsen-number
flows, a temperature jump can occur between the wall and the bulk flow. Fab-
ricating an in-flow temperature sensor without introducing large disturbances
to the micro flow is not a trivial task.
Flow visualization has been proven to be a very useful technique in macro
fluid-dynamics research, and extensive effort has been expended on developing
methods for visualizing flow in micro channels and valves (Lanzillotto et al
1996). The wavelength of visible light is not short enough for this purpose,
so X rays (with wavelengths of 0.62 angstrom) generated by a synchrotron are
used. An advantage is that they can be utilized for visualizing flows behind
certain silicon structures, such as polysilicon, which are not transparent to
visible light.
Annu. Rev. Fluid. Mech. 1998.30:579-612. Downloaded from arjournals.annualreviews.org
by CALIFORNIA INSTITUTE OF TECHNOLOGY on 09/08/05. For personal use only.
P1: SKH/ary P2: ARK/MBL/dat QC: NBL/abe T1: NBL
November 24, 1997 11:46 Annual Reviews AR049-19
MEMS & FLUID FLOWS 595
Figure 10 The in-situ temperature sensor in a micro channel (Zohar et al 1996).
Figure 11 Flow visualization by X ray in a micro channel (Lanzillotto et al 1996).
Figure 11 shows the motion of a water/air interface during a filling process
inside a 100-micron-deep by 140-micron-wide channel with a triangular cross
section. Water climbs along the sharp corners of the triangle at a rate that is so
fast that it is beyond the resolution limit of the current technique. The meniscus
surface in the middle of the channel is left far behind the corner interface. This
phenomenon is caused by the large surface-tension force associated with the
extremely small corner curvature of the micro channel.
Annu. Rev. Fluid. Mech. 1998.30:579-612. Downloaded from arjournals.annualreviews.org
by CALIFORNIA INSTITUTE OF TECHNOLOGY on 09/08/05. For personal use only.
P1: SKH/ary P2: ARK/MBL/dat QC: NBL/abe T1: NBL
November 24, 1997 11:46 Annual Reviews AR049-19
596 HO & TAI
5. FLOW TRANSDUCERS
A typical micro transducer is about 100 microns in size, which is at least one
order of magnitude smaller than traditional transducers. The improvement in
spatial resolution comes naturally, because the significant reduction of inertial
mass and thermal capacity can increase the frequency response to an unheard-
of range [>1 MHz for a micro hot-wire (Jiang et al 1994)]. The lithographic
process and the small size enable us to use 100, 1000, or even more transducers
for sensing and/or controlling a phenomenon that has distributed features, such
as the high-speed streaks in a turbulent boundary layer.
However, a few problems are associated with using multiple transducers.
Traditionally, the leads of each transducer are connected to an external signal-
conditioning instrument. Handling 100s or 1000s of signal paths is tedious
and usually prohibitive. In addition, these leads occupy a large portion of the
precious surface area on the chip. For example, the surface shear-stress sensor
array containing 85 sensors (Ho et al 1997; see Figure 18, color insert) only
takes about 1% of the area, whereas the leads occupy about 50% of the surface.
Another problem is the limitation in signal bandwidth. Depending on the
number of transducers used, we may sometimes not be able to take full advan-
tage of the high-frequency response. However, these problemscan bealleviated
by integrating the signal conditioning and even decision circuits with the micro
transducers in such a way that the leads can be connected locally and thereby
significantly reduce the required surface area. The output and input then can be
only a few wires. Furthermore, the local circuit wire only processes the output
from one ora few transducers, so bandwidth limitation will no longer be a prob-
lem. However, the signal processing circuitry still needs to be kept simple. It is
not feasible to integrate a powerful microprocessor with each sensor–actuator
pair in a large transducer array. Neural networks are a feasible approach, and
numerical (Lee et al 1997) experiments show successful examples of using
simple neural network–based processing for controlling transitional or turbu-
lent flows.
Another issue is the energy expenditure of the transducers. In the case of
flow control, we usually need to have a net energy saving for the whole system.
Typically, the energy requirement for a micro flow sensor can be kept around
a few milliwatts, but the energy expended for micro actuators is usually much
higher. Improvements in this area are clearly needed.
5.1 Micro Flow Sensors
5.1.1 HOT-WIRE ANEMOMETERS Micro-machined polysilicon hot wires (Jiang
et al 1994) can have a cross-section as small as 0.5× 0.5 µm
2
and a length of
from one to several-hundredths microns (Figure 12). A significant increase in
Annu. Rev. Fluid. Mech. 1998.30:579-612. Downloaded from arjournals.annualreviews.org
by CALIFORNIA INSTITUTE OF TECHNOLOGY on 09/08/05. For personal use only.
P1: SKH/ary P2: ARK/MBL/dat QC: NBL/abe T1: NBL
November 24, 1997 11:46 Annual Reviews AR049-19
MEMS & FLUID FLOWS 597
Figure 12 Micro hot wires: (a)a1-µm× 70-µm single hot wire; (b) a hot-wire array (Jiang
et al 1994).
spatial resolution can be achieved. Using polysilicon has many other advan-
tages. One is that the temperaturecoefficient of resistance (TCR) of polysilicon
can be varied from −2% to 0.2%/
◦
C using a range of doping concentrations
of boron or phosphorus from 10
17
to 10
20
atoms/cm
3
. In comparison, conven-
tional platinum wires only have a TCR of around 0.1%/
◦
C. We can use such a
large variation of the TCR of polysilicon to design a hot wire that specifically
requires thermal sensitivity.
The other advantage of the polysilicon wire is that a hot wire’s time constant
is inversely proportional to the wire’s resistivity (Blackwelder 1981). Since
conventional hot wires use metals exclusively, resistance is typically low (5–30
ohms). On the other hand, the resistance of polysilicon wires can be adjusted
over a wide range (from 1 k to several 100 k). When a constant temperature
mode is used, a bandwidth of 1.4 MHz has been achieved with the aid of a
heavily doped polysilicon wire. These extremely high frequency responses of
a micro hot wire are mainly achieved by adjusting their material properties
rather than by simply reducing their size.
5.1.2 SHEAR-STRESS SENSORS A thermal-surface shear-stress sensor is a hot
film placed on a surface (Haritonidis 1989). This sensor has reasonable sen-
sitivity while it is used in water. When air is the working medium, however,
most of the heat is conducted into the substrate rather than into the air be-
cause of the very low heat capacity of air. The use of surface-micromachined
Annu. Rev. Fluid. Mech. 1998.30:579-612. Downloaded from arjournals.annualreviews.org
by CALIFORNIA INSTITUTE OF TECHNOLOGY on 09/08/05. For personal use only.
P1: SKH/ary P2: ARK/MBL/dat QC: NBL/abe T1: NBL
November 24, 1997 11:46 Annual Reviews AR049-19
598 HO & TAI
shear-stress sensors (Jiang et al 1996, Huang et al 1996) resolved the problem.
A polysilicon wire is placed on a 1.2-µm-thick and 200 × 200-µm
2
silicon-
nitride diaphragm. Underneath the silicon-nitride diaphragm is a 2-µm-deep
vacuum cavity (Figure 13a). Significant thermal insulation has been achieved
by using the vacuum chamber and the silicon-nitride diaphragm with low ther-
mal conductivity. Figure 14 shows that the resistance of the polysilicon wire
on a vacuum-insulated diaphragm is almost an order of magnitude higher than
that on a solid substrate. The micro-surface shear-stress sensor has a sensitivity
of 100 mV/Pa and a bandwidth of 10 kHz and higher.
Thistype ofmicrosensorcan alsobeintegratedintoa largearrayand caneven
form aflexible skinto beplaced on a curvedsurface (Jianget al 1997). Mechan-
ically, the flexible skin (Figure 13b) consists of 128 separated silicon “islands”
(1 mm × 1mm×80 µm) that are connected together by a thin polyimide film
(1/20 µm thick). The shear-stress sensors are built on the silicon islands. This
skin has been tapedon a semi-cylindrical (1.3-cm-diameter) delta-wing leading
edge to perform real-time 2-D shear-stress mapping. Flow separation along the
leading edge has then been successfully measured using the skins.
A different design ofa thermal-based wall shear-stress micro sensor has been
reported by L¨ofdahl etal (1996). Inthis case,the sensoris a 300× 60× 30-µm
3
silicon chip that uses a temperature-sensitive silicon diode as the temperature
Figure 13 Micro-surface shear-stress sensor (Jiang et al 1996 & 1997). (a) a single sensor; (b)a
flexible array of 128 sensors.
Annu. Rev. Fluid. Mech. 1998.30:579-612. Downloaded from arjournals.annualreviews.org
by CALIFORNIA INSTITUTE OF TECHNOLOGY on 09/08/05. For personal use only.
P1: SKH/ary P2: ARK/MBL/dat QC: NBL/abe T1: NBL
November 24, 1997 11:46 Annual Reviews AR049-19
MEMS & FLUID FLOWS 599
Figure 14 Heating element temperature of the shear-stress sensor (Jiang et al 1994). ᭺ = heating
element on vacuum chamber;
ᮀ = heating element on air-filled chamber; = heating element
on solid substrate.
sensing element. This chip isembedded in a silicondiaphragm with polyimide-
filled trenches to improve thermal isolation. This device takes about 40 mW
of power in order to obtain a biased differential temperature of 100
◦
C. The
uniqueness of this work is that a polysilicon-diaphragm piezoresistive pressure
sensor is also integrated with the shear-stress sensor.
By suspending a micro floating element, a direct measure of the shear stress
can be achieved. Schmidt et al (1988) first reported a micro floating-element
shear-stress sensor. It was designed to provide a spatial resolution of 100 µm
and a bandwidth of 20 kHz. The floating element was a 500× 500 × 30-µm
3
polyimide plate tethered by polyimide beams. When exposed to shear stress,
the plate movement was sensed capacitively with two integrated field-effect
transistors (FET) and off-chip electronics. A sensitivity of 52 µV/Pa was
reported.
Pan et al (1995) then reported a different floating element. Pan’s device is
made of thin-film polysilicon. A typical device includes a polysilicon floating
Annu. Rev. Fluid. Mech. 1998.30:579-612. Downloaded from arjournals.annualreviews.org
by CALIFORNIA INSTITUTE OF TECHNOLOGY on 09/08/05. For personal use only.
P1: SKH/ary P2: ARK/MBL/dat QC: NBL/abe T1: NBL
November 24, 1997 11:46 Annual Reviews AR049-19
600 HO & TAI
element (∼100 × 100× 2.2 µm
3
) and several suspension beams (∼100 µm
long). These floating elements have much smaller sizes and better sensitivities
(167 mV/Pa), owing to delicate force-balance electronics. Padmanabhan et al
(1995) reported a single crystalline-silicon bulk-micromachined and silicon-
fusion-bonded sensor. The movement of the element is measured by two photo
diodes underneath the element.
5.1.3 PRESSURE SENSORS Micro piezoresistive pressure sensors represent the
most mature and successful application of MEMS devices, having a wide
range of applications from automobiles to biomedical instruments. Micro-
machined piezoresistive silicon-based pressure sensors were first introduced in
1958 by Kulite, Honeywell, and MicroSystems (Brysek et al 1990). At that
time the devices were typically made with silicon piezoresistors glued to metal
diaphragms. The much more advanced micro-pressure sensors used today are
made by anisotropic etching of silicon, which requires no hand assembly. Ex-
amples are the fully integrated Motorola pressure sensor (Fraden 1993) and
the silicon-fusion-bonded millimeter– and submillimeter–size pressure sensors
(Brysek et al 1990).
Polysilicon has been a popular material for piezoresistive pressure sensors,
but many diaphragm materials have been explored, such as polysilicon (Guckel
et al 1986, Sugiyama et al 1991) and silicon nitride (Liu et al 1995). A wide
rangeofpiezoresistivepressuresensors is available,upto 10,000 psi,andtypical
uncompensated full-scale pressure sensitivity is about 20 mV/V. Capacitive
pressure sensors have the advantages of better sensitivity and less temperature
drift (Lee & Wise 1982, Ko et al 1982). Their performance, however, depends
heavily on electronics.
5.1.4 TEMPERATURE SENSORS Many different temperature sensors have long
been available (Fraden 1993), and most of these temperature-sensing schemes
can be implemented in micro scales. For example, the silicon-resistive and pn-
junction temperature sensors are widely used for temperature compensation in
silicon diaphragm-type pressure sensors (Brysek et al 1990). An interesting ex-
ample is an infrared (IR) detector that uses a thindiaphragm to absorb incoming
IR light, converting the photon energy into heat (Lahiji & Wise 1980). On the
2 × 2-mm
2
diaphragm (1 µm thick), a large number of thin-film thermal cou-
ples (Bi–Sb and Au–polysilicon) that are connected in series to amplify the
signal were fabricated. The device shows an impressive sensitivity of 30 V/W
and a time constant below 10 ms.
5.2 Micro Flow Actuators
Several actuating mechanisms, including electrostatic, electromagnetic, ther-
mopneumatic, etc. are used in micro actuators. Among them, electrostatic
Annu. Rev. Fluid. Mech. 1998.30:579-612. Downloaded from arjournals.annualreviews.org
by CALIFORNIA INSTITUTE OF TECHNOLOGY on 09/08/05. For personal use only.
P1: SKH/ary P2: ARK/MBL/dat QC: NBL/abe T1: NBL
November 24, 1997 11:46 Annual Reviews AR049-19
MEMS & FLUID FLOWS 601
actuation is most popular, mainly because of its ease of fabrication. However,
the electrostatic actuation has intrinsic limitations of force (∼µN) and dis-
placement (∼µm) outputs. They can be used to study flow instability problems
where only small displacement is required. For example, Huang et al (1996)
made an electrostatic actuator to control screech in high-speed jets. With the
design of 70-µm peak-to-peak displacement at the resonant frequency of 5 kHz
of the device, it has been shown that proper disturbances in the jet flow can be
provided.
Electromagnetic actuation can provide much larger forces (100s of µN) and
higher displacements (mm). For example, a micro-magnetic flap (Miller et al
1996) with a 30-turn copper coil and a layer of Permalloy (Ni
80
Fe
20
) was fab-
ricated on a 4 × 4-mm
2
silicon plate (40 µm thick). In a magnetic field of
1 kg, the device can be driven to a rotational angle of more than 30
◦
, because
of the induction of magnetization in the Permalloy. In addition, a ±100 mA
of current can then be applied to the coil to move the flap another ±10
◦
. This
allows total control of the flap for more than 2 mm of tip motion (Figure 15).
These and other similar devices have been shown to be effective in changing
the separation of a flow around a leading edge (Liu et al 1995) and to achieve
drag reduction in boundary layer flow (Tsao et al 1994, Ho et al 1997).
The thermopneumatic actuation mechanism is a technique that can provide
force (>N) and displacement (>mm) even larger than that of the electromag-
netic method. Thermopneumatic actuation, first demonstrated by Zdeblick &
Angell (1987), showed that a heater in a liquid-filled cavity can heat the fluid
Figure 15 Micro electromagnetic flap actuator (Miller et al 1996).
Annu. Rev. Fluid. Mech. 1998.30:579-612. Downloaded from arjournals.annualreviews.org
by CALIFORNIA INSTITUTE OF TECHNOLOGY on 09/08/05. For personal use only.