LESSONS FROM SCOTCH: SUSTAINABILITY, COMPETITVENESS AND TECHNICAL CHANGE potx
Bạn đang xem bản rút gọn của tài liệu. Xem và tải ngay bản đầy đủ của tài liệu tại đây (226.04 KB, 59 trang )
SPRU - Science and Technology Policy Research
Appendix P 2
LESSONS FROM SCOTCH:
S
USTAINABILITY, COMPETITVENESS AND TECHNICAL CHANGE
Report to the Institute for Prospective Technological Studies, Sevilla for their
project on BAT environmental regulations and competitiveness
Dr Adrian Smith
SPRU - Science and Technology Policy Research
Mantell Building
University of Sussex
Brighton
BN1 9RF
UK
Tel: 0044 1273 877065
Fax: 044 1273 685865
Email:
SPRU - Science and Technology Policy Research
Appendix P 2
1
Contents
Contents 1
Introduction 3
The dynamics of technical change in the pulp and paper industry 3
Competitiveness issues in the EU pulp and paper industry 8
Environmental performance in the EU pulp and paper industry 16
Heterogeneity in the EU pulp and paper sector, case study sites and site visits 25
The draft research questionnaire 28
Conclusions 32
References 34
Appendix A - SCOTCH paper sector interviewees 35
Appendix B - Equipment suppliers to the pulp and paper industry 37
Appendix C - The innovation process in pulp and paper making (1980-1995) 40
Lessons from SCOTCH
Appendix P 2
2
SPRU - Science and Technology Policy Research
Appendix P 2
3
Introduction
This report provides information about the EU paper industry learnt during the DGXII
funded project, Sustainability, Competitiveness and Technical Change (SCOTCH). It
is intended to help the IPTS/DGIII project analysing ‘BAT and competitiveness’ by
providing background information about the paper industry case study sector and by
offering some general advice concerning the research design. Specific objectives are
to cover the following topics:
• Providing advice on the dynamics and drivers of technical change in the pulp and
paper sector.
• An appraisal, from an EU perspective, of the competitiveness issues faced by the
EU pulp and paper sector.
• Characterising the environmental performance of the EU pulp and paper industry,
particularly with reference to implementation of BAT under the IPPC Directive.
• Characterise the heterogeneity of the sector and advise on how this can be captured
by the BAT and competitiveness case study design.
• Review the draft research questionnaire and suggest amendments.
• Provide practical advice on plant visits.
These will be met from the perspective of the SCOTCH project, whose chief aim was
to link quantitative Life Cycle Analysis models with detailed qualitative studies into
technical change in a novel, dynamic way. The objective was to assess if such a
linkage might improve understanding of the relationship between technical change
and environmental performance in a mature process industry. The SCOTCH final
report will be passed onto IPTS as soon as it is available.
The paper industry was one of two case study industries (the other being PVC).
SCOTCH focused specifically on the manufacture of coated printing and writing
papers (e.g. LWC grades). This paper grade was chosen because, amongst other
things, it had not been so widely researched (unlike newsprint or tissue). The patina of
the advice in this project reflects this coated paper focus. The SCOTCH project relied
upon semi-structured interviews and a thorough review of primary and secondary
literatures across the entire paper production system, from forestry to waste
management, chemical supplies to magazine publishers. The list of interviewees is
provided in Appendix A.
The following sections cover each of the objectives listed above more or less in order
(although advice on plant visits is covered in the section explaining the heterogeneity
of the sector).
The dynamics of technical change in the pulp and paper industry
Putting technical change in the pulp and paper sector into some perspective, we see
that when combined with printing it generally falls into the low-tech industry category
by OECD standards (table 1).
Lessons from SCOTCH
Appendix P 2
4
Table 1: 1992 business expenditure on R&D as a percentage of production across
industries in the OECD-12 countries.
Aerospace 12.4 Non-ferrous metals 0.9
Computer and office machinery 11.9 Fabricated materials 0.7
Pharmaceuticals 11.9 Ferrous metals 0.7
Communications/semiconductor 9.0 Other manufacturing 0.7
Scientific instruments 6.4 Food, beverage and tobacco 0.3
Motor vehicles 3.4
Paper and printing 0.3
Industrial chemicals 3.3 Textiles, footwear and leather 0.3
Electronic machinery 2.7 Wood and wood products 0.2
Other transportation 2.5 Shipbuilding -
Non-electronic machinery 2.0
Rubber and plastics 1.2
High tech industries 8.1
Non-metallic mineral products 1.0 Middle tech industries 2.5
Petroleum refining 1.0 Low tech industries 0.5
Source: OECD (1996)
Within the sector we see that a number of EU Member States, particularly
Scandinavian members, perform well compared to other countries, whereas other
Member States are in decline (table 2).
Table 2: R&D intensity for pulp, paper and printing within the OECD
Country 1973 1992
Finland 0.4 0.8
Sweden 0.5 0.8
USA 0.3 0.5
Japan 0.4 0.3
Canada 0.3 0.3
UK 0.2 0.1
France 0.2 0.1
Germany 0.1 0.1
Source: OECD (1996)
This could inform the choice of countries in the IPTS project, with a mix of high and
low R&D intensity countries chosen, such as Finland and France respectively.
However, as Laestadius has indicated, these headline figures overlook significant
elements of development not attributed as such by firms owing to the nature of
technology development in the industry (Laestadius, 1998). Laestadius thinks these
non-attributed R&D costs or effort could be as high as 20%.
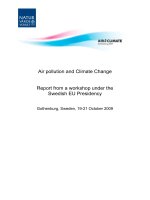
Analysis of the drivers and loci of technical change in the SCOTCH suggests
technical change is a networked process. Figure 1 (below) illustrates this network for
coated paper manufacturing. As an example, magazine paper with a high recycled
content might fail competitively in an unregulated market because advertisers do not
like it, but recycled papers may get used if regulators were to require recycled content
and so indirectly drive technical development among suppliers of deinking equipment.
These pressures shape and are shaped by the coevolution of a technology.
SPRU - Science and Technology Policy Research
Appendix P 2
5
Figure 1: drivers in the pulp and paper technology change network.
Capital goods suppliers have a particularly important role in innovation processes,
through both identifying opportunities and responding to customer needs. Only a few
major capital goods suppliers exist globally, and many of these are based in the EU
(see Appendix B). The diffusion of technical change with these firms in the vanguard
is to the competitive advantage of Europe. Technical changes along each stage of the
paper production system (from forestry to deinking of waste paper) are described in
Appendix C.
Equipment suppliers are important centres for innovation and tend to form
partnerships with pulp and paper firms when scaling innovations up to full-size. The
Advertisers Readers
PublishersPrinters
Paper
Pulp
Forestry
Regulators
Other inputs
NGOs
Capital goods
technology
driver/gate
=
Key:
G
G
G/D
G
D
D
D
D
D
G
D
D
G/D
Lessons from SCOTCH
Appendix P 2
6
risk sharing over new plant is negotiated. Technological collaboration ‘seems to be the
rule rather than the exception’ (Laestadius, 1998). Project teams of suppliers and users
are formed, sometimes including consultants who have wider, independent experience
on installation and development issues than do the users. So pulp and paper firms tend
to work in partnership with suppliers to develop and modify innovations. More
fundamental research takes place in the universities or at industry funded research
centres. As Richard Phillips, the Senior Vice-President of Technology at International
Paper puts it: ‘Paper companies have allowed a major element of the profitability
equation to escape their control, relying to excess on engineering prepared by our
consultants and on technology developed by our suppliers. There is little to distinguish
among companies other than operating efficiency and investment timing’ (Phillips,
1997, p.145). As we shall see, this does indeed have implications for company
competitiveness.
Suppliers explained in interview that it can sometimes be difficult to persuade pulp
and paper manufacturers to enter into such partnerships, particularly if the piloting
work threatens to disrupt production (e.g. if it is in-line rather than parallel to
production). Down-time for a 300,000 tonne per annum paper machine can cost
around US$12000 per hour (Hélioui and Simon, 1997). For this reason, plant
expansions provide a good window of opportunity for development work. The scale of
the industry is immense. A modern bleached sulphate pulp mill can have a capacity of
500,000 tonnes/year; which suggests the world’s production in 1995 could have been
met by only 144 modern mills. A new mill can cost in excess of US$1000 million,
i.e. more than US$1 million of capital per employee. Paper machines run into the
hundreds of millions of dollars and are equally leviathan. They can produce paper
with widths up to ten metres and at speeds in excess of 90 km/hour. Table 1 shows
trends in average scale for pulp and paper machines in Sweden. Table 2 presents
average paper & board and pulp machine sizes in 1993 for Finland, Sweden and
Germany.
Capital intensity (annual capital expenditures divided by sales) in the pulp and paper
industry is twice the average in manufacturing, running between 7 and 14 per cent in
the US, and exceeds other commodity sectors like chemical and allied products and
plastics (Butner and Stapley, 1997, p.155-6). In Finland, the capital investment per
employee runs at US$62476 and the ratio of investment to sales output is 0.17 (United
Nations, 1991).
Table 1: average pulp, paper and paperboard mill capacity in Sweden (‘000
tonne/year)
1960 1970 1980 1993
Pulp mills 45 90 145 225
Paper/board 30 70 115 185
Source: Skogsindustrierna (1993)
SPRU - Science and Technology Policy Research
Appendix P 2
7
Table 2: average paper and board and pulp mill sizes (tonnes/year) in key EU Member
States.
Paper and board Pulp
Capacity Mills Size Capacity Mills Size
Finland 11446000 45 254356 11045000 43 256860
Sweden 9385000 50 187700 10990000 50 219800
Germany 15225000 191 79869 2300000 22 104545
Source: Pulp and Paper International (1995)
Of the 81 EU facilities making coated graphic papers, 78 report employment data
(Pulp and Paper International, 1997). These 78 facilities employ 47,421 people, the
smallest having 50 employees and the largest employing 2200 people. The average
level of employment for an EU coated graphic paper facility is 608 people.
The large scale of plant in the sector is one variable which explains this supplier locus
- capital goods suppliers can (hopefully) recoup investment costs through repeat sales
in a way the pulp and paper firms cannot. The provision of tailor-made systems (made
from standardised units) to pulp and paper customers, compared to the provision of
bespoke units, is a strategy which some capital goods suppliers are following to
maximise profits. Ongoing service arrangements are another marketing technique
aimed at promoting longer term partnership and custom between equipment suppliers
and paper makers (Interview evidence). Research and development is a high entry
barrier in this sector. Collaborative development and diffusion costs can be high. A
single batch pulping project developed in the 1980s between Sunds and Assi cost
between 100 and 300 MSEK. Sunds’ Thermopulp™ mechanical pulping technology
cost them 17 MSEK and SCA (the user firm) 16MSEK (Laestadius, 1998).
Another entry barrier is the significance of track record in providing reliable
equipment which meets the original specifications. Past failures (e.g. pulp quality
problems from single, displacement bleaching towers sold in the early 1980s) coupled
with the scale of any new investment means customers need to be convinced about a
suppliers technical competence. The smaller R&D centres maintained by pulp and
paper firms serve the function of verifying supplier claims. The exceptions are Finland
and Sweden, which retain in-house R&D levels above the OECD average, their R&D
indicators both being 0.8 compared to the OECD average of 0.3 (Laestadius, 1998,
p.388). Reliability, long lead times between order and commissioning (which can be
several years), and the long life of machinery (up to and over twenty years) tend to
make the paper industry conservative about new technologies.
A final explanatory factor to the capital goods supplier locus for technical change is a
paper maker shift in focus from process innovations to product innovation (though the
higher productivity and improved process control offered by new machines remains of
interest). Product innovation relates to the way paper makers engineer a product which
is end-user or market oriented. In this respect, though new process technologies can be
bought in, it is the way the paper firms manage the link between skilful process
operation and product design and quality which becomes a major source of
competitiveness (Interview evidence with paper mill managers).
Lessons from SCOTCH
Appendix P 2
8
Chemical inputs suppliers operate with paper firms along similar lines (and sometimes
with the capital goods suppliers). The locus of innovation is in the chemical firms
themselves, and they develop and prove products by seeking partnerships with pulp
and paper firms.
Given the role of capital goods and chemicals firms as sources of technology, the
ability for paper manufacturers to maintain a technological lead over rivals is limited
to the investment plans of those rivals. New technologies are available to all paper
firms willing to risk the investment. Indeed, a number of interviewees suggested a
characteristic of the sector is the desire to be the second to invest in new technology
rather than the first (i.e. buy pioneering technology whilst it is still new yet already
proven).
A second point to bear in mind is the heterogeneity of plant in the sector. The
wholesale construction of new mills is a relatively infrequent phenomena, and many
sites upgrade existing plant - avoiding expensive civil engineering costs - in a
piecemeal manner. Thus a paper machine may have a wire section rebuild but keep
the old drying section (although there can be systemic interactions at play, such that
the drying capacity must be sufficient for any increase in production speed, which
might actually require some drying section modification). Thus different sites may
manufacture similar products with ensembles of machinery of various contrasting
vintages. Analysis of paper machine vintages at the 81 facilities manufacturing coated
graphic papers found 46% had undergone at least one major rebuild within 20 years
and 73% rebuilt within 30 years. The average plant life before rebuild or replacement
for this sample is 25 years (see later). This is an order of variety different to the more
widely recognised vertically integrated and non-integrated manufacturing facilities.
Understand technical change and the dynamics of development in the sector may
prove an important factor in explaining the development and diffusion of BAT
technologies amongst pulp and paper firms, and any consequent differential impacts
on their competitiveness.
Competitiveness issues in the EU pulp and paper industry
The EU pulp and paper industry from a global perspective
In terms of volume of sales, the EU
1
pulp and paper industry has recently increased its
global share beyond one quarter. The number of EU based firms in the top 50 global
pulp and paper firms is relatively stable whilst the number in the top 20 has increased
in recent years. This is illustrated in Table 3. Note that this is also the period in which
environmental regulations emerge in the EU.
1
1997 membership of the Union is used as a basis in this case.
SPRU - Science and Technology Policy Research
Appendix P 2
9
Table 3: the global performance of the best EU pulp and paper firms.
Year
1974 1979 1989 1997
EU firms in top 20 4 2 5 8
EU firms in top 50 16 17 16 16
Sales of global top 50
firms (US$m)
46700 87200 127000 176800
Sales of EU firms in top
50 (US$m)
12600 21400 32400 54900
EU sales as % of top 50 27 25 25 31
Source: Pulp and Paper International
The raw materials for paper production are wood fibres, water, minerals and chemical
additives. The productivity of EU forests is affected by climate and species type, and
in this respect the EU is at a natural competitive disadvantage with some of the newer
producers in SE Asia and Latin America, particularly for tree plantations. The growth
cycle in South Sweden, for example, is 70 years (in the North of the country it can be
as long as 125 years) compared to 30 years in South USA (Interview evidence).
Eastern Canada, climatically equivalent to Northern Europe, has annual growth rates
of 3-5 m
3
per hectare, compared with more fecund annual rates in SE USA (25 m
3
per
hectare), Indonesia (30-40 m
3
per hectare) and Brazil (30-40 m
3
per hectare) (Dudley
et al, 1995). In effect, it requires an area 16 times greater to feed a 500,000 tonnes per
year pulp mill in the Nordic countries than it does in Brazil (FAO, 1997).
However, there are a number of factors which mitigate against this natural
comparative advantage. The first is that growth in regional pulp and paper markets in
SE Asia and Latin America tend to consume wood grown there - though the SE Asian
financial collapse has, on the one hand, prompted producers there to look to export
markets (Glass, 1998), and on the other it has cancelled the construction of planned
mills. The second mitigating factor is that the shift away from chlorine bleaching has
required higher quality, fresh wood inputs, so proximity of wood to chemical pulp
mill is important. In terms of the Porter fivefold typology of competitive forces
(Porter, 1985), the trend to fresh wood pulping presents entry barriers to non-EU
competitors. In this respect, paper raw material markets remain regional and have not
truly globalised. Of course, this shifts the competitiveness issue to the level of market
pulp.
The third mitigating factor is the value added to the wood fibres within the EU paper
products network. Larger areas of land may be required,
2
but this EU disadvantage can
be overcome through the deployment of more advanced factors to manufacture higher
quality paper products more productively and cleanly (Interview evidence). Porter
claims it is advanced factors such as communications infrastructure, educated
personnel, R&D and market knowledge which have become the most significant for
competitive advantage (Porter, 1998, p.77). A final and related point concerns social
and regulatory pressures for sustainable forestry and more eco-efficient products. The
quality of forestry stewardship in the EU could become a source of comparative
2
The larger area has implications for transport and organisation costs. Opportunity costs associated
with the land are only as relevant as the alternative uses for that land and/or the management of the
forest - eg. public access.
Lessons from SCOTCH
Appendix P 2
10
advantage compared to clear cutting or plantation practices elsewhere. Publisher
customers are increasingly concerned about this issue, in a similar way to the chlorine
bleaching issue in the 1980s (Interview evidence).
Data for recent new pulp projects positions Western Europe and the Nordic Countries
second to North America for capacity expansion (see table 4 below). Between 1994
and 1996 Western Europe and Nordic Countries invested in 29% of global expansion
in pulp capacity, highlighting the continuing importance of this pulp producing region.
Table 4: changes in pulp capacity 1994-1996.
Change in 1000 tons
Region New
projects
Expansions/
modifications
Shut downs Net change
North America 4504 2768 -2555 4718
Nordic countries 1230 707 -490 1447
Western Europe 2555 650 -315 2890
(W.Europe sub-total) 3785 1357 805 4337
Japan 148 234 -205 177
China 742 109 -85 766
Other Asia 3012 409 -529 2892
(Asian sub-total) 3902 752 819 3835
Latin America 1037 700 -170 1566
CIS/Russia 67 221 -75 214
Oceania 112 128 -55 185
Eastern Europe 90 27 -75 41
Africa 53 240 -262 31
World Total 13550 6193 -4816 14927
Source: Jaako Poyry.
As for coated graphic papers, the focus of SCOTCH, these account for two thirds of
magazine production in 1995.
3
In 1995 world production of paper and board was 278
million MT, having grown at a mean annual rate of 4.2 percent over the previous 15
years. Of this, 81.8 million MT (29 percent) was graphic paper, and of this 32 percent
(26.2 million MT) were coated papers. Coated graphic papers therefore make up
about 9 percent of world paper and board production. While still relatively minor,
coated paper markets have been growing rapidly at a rate of nearly 10 percent per year
between 1980 and 1995, driven especially by the explosion in magazine publishing
and by other paper advertising and promotional materials.
An internal view of the EU pulp and paper industry
EU production of pulp (wood fibres) in 1995 was 31.8 million tonnes, around 18% of
the world total. This proportion has remained fairly steady over the previous 15 years,
although annual growth rates in the EU have been somewhat lower at 1.7 percent.
Production of pulp in the EU is highly concentrated, with Finland and Sweden
accounting for some two-thirds of the total in 1995. However, paper production is
much less concentrated, and trade in pulp therefore plays an important role within the
3
CEPIPRINT, End-use tables, 1995.
SPRU - Science and Technology Policy Research
Appendix P 2
11
EU. Imports of pulp account for some 40 percent of consumption by EU states, the
major net importers of pulp being Germany, France and the UK. As production of
pulp in Germany falls, it is becoming increasingly dependent on foreign imports. An
increasing proportion of these imports are from non-EU pulp producers, with exports
from the main net producers of pulp in the EU, Sweden, Finland, Portugal and Spain
stabilising in the early 1990s. In 1995 about 17 percent of EU pulp consumption was
met from non-EU sources. Market pulp accounts for 28 percent of total EU pulp
production.
EU production of paper and board in 1995 was 69.7 million tonnes, having seen
growth rates of 4.5 percent per year over the previous fifteen years. Graphic paper
made up a relatively larger proportion of total production (38 percent of the EU total),
while of this 50 percent (13.2 million MT) were coated graphic papers. Coated
graphic paper therefore made up 19 percent of EU paper and board production, having
experienced mean annual growth rates of nearly 13 percent between 1980 and 1995.
Most EU graphic paper production is for the EU market. In 1995 about 17 percent of
production was delivered to non-EU markets. Paper and board manufacture is more
evenly distributed in the EU than pulp production.
There are 81 sites in the EU manufacturing coated graphic papers. Some of these sites
manufacture other types of paper too. Table 5 illustrates the spread of coated graphic
paper production across the EU.
Table 5: paper production capacities at coated facilities by Member State.
Member State No. facilities No. reporting
capacity data
Coated
capacity
Total capacity
Austria 3 3 940 1,060
Belgium 1 0 - -
Denmark 1 1 40 120
Finland 11 10 2,390 4,980
France 14 10 1,114 1,487
Germany 12 10 2,366 3,536
Greece 2 1 45 45
Italy 15 11 980 1,265
Netherlands 2 1 200 200
Portugal 1 1 30 200
Spain 4 3 138 168
Sweden 8 6 815 1,515
UK 7 5 458 867
TOTAL 81 62 9516 15443
Source: Pulp and Paper International Yearbook 1997
From the table it is clear that Finland and Germany are the major coated paper
producers. France and Italy have the most number of coated paper facilities, but the
capacities of these are lower and their aggregate national capacities for coated paper
are around 40-50% of those of Finland and Germany: an indication of the variety of
production patterns across the EU. Overall, countries with some significant coated
graphic paper manufacturing are Finland, Germany, France, Italy, Sweden and the
Lessons from SCOTCH
Appendix P 2
12
UK. Similar analyses can be made for grades of interest to IPTS: kraft pulp; copier
paper; and board.
Competition in the EU pulp and paper industry
Paper manufacturers compete on price and quality. Important for magazine grade
quality is the consistency of product properties. The uniform printability of the paper
is a product feature of vital interest to publishing customers.
Paper quality and price are functions of a number of interrelated factors. It is the
optimisation of these factors, to produce a desired end product in a recognised market
or to meet customer specifications, which is a key component for firm
competitiveness. So, for example, the printability and runnability of graphic paper
(through web printing equipment) are important properties for customers (magazine
publishers). Printability requires the paper to be bright yet opaque. Bleached chemical
pulp is bright and strong but not opaque, nor do the long fibres take printing inks as
well as shorter mechanical fibres. Mineral fillers impart opacity but not strength.
Within each of these broad types are ranges of materials with slightly different
properties (clay filler compared to precipitated calcium carbonate, for example, or
ECF chemical pulp strength compared to TCF chemical pulp strength). All these must
be optimised within cost (eg. chemical pulp is generally more expensive than
mechanical pulp), quality and product differentiation constraints to produce paper or
board with desired properties.
So, knowing how the fibre-additives-mineral furnish responds to the paper machine,
and being able to control the paper making process, is a crucial source of
competitiveness. Microelectronic process monitoring, control and automation operates
for this end. But there are organisational sources of competitiveness too. The firms
interviewed pointed out that they do not sell entirely to a spot market competing on
price. Sections of the business derive from long term contracts with publishers in
which customer care relationships are important. The ability to respond to publisher
desires becomes vital, and a paper mill can expect visits from the publisher with data
about the runnability and printability of the paper and the types of improvement the
publisher would like. The appeal to publishers of such longer term contractual
arrangements are that their own cost structures for the coming year are known in
advance (for which paper can contribute between 30% and 70%, depending upon the
print run, say 50,000 copies to 750, 000 copies) (interview evidence) - any paper
shortage, due to growth in circulation say, or the launch of a new title, can be bought
from the spot market. Publishers are an important gatekeeper for paper product
innovations, who in turn have to manufacture magazines attractive to advertisers and
subscribers. Of course, this type of contract is likely to be less significant in the grades
considered in the IPTS project.
Technologically, the companies can buy in the latest technology from capital
equipment suppliers - so any first mover advantages tend only to be as sustainable as
the investment plans and new process learning in competitor companies. To use the
computing analogy of software and hardware: competitive advantage in pulp and
paper is won through the development of software (the raw material properties, their
optimum mix and their behaviour on the machinery) running on relatively commonly
SPRU - Science and Technology Policy Research
Appendix P 2
13
available hardware. This is not to say that all firms have the same hardware. For
reasons discussed earlier, the hardware used by firms is actually quite heterogeneous:
an accretion of past investments. And, broadly speaking, the hardware strategies of
firms lie somewhere along a spectrum ranging from the running of old technology,
whose capital costs are paid and which manufactures cheap paper of lower quality, to
a strategy of investing in the latest technology, for which capital costs will be high but
are offset by the higher quality end product (Interview evidence).
The cost structure of paper manufacture
As the SCOTCH report inventorising EU coated paper production facilities highlights,
the paper industry is a very heterogeneous sector. Plant of different ages are used,
some of this is integrated on site and some is not. Some plant are geographically close
to fibre sources, others not so close. Some sites manufacture a range of paper
products, other sites are more specialised. The result is firms competing which have a
mix of cost structures and a variety of different value chains (see below).
Nevertheless, work done by Jaakko Pöyry has attempted to identify ‘average’ cost
structures for a number of paper products, which may be of use as a comparator in the
IPTS project. At least it gives us an indication of the orders of costs associated with
paper production. This work is briefly introduced here and findings for some paper
products presented.
Jaakko Pöyry are the dominant technical and business consultant to the pulp and paper
industry. They have a collection of industry databases, and it these which they used to
develop average industry cost structures for the last quarter of 1995 (Jaakko Pöyry,
1996). The averages are for geographic regions and selected paper products, and each
average is weighted by a vintage factor which intends to capture the range of plant
ages in each region’s product sector.
Of relevance to IPTS are some competitor regions, Scandinavia, and Western Europe.
Example products presented here are market bleached softwood kraft pulp, virgin
newsprint and recycled newsprint - though average costs for other products are
available.
4
From these it is hoped a (very) approximate idea of paper cost structure in
the EU can be appreciated, particularly relative to non-EU producer regions. The
following tables summarise the Jaakko Pöyry data.
The categories used are:
• Fibrous raw materials (wood, old news papers, and pulp).
• Other raw materials (chemicals, fillers).
• Purchased energy (electrical power, and fuel).
• Other production costs (support services - supplies, marketing, waste disposal
costs, labour, administrative costs).
• Capital charges.
• Delivery costs.
4
Other grades were bleached hardwood pulp, uncoated woodfree sheets, white lined chipboard,
corrugated raw materials, fluting.
Lessons from SCOTCH
Appendix P 2
14
Table 6: comparative cost structures for different regions for bleached softwood pulp
products, 1995.
Country Factor Input
/Unit
Unit price
(US$/unit)
Cost
(US$/tonne
paper)
BSK
Canada
Softwood round (m
3
) 3116 41 127
Softwood chips (m
3
) 2074 33 68
Other raw materials 56
Power (MWh) 346 30 11
Fuel (toe) 367 73 27
Other costs 125
Capital charges 75
Delivery to
Rotterdam
65
TOTAL 554
Scandinavia
Softwood round (m
3
) 4476 53 239
Softwood chips (m
3
) 497 56 28
Other raw materials 53
Power (MWh) (-85) 47 (-4)
Fuel (toe) 12 168 2
Other costs 94
Capital charges 108
Delivery to
Rotterdam
55
TOTAL 575
Latin America
Softwood round (m
3
) 3414 21 72
Softwood chips (m
3
) 1461 23 34
Other raw materials 45
Power (MWh) (-85) 45 (-4)
Fuel (toe) (-32) 150 (-5)
Other costs 59
Capital charges 179
Delivery to
Rotterdam
70
TOTAL 450
Source: Jaakko Pöyry
It must be borne in mind that market pulp and waste paper prices are highly cyclical
around a slightly upward trend. The US$575/ton figure for Scandinavian costs
compares with the US$400-450 claimed for Nordic and North American producers by
Cockram, who suggests sale price needs to be around US$650/ton to generate
‘acceptable’ long-term returns (1998). Since 1995 the spot price has fluctuated
between US$500/ton and US$600. Demand for market pulp has increased for most of
the 25 years, so reasons lie elsewhere (Cockram, 1998). Market pulp price cyclicity is
often attributed to a number of exacerbating factors: its utilisation as a marginal fibre
input (compared to in-house mechanical or chemical fibre inputs), which can vary
with price; integrated mills switching between market and in-house supply, depending
upon market conditions; large capacity of new plant, i.e. large incremental increases;
SPRU - Science and Technology Policy Research
Appendix P 2
15
high capital charges require high levels of operation of plant; and rapid increase in
demand in Asia (stemmed by current problems there) (Jaakko Pöyry, 1995).
Table 7: comparative cost structures for different regions for virgin newsprint
products, 1995.
Country Factor Input
/Unit
Unit price
(US$/unit)
Cost
(US$/tonne
paper)
Virgin Newsprint
Canada
Softwood round (m
3
) 1540 30 47
Softwood chips (m
3
) 975 26 25
Other raw materials 10
Power (MWh) 2300 18 41
Fuel (toe) 0 90 0
Other costs 169
Capital charges 79
Delivery to USA 57
TOTAL 427
Scandinavia
Softwood round (m
3
) 1634 55 90
Softwood chips (m
3
) 589 52 31
BSKP (ADt) 72 806 58
Other raw materials 8
Power (MWh) 2463 34 85
Fuel (toe) 15 169 3
Other costs 88
Capital charges 71
Delivery to Western
Europe
98
TOTAL 531
Russia
Softwood (m
3
) 3000 42 126
BSK (ADt) 30 790 24
Other raw materials 21
Power (MWh) 2115 30 63
Fuel (toe) 330 65 21
Other costs 77
Capital charges 40
Delivery to domestic
markets
35
TOTAL 408
Source: Jaakko Pöyry
Lessons from SCOTCH
Appendix P 2
16
Table 8: comparative cost structures for different regions for recycled newsprint
products, 1995.
Country Factor Input
/Unit
Unit price
(US$/unit)
Cost
(US$/tonne
paper)
Recycled News
USA
Recycled ONP (ADt) 1234 168 207
Other raw materials 27
Power (MWh) 4 49 0
Fuel (toe) 312 64 20
Other costs 159
Capital charges 78
Delivery to domestic
markets
40
TOTAL 531
Western Europe
Recycled ONP (ADt) 1192 218 260
BSKP (ADt) 21 861 18
Other raw materials 40
Power (MWh) 622 79 49
Fuel (toe) 193 217 42
Other costs 173
Capital charges 152
Delivery to domestic
markets
55
TOTAL 789
Source: Jaakko Pöyry
Across all the regions and grades analysed by Jaakko Pöyry, fibre costs accounted for
30-40%, and sometimes over 50%, of total delivery costs. A breakdown of mill level
LWC (coated graphic paper) costs provided by Ionides (1996, p.58) accords with
Jaakko Pöyry analysis. The cost structure for LWC at the mill is: kraft pulp, 44%;
wood (for mechanical pulping on site), 6%; energy, 8%; labour, 20%;
chemicals/coating, 22%. Total cost is estimated at around US$570/ton (1996, p.58).
Sensitivity analysis done by Jaakko Pöyry found total costs were sensitive to fibre
furnish. A 10% change in fibre costs produced a 3-4% change in total cost. Total costs
were slightly less sensitive to energy costs, with a 10% change in the latter producing
a 1% change in the former. This analysis suggests technologies which affect energy or
raw materials will most likely affect overall costs and hence competitiveness. But, of
course, this is highly aggregated analysis. Processing raw fibres and utilising energy
inputs involves a whole series of (sometimes overlapping) clusters of technologies.
Each technology can influence some element of the overall cost structure or, in
Porter’s terms, the product value chain. The data also illustrates what can be
uncovered from literature searches, and equivalent data may well be available for
board and copier paper grades.
Environmental performance in the EU pulp and paper industry
SPRU - Science and Technology Policy Research
Appendix P 2
17
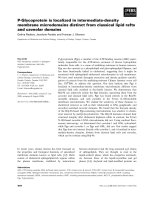
SCOTCH used Life Cycle Analysis modelling techniques to explore the
environmental performance associated with coated paper production. Although a
single generic production system was constructed (see figure 2), effectively two
models were built in order to capture some of the geographic variation in coated paper
production. The first located the manufacture of paper entirely in Scandinavia, from
forestry through chemical, mechanical and deinked pulp production to the
manufacture of paper. The markets were assumed to be in central Europe. The second
model made paper for similar markets but with production split between Scandinavia
and central Europe. Chemical pulp was made in Scandinavia, but both mechanical and
deinked pulp and the coated paper product were made in central Europe. These two
models thus had a number of implications for overall environmental performance with
respect to transport and background energy systems.
Lessons from SCOTCH
Appendix P 2
18
Figure 2: the LCA model for the coated paper production system.
Forest tim ber store
W ood growth, spruce (1995)
Tim ber transport in forest (1995)
Harvesting, reg eneration felling (1995)Harvesting spruce, thinning, (1995)
Forest planting (1995)
H 2 O 2 , m a n u fa c tu r in g ( IIA S A )-C P
NaC lO3, m anufacturing from N aCl (KC L)-CP
O2(gas),on-site, m anufacturing-C P
Bark boiler-CP (1995) - steam production
L im e k i ln - C P (T all o il, 1 9 9 5 )
Bleaching of pulp and washing-CP (1995)
W ood handling-CP (1995)
Oxygen delignification-CP (1995)
Drying of pulp-CP (1995)
Cooking-CP (1995)
W aste w ater treatm ent-CP (1995)
Incinerator-CP (1995)
W ashing and screening-C P (1995)
Recovery boiler-CP (1995)Evaporation-CP (1995)
Remaining energy consum ption-CP (1995)
Oil boiler-CP (1995)-steam production
P re c o m . O il,- C P O il b o il. (1 9 9 5 )
SO 2 incinerator scrubber-CP
Pro cess g as system -C P
Steam system -CP
Chem ical recovery, Causticizing-C P
Electric power system -CP (1995)
H2O2, m anufacturing (IIASA)-TM P
Turbine generator-TMP (1995)
Electric Pow er System -TM P (1995)
B leaching of pulp and w ashing TMP (1995)
W aste w ater treatm en t-TM P (1995)
Drying of pulp-TM P (1995)
O il boiler-TM P (1995)-steam production
Precom bustion, Oil-TMP (1995)
Bark boiler-TM P (1995) - steam production
W ashing and screening-TMP (1995)
Refining-TM P (1995)
Preheating of wood chips-T M P (1995)
W ood handling-TM P (1995)
Steam system -TM P
Drying of pulp-D IP (1995)
Electric power system -DIP (1995)
Steam system -DIP
H 2O 2 , m a n u f a c tu rin g (IIA S A )-D IP
Deinking-DIP (1995)
W ashing and screening-DIP (1995)
Bleaching of DIP (1995)
W aste w ater treatm ent-D IP(1995)
Paper production (1995)
Landfill of paper (1995)Energy recovery - paper com bustion (1995)
Paper use
Electric Power System -Total (1995)
Precom bustion, Oil-DIP (1995)
Oil boiler-DIP (1995)-steam production
Turbine generator-CP (1995)
External steam /heat-W P (1995)
Turbine generator-waste paper com bustion (1995)
E lec tric p o w e r , h y d ro
External use of electric pow er (1995)
External use of steam/heat-Total (1995)
External steam /heat user (1995)
C hina C lay Production (1995)
Electric pow er, n atu ra l ga s, back-p. (1995)
Electric power, ha rd coa l, back -p . (1995)
Electric power, fuel oil, back-p. (1995)
Electric power, nuclear
Sludge system -D IPLandfill-D IP sludge
NaO H production-CP
NaO H production-TM P
NaOH production-DIP
P re c o m . O il, O il b o il. g a in (1 9 9 5 )
O il boiler (1995)-steam gain
Electric power m ixer
Electric pow er, fuel oil, back-p. (1995)-PM
Electric power, natural gas, back-p. (1995)-PM
Electric power, hard coal, back-p. (1995)-PM
Electric power, hydro-PM
Electric power, nuclear-PM
Electric power m ixer-PM
Electric power m ixer-CP Electric power m ixer-TMP
Electric power m ixer-DIP
E le c tric p o w e r , fu e l o il, b a c k -p . (1 9 9 5 ) -C P
Electric power, natural gas, back-p. (1995)-CP
Electric power, hard coal, back-p. (1995)-CP
Electric pow er, hydro-C P
Electric pow er, nuclear-CP
Electric power, nuclear-TM P
Electric power, hydro-TMP
E le c tric p o w e r , h a rd c o al, b a c k - p . (1 99 5 )-T M P
Electric power, na tural ga s, back-p. (1995)-TM P
Electric power, fuel oil, back-p. (1995)-TMP
E le c tric p o w e r , n u cle a r-D IP
Electric power, hydro-DIP
Electric power, hard coal, back-p. (1995)-DIP
Electric power, natural gas, back-p. (1995)-DIP
E lec tric p o w e r , fu e l o il , b a c k -p . (1 9 95 )- D IP
DIP-Local electric power systemTM P-Local electric pow er systemCP-Local electric pow er system
PM -Local electric pow er system
P re c o m . O i l,-n o t in t e g . O il b o il. (1 9 9 5 )
O il bo iler-not integrated (1995)
Forestry (1995)
Production of Chem ical Pulp (Sulphate/kraft pulp), year 1995
Melt
CaO
W hite liquor
Transport to external paper m ill
Steam
Production of Therm o M echanical Pulp (TM P), year 1995
Transport to external paper mill
P ro d uc tio n o f d ein k e d pu lp (D IP ) y e a r 1 9 9 5
[Insert w aste distribution (not deinking)]
[Insert steam/heat distribution,
norm ally according to pulpmix in paper]
[ In ser t steam /hea t to tu r bi n e , fixed va lue]
[Insert distribution of waste steam/heat]
[Insert (balance) electric
[Insert (balance) distribution of pow er production
(not turbine), check for negative inflow s]
[Insert steam/heat distribution to external delivery
(not external waste and landfill of paper)]
- [M J]
Legend:
[Insert paper composition]
- [M J]
[Insert filler sludge part according to paper quality
(a dd itive s) etc. in w a shin g a nd screening]
[Insert relationship between old new spaper
and pulp-DIP (total sludge content etc.)
Insert deinking slud ge par t]
[Insert orga nic part of paper
(check filler content)]
[Insert organic part of paper
(check filler content)]
- [M J]
To paper m achine:
To pulp drying:
- [M J]
- [M J]
- [M J ]
To
p
a
p
er m achine:
To pulp drying:
- [M J]
- [M J]
To paper m achine:
To pulp drying :
[Insert (balance) distribution of pow er production
(not turbine), check for negative inflow s]
[Insert (balance) distribution of pow er production
(n ot tu r b i n e) , c h e c k fo r ne ga tive in flo w s]
[Insert (balance) distribution of power
production, check for negative inflows]
C entral pow er production
- [M J]
- [t9 0 ]
- [kg]
- [k g ]
- [k g ]
- [M J]
- [M J]
- [M J]
- [M J]
- [M J]
- [M J]
- [M J]
[Insert power production distribution]
- [M J]
Local pow er produ ction - C P
Local power production - TM P Local power production - DIP
[Check for back preassure or condens pow er plant]
[Check for back preassure or condens power plant]
[ In sert electr ic po w er to P M ]
Local pow er produ ction - P aper Machine (PM )
[Insert distribution of produced electric power]
- [M J]
- [M J]
-
- [M J] - [M J]
- [M J] - [M J]
- [M J]
- [t9 0 ]
- [t90 ]
- [M J]
- [t90 ]
- [t90 ]
- [t9 0 ]
- [t9 0 ]
- [t9 0 ]
- [m 3]
- [m 3]
- [M J]
- [M J]
Forestry
O utput of steam /heat excess
C entral electric pow er production
C P production
TM P production
DIP production
Landfill
Paper incineration
Local electric pow er production
Paper m achine
El. Power out
SPRU - Science and Technology Policy Research
Appendix P 2
19
The two models were both constructed on the basis of varying technology
performance for different time periods - 1980, 1995, and 2010. Of interest to the IPTS
project is the 2010 model run because here the technology assumptions (i.e. material
flows and environmental performance associated with each technology unit, such as
the bleaching plant or the paper machine) were based on performance data given in
the draft BREF note for BAT under IPPC. It is the result of this modelling run which
is presented in this report - although the finding from the other model runs will also be
made available in the final SCOTCH project report to be sent to IPTS in due course.
Standard industry environmental parameters were used to capture environmental
performance. This means the output of the following substances was collated for the
overall Scandinavian and mixed Scandinavian/central European production systems:
• fossil derived CO
2
emissions;
• biological derived CO
2
emissions (e.g. from burning bark in a boiler);
• NO
x
emissions;
• SO
2
emissions;
• AOX discharges, i.e. total adsorbable organic halogen discharges;
• BOD discharges;
• COD discharges;
• timber consumption; and
• electricity consumption.
Releases for each of these environmental substances were calculated per tonne of
paper produced. The results are presented in the following tables. Given that these are
based on LCA modelling of real technologies but not real production plants, it is not
clear how useful such aggregate data will be to the IPTS project - even more since
they are for coated paper production which assumes a proportion of deinked recycled
fibre content. At the least they are illustrative. For this reason, only summary tables
are presented and model details are not provided - these will be included in the
SCOTCH project final report, a copy of which will be sent to the IPTS research team.
Lessons from SCOTCH
Appendix P 2
20
The Scandinavian modelling results
Table 9: Emission of fossil CO
2
from the entire system divided in the different process
units. Negative values for electric power production indicates that
electric power is delivered for external use and the gain of this is
calculated as a negative emission.
CO
2
emission fossil,
kg/ADt paper
Process unit 1980 1995 2010
Chemical (kraft) pulp 105.2 0.31 0.26
DIP 0 0 11.5
Electric power production 133.6 -27.3 -11.1
Forestry 18.3 14.4 11.4
Paper additive 13.5 15.4 16.8
TMP 636.6 212.6 282.2
Transport 128.4 94.0 102.1
Total net 1035.7 309.4 413.0
Table 10: Emission of biogenic CO
2
from the entire system divided in the different
process units.
CO
2
emission biogenic,
kg/ADt paper
Process unit 1980 1995 2010
Chemical (kraft) pulp 1064.3 765.7 605.8
Electric power production 59.9
Energy recovery-waste 0 228.2 266.2
Landfill 1216.8 912.6 621.1
TMP 39.8 50.8 44.7
Total sum: 2320.9 1957.3 1597.6
Table 11: Emission of NO
X
from the entire system divided in the different process
units.
NO
X
emission,
kg/ADt paper
Process unit 1980 1995 2010
Chemical (kraft) pulp 1.29E+00 7.98E-01 4.30E-01
DIP 0 0 4.21E-02
Electric power production 2.42E-01 -8.78E-03 1.69E-02
Energy recovery-waste 0 2.54E-01 1.18E-01
Forestry 3.35E-01 1.69E-01 6.36E-02
Paper additive 2.52E-02 1.58E-02 4.32E-03
TMP 1.88E+00 5.91E-01 6.19E-01
Transport 2.72E+00 1.64E+00 4.75E-01
Total sum: 6.50 3.46 1.77
SPRU - Science and Technology Policy Research
Appendix P 2
21
Table 12: Emission of SO
2
from the entire system divided in the different process
units.
SO
2
emission,
kg/ADt paper
Process unit 1980 1995 2010
Chemical (kraft) pulp 1.65E+00 2.65E-01 1.56E-01
DIP 0 0 8.94E-03
Electric power production 8.34E-01 3.67E-02 2.97E-02
Energy recovery-waste 0 1.35E-01 1.58E-01
Forestry 4.31E-02 2.84E-03 1.18E-03
Paper additive 1.98E-02 7.66E-03 2.70E-04
TMP 7.51E+00 6.68E-01 2.09E-01
Transport 1.04E+00 8.56E-01 1.38E-02
Total sum: 11.09 1.97 0.58
Table 13: Water emission of AOX from the sulphate pulp production. The emissions
originate from the bleaching of the pulp and are emitted via the waste water treatment
plant.
AOX emission,
kg/ADt paper
Process unit 1980 1995 2010
AOX-Chemical (kraft) pulp 2.21E+00 6.09E-02 3.50E-02
Table 14: Water emission of BOD from different process units.
BOD emission,
kg/ADt paper
Process unit 1980 1995 2010
Chemical (kraft) pulp 3.44E+00 1.99E+00 2.50E-01
DIP 0 0 1.51E-02
Landfill 1.80E+00 1.35E+00 9.19E-01
TMP 6.40E-01 2.95E-02 5.78E-03
Total sum: 5.88 3.37 1.19
Table 15: Water emission of COD from different process units.
COD emission,
kg/ADt paper
Process unit 1980 1995 2010
Chemical (kraft) pulp 2.40E+01 1.05E+01 2.63E+00
DIP 0 0 1.40E-01
Landfill 7.20E+00 5.40E+00 3.68E+00
TMP 2.40E+00 5.27E-01 1.23E-01
Total sum: 33.61 16.42 6.56
Lessons from SCOTCH
Appendix P 2
22
Table 16: Consumption of timber for the paper production divided in supply to the
two virgin fibre processes - CP and TMP.
Timber use,
m
3
/ADt paper
1980 1995 2010
Timber to CP 4.19 2.93 2.34
Timber to TMP 1.35 1.52 1.18
Total sum: 5.54 4.45 3.52
Table 17: Electric power balance of the entire system.
Electric power,
MJ/ADt paper
1980 1995 2010
External supply 8590 9014.8 6920.7
Internal supply 434.8 1100 1278
External delivery 0 -539.3 -666.2
Net use of electric power 9024.8 9575.5 7532.5
Mixed Scandinavian/central European modelling results
Table 18: Emission of fossil CO
2
from the entire system divided in the different
process units.
CO
2
emission fossil,
kg/ADt paper
Process unit 1980 1995 2010
Chemical (kraft) pulp 1.05E+02 2.55E-01 1.53E-01
DIP 0 1.31E+01 2.87E+01
Electric power production 1.75E+03 1.23E+03 7.41E+02
Forestry 1.83E+01 1.23E+01 7.83E+00
Paper additive 1.35E+01 1.54E+01 1.68E+01
TMP 6.37E+02 2.52E+02 3.15E+02
Transport 1.43E+02 8.96E+01 7.47E+01
Total 2670.9 1617.4 1183.8
Table 19: Emission of biogenic CO
2
from the entire system divided in the different
process units.
CO
2
emission biogenic,
kg/ADt paper
Process unit 1980 1995 2010
Chemical (kraft) pulp 1064.3 638.1 363.5
Electric power production 0 0 15.7
Energy recovery-waste 0 193.1 186.3
Landfill 1216.8 772.2 434.8
TMP 39.8 45.1 38.3
Total 2320.9 1648.5 1038.5
SPRU - Science and Technology Policy Research
Appendix P 2
23
Table 20: Emission of NO
X
from the entire system divided in the different process
units.
NO
X
emission,
kg/ADt paper
Process unit 1980 1995 2010
Chemical (kraft) pulp 1.29E+00 6.65E-01 2.58E-01
DIP 0 4.85E-02 1.05E-01
Electric power production 3.07E+00 6.42E-01 3.03E-01
Energy recovery-waste 0 2.15E-01 8.27E-02
Forestry 3.35E-01 1.44E-01 4.36E-02
Paper additive 2.52E-02 1.58E-02 4.32E-03
TMP 1.88E+00 6.56E-01 6.63E-01
Transport 2.73E+00 1.00E+00 3.41E-01
Total 9.34 3.39 1.80
Table 21: Emission of SO
2
from the entire system divided in the different process
units.
SO
2
emission,
kg/ADt paper
Process unit 1980 1995 2010
Chemical (kraft) pulp 1.65E+00 2.21E-01 9.36E-02
DIP 0 3.96E-02 2.24E-02
Electric power production 7.58E+00 5.99E-01 1.58E-01
Energy recovery-waste 0 1.14E-01 1.10E-01
Forestry 4.31E-02 2.42E-03 8.11E-04
Paper additive 1.98E-02 7.66E-03 2.70E-04
TMP 7.51E+00 7.91E-01 2.30E-01
Transport 6.15E-01 2.02E-01 9.94E-03
Total 17.42 1.98 0.63
Table 22: Water emission of AOX from the sulphate pulp production. The emissions
originate from the bleaching of the pulp and are emitted via the waste water treatment
plant.
AOX emission,
kg/ADt paper
Process unit 1980 1995 2010
Chemical (kraft) pulp 2.208 0.051 0.021
Table 23: Water emission of BOD from different process units.
BOD emission,
kg/ADt paper
Process unit 1980 1995 2010
Chemical (kraft) pulp 3.44E+00 1.66E+00 1.50E-01
DIP 0 1.86E-02 3.77E-02
Landfill 1.80E+00 1.14E+00 6.43E-01
TMP 6.40E-01 2.62E-02 4.95E-03
Total 5.880 2.845 0.836