The green and blue water footprint of paper products: Methodological considerations and quantification ppt
Bạn đang xem bản rút gọn của tài liệu. Xem và tải ngay bản đầy đủ của tài liệu tại đây (573.88 KB, 36 trang )
P.R. van Oel
A.Y. Hoekstra
July 2010
The green and blue water
footprint of paper products:
Methodological considerations
and quantification
Value of Water
Research Report Series No. 46
THE GREEN AND BLUE WATER FOOTPRINT OF PAPER PRODUCTS:
METHODOLOGICAL CONSIDERATIONS AND QUANTIFICATION
P.R. VAN OEL1
A.Y. HOEKSTRA2
JULY 2010
VALUE OF WATER RESEARCH REPORT SERIES NO. 46
1
2
ITC, University of Twente, Enschede, The Netherlands, Pieter van Oel,
Water Engineering and Management Department, University of Twente, Enschede, The Netherlands,
© 2010 P.R. van Oel and A.Y. Hoekstra.
Published by:
UNESCO-IHE Institute for Water Education
P.O. Box 3015
2601 DA Delft
The Netherlands
The Value of Water Research Report Series is published by UNESCO-IHE Institute for Water Education, in
collaboration with University of Twente, Enschede, and Delft University of Technology, Delft.
All rights reserved. No part of this publication may be reproduced, stored in a retrieval system, or transmitted, in
any form or by any means, electronic, mechanical, photocopying, recording or otherwise, without the prior
permission of the authors. Printing the electronic version for personal use is allowed.
Please cite this publication as follows:
Van Oel, P.R. and Hoekstra, A.Y. (2010) The green and blue water footprint of paper products: methodological
considerations and quantification, Value of Water Research Report Series No. 46, UNESCO-IHE, Delft, the
Netherlands.
Contents
Summary................................................................................................................................................................. 5
1. Introduction ........................................................................................................................................................ 7
2. Method................................................................................................................................................................ 9
2.1 Estimating the water footprint of paper products......................................................................................... 9
2.2 Estimating the water footprint of paper consumption in a country ............................................................ 15
3. Results .............................................................................................................................................................. 17
3.1 The water footprint of paper products........................................................................................................ 17
3.2 The water footprint of paper consumption in the Netherlands................................................................... 20
4. Discussion......................................................................................................................................................... 23
5. Conclusion........................................................................................................................................................ 27
References ............................................................................................................................................................ 28
Summary
For a hardcopy of this report, printed in the Netherlands, an estimated 200 litres of water have been used. Water
is required during different stages in the production process, from growing wood to processing pulp into the
final consumer product. Most of the water is consumed in the forestry stage, where water consumption refers to
the forest evapotranspiration. The water footprint during the manufacturing processes in the industrial stage
consists of evaporation and contamination of ground- and surface water. In this report we assess water
requirements for producing paper products using different types of wood and in different parts of the world. We
quantify the combined green and blue water footprint of paper by considering the full supply chain; we do not
include the grey water footprint in this study.
The water footprint of printing and writing paper is estimated to be between 300 and 2600 m3/ton (2-13 litres for
an A4 sheet). These figures account for the paper recovery rates as they currently are. The exact amount
depends on the sort and origin of the paper used for printing. Without recovery, the global average water
footprint of paper would be much larger; by using recovered paper an estimated 40% is saved globally. Further
saving can be achieved by increasing the recovery percentages worldwide. For countries with a low recovered
paper utilization rate a lot of room for reduction still remains. Some countries such as the Netherlands, Spain
and Germany already use a lot of recovered paper. In addition, the global water footprint of paper can be
reduced by choosing production sites and wood types that are more water-efficient.
The findings presented in this report can be helpful in identifying the opportunities to reduce water footprints of
paper consumption. This report also shows that the use of recovered paper may be very helpful in reducing
water footprints.
1. Introduction
Forests are renewable resources that are key to the production of paper, since the main ingredient of paper is
wood pulp (cellulose). Next to their importance for paper, forests are important for the production of other
goods, such as timber and firewood, the conservation of biodiversity, the provision of socio-cultural services
and carbon storage. Forests also play a vital role in catchment hydrology. Deforestation and afforestation affect
hydrological processes in a way that may directly influence water availability. It is for instance well established
that a reduction in runoff is expected with afforestation on grasslands and shrublands (e.g. Fahey and Jackson,
1997; Farley et al., 2005; Jackson et al., 2005; Wilk and Hughes, 2002).
Large amounts of freshwater are required throughout the supply chain of a product until the moment of
consumption. For quantifying this amount, the water footprint concept can be used (Hoekstra and Chapagain,
2007b; 2008). The water footprint of a product is defined as the total amount of freshwater that is needed to
produce it. The water footprint can contain green, blue and grey components. The green component is the
volume of water evaporated from rainwater stored in or on the vegetation or stored in the soil as soil moisture.
The blue component refers to evaporated surface and ground water. The grey component is the volume of
polluted ground- and surface water. An increasing number of publications on virtual-water trade and water
footprint of consumer products has emerged in recent years (Chapagain and Hoekstra, 2007; 2008; Chapagain et
al., 2006a; 2006b; Gerbens-Leenes et al., 2009; Hoekstra and Chapagain, 2007a; 2007b; 2008; Hoekstra and
Hung, 2005; Liu and Savenije, 2008; Liu et al., 2008; 2007; Ma et al., 2006; Van Oel et al., 2009). So far, the
water footprint of paper products has not been studied in enough detail to reflect on its claims on water
resources. There are several product-specific issues that have to be addressed in order to come to a fair
assessment of the water footprint of paper products. In this report the main issues are addressed and some ways
to deal with them are proposed and discussed.
In this report, a method for determining the water footprint of paper products at the national level is proposed
that takes into account both the forestry and the industrial stage of the production process. The scope is limited
to a study of consumptive water use – considering both the green and blue water footprint. We do not consider
the grey water footprint in this report. First, we estimate the water footprint of paper products produced using
pulp from the main pulp producing countries in the world. We take into account the use of recovered paper.
Second, a method for the quantification of the water footprint of paper products that are consumed in a specific
country is presented and applied for the Netherlands.
2. Method
2.1 Estimating the water footprint of paper products
The water footprint during the forestry stage contains both a green and blue component. These two components
cannot easily be determined separately as trees use rainfall water and tap from groundwater resources
simultaneously. Therefore, in the scope of this study, we estimate the green and blue water footprint of paper
products as a total sum. During the industrial stage there is only a blue water footprint. The water footprint of a
paper product p (expressed in m3/ton) is estimated as follows:
WF [ p ] = WF forestry [ p ] + WFindustry [ p ]
The water footprint of a paper product for the forestry stage is estimated as follows:
⎛ ET + (Ywood × f water ) ⎞
WF forestry [ p ] = ⎜ a
⎟ ⋅ f paper × f value × (1 − f recycling )
Ywood
⎝
⎠
in which ETa is the actual evapotranspiration from a forest/woodland (m3/ha/year), Ywood the wood yield from a
forest/woodland (m3/ha/year), fwater the volumetric fraction of water in freshly harvested wood (m3/m3), fpaper the
wood-to-paper conversion factor (i.e. the harvested volume needed to produce a metric ton of paper product
(m3/ton), fvalue the fraction of total value of the forest which is associated with paper production (dimensionless)
and frecycling the fraction of pulp derived from recycled paper (dimensionless). Note that the wood-to-paper
conversion factor relates to the so-called product fraction (fp, mass/mass) that is used in the standard calculation
of a product water footprint (Hoekstra et al., 2009). The two parameters relate as follows:
f paper =
1
fp × ρ
with ρ being the density of harvested wood (ton/m3).
The water footprint of a paper product for the industrial stage is estimated as follows:
WFindustry [ p ] = E + R + P
in which E is the evaporation in the production process (m3/ton), R the water contained in solid residuals
(m3/ton) and P the water contained in products (m3/ton).
10 / The green and blue water footprint of paper products
Step 1: Estimating evapotranspiration (ETa) by forest type and by country
There are several factors that influence evapotranspiration from forest biomes, including meteorological
conditions, tree type and forest management. To get an overview of evapotranspiration from forests at the global
level, use is made of two data sources that are both obtained from FAO GeoNetwork (Figure 1):
-
The World's Forests 2000 (FAO, 2001): this dataset is based on 1992-93 and 1995-96 AVHRR data and
gives global distribution of forest biomes at a resolution of 1 km. Five different forest types are
distinguished: boreal (typical trees include pine, fir, and spruce), tropical (typical trees include eucalyptus),
sub-tropical, temperate (typical trees include oak, beech and maple) and polar forest. Different forest types
can be present in one country. For its low relevance, polar forests have been ignored.
-
Annual actual evapotranspiration (FAO, 2009b): this dataset contains annual average values for the period
1961-1990 at a resolution of 5 arc minutes.
Figure 1. Top: annual actual evapotranspiration (FAO, 2009b). The dataset contains yearly values for global land
areas for the period 1961-1990. Bottom: The World's Forests 2000 (FAO, 2001) This database is based on 199293 and 1995-96 AVHRR data.
The green and blue water footprint of paper products / 11
With these data it is possible to obtain a rough estimate of annual evapotranspiration values for forests in most
countries of the world. Country averages are determined by averaging all values of actual evapotranspiration in
a country for all locations that are covered with closed forest. For calculating the water footprint of paper
products, evapotranspiration values for the 22 main global producers of pulp (FAO, 2009a) are determined.
Together, these countries produced 95% of globally produced pulp for the period 1998-2007. The locations from
which wood is actually obtained remain unclear from statistics on pulp production. Therefore it is difficult to
relate the right amount of evapotranspiration to the production of pulp. Due to a lack of detailed spatial
information, in this study ranges of possible evapotranspiration values are presented, rather than estimates for
actual forestry locations. Besides uncertainties on locations of origin within a producing country, also import
from other countries may be important. Paper mills in Sweden, for example, use 75% of wood that originates
from Sweden itself; the other 25% is imported from Latvia, Estonia and Lithuania (Gonzalez-Garcia et al.,
2009). These pre-processing international trade flows are not taken into account in this study.
Table 1 shows the average annual evapotranspiration for the main pulp producing countries by forest type. If
only one forest type exists in a country, only one value will be considered. If more than one forest type exists,
the values of all forest types are given. For large countries covering several climatic zones, such as the USA,
values of evapotranspiration may vary considerably.
Table 1. Contribution to annual pulp production and estimates for average actual annual evapotranspiration by
forest type in the main pulp-producing countries.
Average actual annual evapotranspiration by forest type
(mm/year)**
Boreal
Temperate
Subtropical
Tropical
Contribution to
global pulp
production*
Share of
chemical pulp*
USA
29.5%
85%
278
516
Canada
13.5%
52%
358
360
-
-
China
9.2%
11%
370
416
608
547
Finland
6.5%
60%
355
293
-
-
Sweden
6.3%
69%
345
318
-
-
Japan
5.9%
87%
-
637
725
1048
Pulp producing
country
635
1730
Brazil
4.8%
93%
-
-
965
Russia
3.3%
74%
310
362
-
-
Indonesia
2.4%
93%
-
-
-
1071
India
1.7%
37%
-
-
455
551
Chile
1.6%
86%
-
567
578
-
France
1.3%
67%
-
401
386
-
Germany
1.3%
44%
-
363
-
-
Norway
1.2%
26%
328
303
-
-
Portugal
1.0%
100%
-
512
502
-
Spain
1.0%
93%
-
547
527
-
South Africa
1.0%
72%
-
-
819
762
Austria
0.9%
76%
-
344
-
-
New Zealand
0.8%
45%
-
491
630
-
Australia
0.6%
50%
-
768
775
818
Poland
0.6%
76%
-
377
-
-
Thailand
0.5%
86%
-
-
-
636
Total
94.8%
* Data source: annual averages for the period 1996-2005 based on FAOSTAT data (FAO, 2009a).
** Data sources: national averages estimates based on grid data from FAO (2001; 2009b).
12 / The green and blue water footprint of paper products
Step 2: Estimating wood yield (Ywood)
For this study it has been assumed that the wood used for the production of wood pulp is harvested at a rate
corresponding to the maximum sustainable annual yield from productive forests with wood production as its
primary function. We will reflect upon this approach in the discussion section. Data on wood products are
obtained from the Global Forest Resources Assessment 2005 (FAO, 2006). The estimates used in this study are
presented in Table 2. Tree types are categorized into pine, eucalyptus and broadleaves. In this study the
following assumptions are made for tree types in different forest biomes:
-
Boreal forests yield pine
-
Temperate forests yield broadleaves and pine
-
Subtropical and tropical forests yield eucalyptus
Table 2. Wood yield estimates for the main pulp-producing countries.
3
Pulp producing country
Wood yield estimates (m /ha/year)*
Broadleaves
Eucalyptus
Pine
USA
7***
16***
6
Canada
7***
6**
China
6
Finland
7
6
Sweden
7**
8**
Japan
11
14
Brazil
20
45
Russia
7***
Indonesia
6
4
7**
8***
19
India
10
Chile
22
26
19
France
7**
16**
9
Germany
7**
8**
Norway
7**
8**
Portugal
7**
16**
8**
Spain
7**
16**
8**
South Africa
11
23
Austria
7**
New Zealand
14
19**
15
14**
19
12
Australia
Poland
8**
8
Thailand
7
14**
* Data source: FAO (2006).
** Continental averages from available data are assumed.
*** European continental averages are used. In the case of Canada and the United States this is due to a lack of available data.
For Russia, a European average is assumed to be more representative than the Asian continental average.
Step 3: Fraction of water in harvested wood (fwater)
Generally this fraction is around 0.4 m3 of water per m3 of freshly harvested wood (Gonzalez-Garcia et al.,
2009; NCASI, 2009). A large part of the water may be returned to surface or ground water during the industrial
manufacturing process. It is however removed from the forest area and should therefore be accounted for in the
water footprint in the forestry stage.
The green and blue water footprint of paper products / 13
Step 4: Wood-to-paper conversion factors (fpaper)
This is the amount of wood needed to produce a certain mass of paper product (m3/ton). Estimates for important
products are obtained from the UNECE conversion factors report (UNECE/FAO, 2010). The main conversion
factors are summarized in Table 3. The product categories used in this study are based on the categories as used
in the ForestSTAT database (FAO, 2009a). For different kinds (and qualities) of paper different types of pulp
are used. The pulp differs according to the type of pulping technique that is applied. In this study no differences
are made for different tree types.
Table 3. Wood-to-paper conversion factors.
Product
Mechanical Wood Pulp
FAO product code
(FAO, 2009a)
1654
ITC product group codes used
(ITC, 2006)
2512
Conversion factors based on
3
UNECE/FAO (2010) (m /ton)
2.50
2.67
Semi-Chemical Wood Pulp
1655
25191
Chemical Wood Pulp
1656
2514, 2515, 2516
4.49
Dissolving Wood Pulp
1667
2513
5.65
Recovered Paper
1669
2511
Newsprint
1671
6411
2.87
Printing & Writing Paper
1674
6412, 6413
3.51
Other Paper & Paperboard
1675
6414, 6415, 6416, 6417, 6419, 642
3.29
Step 5: Estimating the fraction of total value of the forest associated with paper production (fvalue)
Forests generally serve multiple functions, one of which may be the production of paper products. Others may
be the production of timber, biodiversity conservation and carbon storage. Therefore, not all evapotranspiration
from a forest should necessarily be attributed to the production of paper products. A value fraction (Hoekstra et
al., 2009) could be determined to allocate the amount of water to be allocated to the production of wood pulp for
a forest with n functions, including the production of wood pulp:
f value [ pulp ] =
value [ pulp ]
n
∑ value [i ]
i =1
In this study it is assumed that paper is produced from forests that have wood production as the primary function
and for which annual growth is equal to annual harvest, so we assume the value fraction to be equal to 1. We
will come back to this issue in the discussion section.
Step 6: Estimating the fraction of pulp derived from recovered paper (frecycling)
Recycling is an important factor for the water footprint, because fully recycled paper avoids the use of fresh
wood and thus nullifies the water footprint in the forestry stage. When more recovered paper is used, the overall
water footprint will decrease. On average an estimated 41% of al produced pulp is obtained from recycled paper
(FAO/CEPI, 2007; UNECE/FAO, 2010), with large differences between producers using no recycled paper at
all to producers that achieve relatively high percentages. We obtained the ‘recovered paper utilization rates’ for
the main pulp producing countries from FAO/CEPI (2007). The ‘recovered paper utilization rate’ is the amount
of recovered paper used for paper and paperboard as a percentage of paper and paperboard production. Losses in
repulping of recovered paper are estimated to be between 10 and 20 percent (FAO/CEPI, 2007). In this study, 15
14 / The green and blue water footprint of paper products
percent is used for all countries. The values used in this study are summarized in Table 4. The product
categories for which recycling is taken into account are only the consumer product categories (i.e. newsprint,
‘printing & writing paper’ and ‘other paper & paperboard’), since these are the only categories for which it is
actually used.
Table 4. Recovered paper utilization rates and frecycling for the main pulp-producing countries.
Country
Recovered paper utilization rate*
USA
0.37
Fraction of pulp derived from
recycled paper (frecycling)**
0.31
Canada
0.24
0.20
China
0.42*
0.36
Finland
0.05
0.04
Sweden
0.17
0.14
Japan
0.61
0.52
Brazil
0.40
0.34
Russia
0.42***
0.36
Indonesia
0.42***
0.36
India
0.42***
0.36
Chile
0.42
0.36
France
0.60
0.51
Germany
0.67
0.57
Norway
0.22
0.19
Portugal
0.21
0.18
Spain
0.85
0.72
0.42***
0.36
South Africa
Austria
0.46
0.39
New Zealand
0.25
0.21
Australia
0.64
0.54
Poland
0.36
0.31
Thailand
0.59
0.50
Average of main pulp producing countries
0.42
0.36
0.70
0.60
Netherlands
* Data source: FAO/CEPI (2007).
** 85% of recovered paper utilization rate assumed due to loss in processing.
*** When no data are available for the individual country, the average of the other countries is used.
Step 7: Estimating the water footprint of paper products in the forestry stage
For a quantification of the water footprint of paper products in the forestry stage, estimates for the main pulp
producing countries are made, as listed in Table 1.
Step 8: Estimating the water footprint of paper products in the industrial stage
The water footprint of paper products in the industrial stage of production is estimated based on the case of the
USA, considering the country’s paper and pulp production sector as a whole (NCASI, 2009). The USA is the
largest producer of paper pulp and is assumed to be representative for the global paper industry. In this study no
comparison is made between different techniques and processes that may be used in producing pulp.
The green and blue water footprint of paper products / 15
2.2 Estimating the water footprint of paper consumption in a country
Many countries strongly depend on imports of pulp and paper. For those countries it is relevant to know the
water footprints of the imported products and where these water footprints are located. This will be shown in a
case study for the Netherlands. As a basis, we use data on the annual production, import, export and
consumption of paper for the Netherlands as shown in Table 5.
Table 5. Annual production, import, export and consumption for the Netherlands for the period 1996-2005.
Product
Pulp
1654-56, 1667
FAO code
Newsprint
1671
Production (ton/year)*
Printing & writing
paper
1674
Other paper &
paperboard
1675
125350
387700
895400
1987200
Import quantity (ton/year)*
1132860
476540
1267890
1498200
Export quantity (ton/year)*
322340
259480
1143450
1417900
935870
604760
1019840
2067500
Consumed (ton/year)
* Source: ForestStat (FAO, 2009a).
A weighted average for all import partners is made for a few different paper products, similar to the way it is
done by van Oel et al. (2009) and Hoekstra et al. (2009). Data on imports specified by trade partner are used
from the International Trade Centre (ITC, 2006). Table 3 shows the product categories used for estimating the
water footprints of imported paper products. The average water footprint WF* of a paper product p consumed in
the Netherlands (NL) is estimated by assuming that:
m
WF *[ NL, p ] =
P[ NL] × WF [ NL, p ] + ∑ ( I [c] × WF [c, p ])
c =1
m
P[ NL] + ∑ I [c ]
c =1
in which WF[NL,p] is the water footprint of paper product p produced in the Netherlands using Dutch pulp;
WF[c,p] the water footprint of paper product p produced in the Netherlands using pulp from country c; P[NL]
the production of wood equivalents in the Netherlands, and I[c] the import of wood equivalents into the
Netherlands from country c. The various sorts of pulp produced in and imported into the Netherlands are
expressed in wood equivalents using the conversion factors as shown in Table 3. The assumption here is that
paper products are based on domestic and imported pulp according to the ratio of domestic pulp production to
pulp import. On the Dutch market, in the period 1996-2005, 6% of the available pulp (expressed in terms of
wood equivalents) had domestic origin; the remaining 94% was imported.
3. Results
3.1 The water footprint of paper products
The evapotranspiration per volume of harvested wood for the main pulp producing countries is shown in Table
6. The water footprint of paper products is shown in Tables 7-9. Country-specific recycling percentages are
incorporated in these values. The lowest estimate for printing & writing paper is 321 m3/ton (eucalyptus from
subtropical biome in Spain) and the highest value is 2602 m3/ton (eucalyptus from tropical biome in the USA),
corresponding to 2 and 13 litres per sheet of standard A4 copy paper respectively. If no recovered paper would
have been used, these values would become 753 m3/ton (eucalyptus from subtropical biome in Brazil) for the
lower estimate and the higher estimate would be 3880 m3/ton (eucalyptus from subtropical biome in China). For
one sheet of A4 copy paper this means 4 and 19 litres respectively.
Table 6. Water footprint of harvested wood for the main pulp-producing countries.
3
3
Eucalyptus from
Subtropical biome
397
1081
1105
995
463
860
Canada
597
600
525
China
891
1001
693
Finland
592
488
451
Sweden
413
381
463
859
571
434
528
Japan
Brazil
Russia
527
214
371
Eucalyptus from
Tropical biome
USA
Pulp producing
country
Pines from
Temperate biome
752
Pines from Boreal
biome
Broadleaves from
Temperate biome
Water footprint for different trees and places of origin (m /m )
Indonesia
233
564
India
455
Chile
298
262
France
446
584
241
Germany
435
551
222
529
Norway
363
442
Portugal
393
613
746
314
Spain
655
797
329
Austria
412
501
New Zealand
335
351
338
Australia
662
549
415
Poland
539
459
South Africa
Thailand
356
331
438
463
18 / The green and blue water footprint of paper products
Table 7. Water footprint of newsprint (m3/ton), taking into account country-specific recovered paper utilization
rates.
Country
USA
Pine from boreal
biome
912
Pine from
temperate biome
1692
Broadleaf from
temperate biome
1479
Canada
1363
1371
1648
1852
1282
Finland
1626
1342
1015
935
789
802
1840
1138
1187
2045
1239
Sweden
Eucalyptus from
tropical biome
2127
1199
China
Eucalyptus from
subtropical biome
781
976
Japan
Brazil
Russia
729
406
687
Indonesia
441
1043
India
842
Chile
551
483
France
627
822
339
Germany
537
1019
410
654
Norway
917
1030
1759
740
522
635
262
720
Spain
847
1446
Portugal
876
South Africa
659
Austria
New Zealand
757
793
763
Australia
866
718
543
1073
613
914
Poland
Thailand
573
662
Table 8. Water footprint of ‘printing & writing paper’ (m3/ton), taking into account country-specific recovered paper
utilization rates.
Country
USA
Pine from boreal
biome
1115
Pine from
temperate biome
2069
Broadleaf from
temperate biome
1809
Canada
1667
1676
2015
2266
1568
Finland
1988
1641
1241
2501
2250
1515
Sweden
Eucalyptus from
tropical biome
2602
1466
China
Eucalyptus from
subtropical biome
955
1144
1392
1452
Japan
965
981
1193
Brazil
Russia
891
497
840
Indonesia
540
1275
India
1029
Chile
674
591
502
France
766
1005
415
Germany
657
1246
799
Norway
Portugal
Spain
1121
1036
1260
1769
2151
638
776
South Africa
Austria
New Zealand
905
321
806
881
749
1072
925
969
933
Australia
1060
878
665
Poland
1312
1118
Thailand
701
809
The green and blue water footprint of paper products / 19
Table 9. Water footprint of ‘other paper & paperboard’ (m3/ton), taking into account country-specific recovered
paper utilization rates.
Country
USA
Pine from boreal
biome
1045
Pine from
temperate biome
1940
Broadleaf from
temperate biome
1696
Canada
1563
1571
1889
2124
1864
1538
1163
1072
1304
1361
904
920
2109
1420
Sweden
2344
1470
Finland
Eucalyptus from
tropical biome
2439
1374
China
Eucalyptus from
subtropical biome
895
1119
Japan
835
Brazil
Russia
466
787
Indonesia
506
1195
India
965
Chile
631
554
France
718
942
389
Germany
616
1168
470
749
Norway
Portugal
Spain
1051
971
1181
1658
2017
848
598
728
301
826
1004
South Africa
Austria
755
New Zealand
867
909
874
Australia
993
823
623
1230
702
1048
Poland
Thailand
657
759
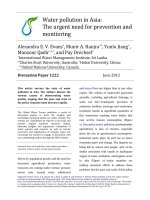
Water footprint of paper products in industrial stage – example USA
In the USA, annual industrial production of paper products is around 97×106 ton/year. The total water use for the
main water consumption categories is: E = 507×106 m3, R = 19×106 m3, P = 10×106 m3 (Figure 2). A rough
estimate then gives an average value of 5.5 m3/ton for a paper product.
Return flow to surface water
6
3
5144×10 m
Return flow to groundwater
3
0m
Surface water
6
3
4736×10 m
Groundwater
6
3
787×10 m
Water in wood
6
3
145×10 m
Other water inputs
6
3
8×10 m
Included in WFIndustry
Industrial processes
Production of pulp and paper products
6
97×10 ton
Recycling 5×10 m
6
3
Evaporation
6
3
507×10 m
Water in solid residuals
6
3
19×10 m
Water in products
6
3
10×10 m
Figure 2. Water flows in the paper and pulp industry in the USA (NCASI, 2009).
20 / The green and blue water footprint of paper products
3.2 The water footprint of paper consumption in the Netherlands
The Dutch water footprint related to the consumption of paper products is significant if compared to the
footprint related to the consumption of other products. The water footprint of paper products is estimated to
constitute 8-11% of the total water footprint of Dutch consumption (Van Oel et al., 2009). Figure 3 gives a
summary of the water footprint accounts for the Netherlands insofar related to paper consumption, production
and trade. Minimum and maximum estimates are given to account for the fact that paper products in the
countries of origin can have a low or high water footprint depending on the biome from which the wood is
derived (Tables 7-9).
Table 10 shows the water footprint of paper products in the Netherlands, whereby a distinction is made between:
(i) paper produced from trees grown in the Netherlands, (ii) imported paper to the Netherlands or paper
produced from imported pulp, and (iii) the weighed average. The water footprint of paper products produced
from trees grown in the Netherlands is substantially lower (two to three times) than that of imported paper or
paper produced from imported pulp. Most of the imported pulp originates from other European countries (85%),
followed by North America (12%) (Figure 4).
If countries from which the Netherlands import pulp and paper would not recover paper as they currently do
(Table 4) and if also the Netherlands itself would not recover paper, the water footprint of paper products
consumed in the Netherlands would be 4.9-7.1 Gm3/yr. Using recovered paper according to current rates has
thus resulted in a water saving of 36%. For the Netherlands, the water footprint of a standard A4 copy paper (80
gram/m2) is between 5 and 7 litres (7-10 litres if no recovered paper is used).
Ve, r
Ve, d
Ve
3
3
3
Min 1.8Gm + Min 0.0Gm = Min 1.8Gm
3
3
3
Max 2.9Gm
Max 0.0Gm
Max 2.9Gm
+
+
Ve,r
+
WFcons,nat,ext
WFcons,nat,int
WFcons,nat
=
=
WFcons,nat,ext
WFcons,nat,int
WFcons,nat
3
3
3
Min 3.1Gm + Min 0.1Gm = Min 3.2Gm
3
3
3
Max 4.5Gm
Max 0.1Gm
Max 4.6Gm
=
Ve
Ve,d
Vi
Vb
WFarea,nat
3
Min 4.9Gm + Min 0.1Gm3 = Min 5.0Gm3
3
3
3
Max 7.4Gm
Max7.5Gm
Max 0.1Gm
Vi
WFarea,nat
Vb
Figure 3. Summary of the water footprint accounts for the Netherlands insofar related to paper consumption,
production and trade: virtual-water import (Vi), virtual-water export (Ve), the water footprint within the area of the
nation (WFarea,nat) the water footprint related to national consumption (WFcons,nat), the external water footprint
(WFcons,nat,ext), the internal water footprint (WFcons,nat.int), the virtual-water re-export (Ve,r) and the virtual-water
export from domestic production (Ve,d). The numbers in the boxes are minimum and maximum estimates for the
period 1996–2005.
The green and blue water footprint of paper products / 21
Table 10. Water footprint of paper products in the Netherlands.
3
Water footprint (m /ton)
Origin
Lower estimate
Higher estimate
Newsprint
Paper produced from trees grown in the Netherlands
369
410
Printing & writing paper
451
501
Other paper & paper board
423
470
Newsprint
829
1144
994
1402
848
1267
Imported paper to the Netherlands or paper produced from
Printing & writing paper
imported pulp
Other paper & paper board
Newsprint
802
1101
Printing & writing paper
962
1349
Other paper & paper board
Average paper as on the Dutch market*
823
1221
* For the production of these products in the Netherlands it is assumed that pulp is used from imported and domestic sources
in the same ratio as they are available (imported + produced). Around 94% of the available pulp in the Netherlands is imported.
Figure 4. Virtual-water imports to the Netherlands by continent related to the import of pulp and paper.
4. Discussion
Allocation of forestry evapotranspiration to harvested wood. The water footprint is an indicator that takes into
account the total use of freshwater for the production of a product. In the case of paper production from wood
from a forest, it is not immediately clear what approach can best be chosen. Wood is harvested only after a
number of years of growth. One could thus consider the evapotranspiration over the whole period from planting
a forest until cutting it down and attribute that total evapotranspiration to the harvested wood. In practice,
however, at a bit larger spatial scale, one can consider harvesting as an annual activity. Assuming a more or less
stable demand for forestry products and a reasonable extent of sustainable forestry management practices, a
rational approach is to relate the average annual evapotranspiration from the forest to the maximum sustainable
annual yield. The maximum sustainable annual yield is the maximum annual yield that can be obtained for an
infinite period of time. When actual yields from a forest are lower than the maximum sustainable annual yield
(e.g. incidental wood harvesting in a non-production forest), it would be fair to attribute only a fraction of the
annual evapotranspiration from the forest to the harvested wood, since the primary function of the forest is
apparently other than for wood production. The fraction could be taken equal to Yact/Ymax. In the case of a forest
harvested according to the maximum sustainable annual yield (Ymax), we would take forest-ET over Ymax. In the
case of a forest with an actual yield Yact, we would take the fraction Yact/Ymax times the forest-ET over Yact,
which results in the same water footprint estimate as in the case of the forest harvested at maximum sustainable
annual yield. This illustrates the fact that the actual yield does not really influence the water footprint of the
harvested wood. The two key factors are forest-ET and the rate of wood growth (Ymax).
Allocation of forestry evapotranspiration to harvested wood (2). There is another issue of allocation. Woodlands
like semi-natural forests and plantations often serve purposes of considerable importance next to that of
delivering wood for the production of paper. Next to the production of timber, important examples are
biodiversity conservation and carbon storage. The appropriate way of accounting is to allocate the forest-ET
over the various forest functions according to their economic value (Hoekstra et al., 2009). One would need
estimates of the various values of forests, as for instance reported in Costanza et al. (1997). In this report we
have not included the other values of a production forest. We have attributed the full forest-ET to the primary
output of a production forest: wood.
Wood yields. Per biome we have estimated the maximum sustainable annual yield by assuming one typical tree
type. In reality, many forest biomes are mixed with regard to tree types. For a boreal forest biome, pine trees
have been assumed when taking data for the maximum sustainable annual yield, which is not precisely the case
for all areas that are classified as boreal biome. For temperate, subtropical and tropical biomes, tree diversity
may be even more diverse. Since actual evapotranspiration estimates are used for biomes rather than for specific
tree types, this may cause inaccuracies.
Distinction between green and blue water. The green and blue water footprint requirements have been
determined jointly. The difference between the use of green and the use of blue water is not as straightforward
for forestry products as it is for other (agricultural) products. This difficulty is related to the process of water