Evaluation of the Effects and the Programming of ‘Water Conservation Plan’ (WCP) for Total Water Resources Management in Tokyo
Bạn đang xem bản rút gọn của tài liệu. Xem và tải ngay bản đầy đủ của tài liệu tại đây (2.2 MB, 19 trang )
Journal of Water and Environment Technology, Vol. 9, No.2, 2011
Evaluation of the Effects and the Programming of
‘Water Conservation Plan’ (WCP) for Total Water
Resources Management in Tokyo
Abdul Rahiman NAFISAH*, Jun MATSUSHITA**, Akihiro OKADA**
*Faculty of Built Environment, University Technology of Malaysia,UTM Skudai, 51310 Johor, Malaysia.
**Division of Regional Environment System, Graduate School of Engineering, Shibaura Institute
of Technology, Fukasaku, Minuma-ku, Saitama-shi 335-8857, Japan.
ABSTRACT
In major cities, rapid urbanization due to population and economic growth generally cause
increase in water demand. Furthermore, lifestyle change encourages per capita water
consumption to increase. The government tends to have policies that support increasing capacity
to response to rising demand but this requires huge funding and several other problems such as
opposition by environmentalist. To overcome these problems, water demand should decrease
especially by reducing per capita water consumption through water conservation. On such basis,
this paper focuses on the evaluation of ‘Water Conservation Plan’ (WCP) implemented by Tokyo
Metropolitan Government (TMG). Tokyo faced tight water resources problem during the high
economic growth period around 1960s. However, by incorporating both supply and demand side
control measures in WCP, Tokyo became advanced in water resources management and now has
excess water supply to meet the demands. Tokyo managed to reduce the per capita water
consumption to about 171 L/p/d or more in 30 years. But due to pushing-up factors, which
contributed 89.5 L/p/d of increment, the actual reduction was equivalent to 81 L/p/d or 19%
reduction rate. Total supply side measures are almost equal to demand side measures where the
weightage is 44:56 respectively. Hence, the authors analyze the effects of WCP from the
viewpoint of supply and demand side control.
Keywords: demand side control, supply side control, total water resources management
(TWRM), water conservation plan (WCP)
INTRODUCTION
Background and Objectives of the Study
According to the United Nations, many less-developed countries are facing severe water
shortage problem, especially the lack of access to clean drinking water. The Millennium
Development Goal’s (MDG) target for the countries is to fulfill such needs. However,
Japan International Cooperation Agency (JICA) reported that medium developed
countries such as Asian countries face a different situation in terms of the adequacy of
water supply. The main problem leading to water shortage is due to population growth
as a result of urbanization and economic growth. In Asia, urban population growth was
6% per year up to 2005. Particularly, the population pressure in the city with more than
500,000 people became intensified (Masuda, 2009). Population growth coupled with
change of lifestyle directly causes increase in water demand.
Basing on the necessity to establish workable national action programmes for water
conservation especially for Asian countries, relevant best practices from other regions in
the world could be a reference. In identifying such best practice, the authors realize that
Tokyo’s Water Conservation Plan (WCP) with necessary modification to local
socio-economic condition might be workable for other Asian countries. Tokyo’s WCP is
Address correspondence to Abdul Rahiman Nafisah, Graduate School of Engineering, Shibaura Institute
of Technology, Email:
Received November 19, 2010, Accepted March 17, 2011.
- 179 -
Journal of Water and Environment Technology, Vol. 9, No.2, 2011
identified as the best practice since it is reported by the Tokyo Metropolitan
Government (TMG) that in a 30 year period, Tokyo managed to reduce the per capita
water consumption up to 81 L/p/d, approximately 19% from water supply amount by
the WCP. There are no other regions in the world which explicitly declared a successful
water consumption reduction due to best practices by their water conservation
programmes especially in the wake of rapid urbanization, economic and population
growth. Other developing countries could adopt the Tokyo’s WCP to establish efficient
water conservation programmes. However, without analyzing in detail how Tokyo
manages to establish the programme, it is difficult to consider the applicability.
Therefore, this study aims to analyze WCP as practiced in Tokyo since TMG did not
analyze the effects by the introduction of such WCP in detail for each element.
Review of Related Studies
Abderrahman (2000) studied the water demand management in Saudi Arabia, while
Mayer et al. (1999) and White (2000) both studied on water demand management in
Colorado, USA and in Sydney, Australia, respectively. However, all such studies focus
on the qualitative study rather than the quantitative study and the elements studied for
water conservation are limited to demand side measures. In contrast, this paper focuses
on the quantitative study comprehensively from both supply/demand side control
measures. White and Fane (2002) however have prepared a comprehensive quantitative
study almost similar to this study but the results are mostly from simulation basis. This
paper conversely presented results based on the actual data gathered by various
approaches. Whereas, Fenwick (1998), Karpiscak et al. (1994) and DeCook et al.
(1988) seem to have presented actual quantitative results for water conservation based
on case studies in Essex (United Kingdom), Britain and Tucson (Arizona), respectively.
However, the case study has limited application, just focusing on area basis or small
development basis. On the other hand, this paper focuses on the overall Tokyo
Metropolitan region.
The reduction of per capita water consumption in Tokyo is likely due to the effects of
the introduction of several measures. In case of researches presented by Tokyo
Metropolitan scholars, previous studies mostly examined such effects specifically and
independently. For example, Murase et al. (2005) analyzed the relationship between the
water price and domestic water demand structure; Yamada et al. (2004) analyzed the
domestic water demands according to the size of households; and Nakagawa et al.
(2010) analyzed the decreasing tendency of domestic water use per capita by modeling
the introduction of water-saving appliances. Nevertheless, effects on domestic water
consumption reduction in Tokyo by other measures as leakage reduction, wastewater
recycling and rainwater harvesting were not fully examined in the previous studies.
There was a study conducted by Fujii (2002) namely evaluation on water conservation
activities in Fukuoka-Shi, which is quite similar and serves as the basis for this study.
Nevertheless, Fukuoka’s local conditions on water resources are different compared to
Tokyo since Fukuoka has restricted water resources availability while Tokyo relatively
has abundant water resources. Thus, the consideration on WCP implementation in both
regions varies greatly. This paper aims to integrate and analyze WCP from two
viewpoints namely supply/demand side control in the basis of chronological and
quantitative analysis on the total water resources management (TWRM).
- 180 -
Journal of Water and Environment Technology, Vol. 9, No.2, 2011
METHODOLOGY
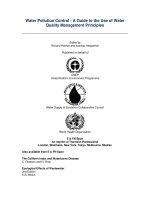
The methodology framework of the study is shown in Fig. 1. Mainly, this study is based
on empirical analysis performed after collecting relevant data by literature reviews,
interviews and field surveys.
OVERVIEW OF THE TOTAL WATER RESOURCES MANAGEMENT IN
TOKYO
Tokyo, with a land area of 2,188 km2, has a population of over 12.5 million. The
average annual rainfall is approximately 1,600 mm. High-water consumption style
prevails during high economic growth period around 1960s. The completion of Ogouchi
Dam in 1957 serves as the final intra-state water resources development within Tokyo.
Immediately, Tokyo was hit by strict water shortage due to rapid urbanization and
population growth. To deal with the expected water shortages, the government starts the
development of inter-state water transfers from Sagami River in 1955 and shortly after
from Tone River in 1965. In addition, to cope with continuous water shortages, TMG
announced Water Conservation Plan (WCP) in 1973 which consists of supply/demand
side control meant for reducing per capita water consumption. Thus, today TMG
secures 530 L/p/d of water resources. Out of the total water resources amount, about
80% is from inter-state water transfers.
Background of 'Water Conservation Plan' (WCP) in Tokyo
Tokyo needs WCP for several reasons. One of the reasons is due to the tendency
towards a substantial growth in the number of people commuting into Tokyo over the
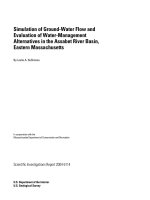
periods. Such tendency can be understood by comparing the inflow and outflow
movement of the population in Tokyo between the year 1980 and 2005 as shown in Fig.
2(a). It is obvious that daytime population in Tokyo is much higher than nighttime
population. Based on the estimated calculation, in 1980, daytime population was 15%
Fig. 1 - Methodology framework
- 181 -
Journal of Water and Environment Technology, Vol. 9, No.2, 2011
higher compared to nighttime population while in 2005, the difference was around 20%.
Daytime population against nighttime population growth tendency in 25 years from
1980 to 2005 shows 5% growth. As such tendency is still continuous; TMG will have to
secure more water resources to meet the growing demand.
The local government, TMG realizes that WCP is necessary to be ongoing to limit the
capacity development. Another reason is due to the tendency of increasing water
demand, where new demand occurs consequent to the increasing number of nuclear
families and single families (Saito, 2003). Accordingly, as shown in Fig. 2(b), per capita
water consumption increases in a household due to decreasing family members per
household. The main reason for such occurrence is assumably due to the custom in
Japanese families where they share bath water. Furthermore, as members per household
decreases, water consumption increases for washing, bathing and others. Besides, WCP
became necessary in Tokyo influenced by the intention of TMG to create a Water
Conservation City aiming to promote reasonable water use with resistance to drought
and by appreciating limited water resources (Bureau of Waterworks, TMG, 2009).
ANALYSIS ON TWRM IN TOKYO BY PHASE
In this study, chronologies in TWRM from 1957 to 2007 are to be divided into the
following 3 phases: [Phase 1] Period of Increasing Water Consumption (1957 to 1972),
[Phase 2] Period of Stabilizing Water Consumption (1973 to 1992) and [Phase 3] Period
of Decreasing Water Consumption (1993 to 2007). Likely, such water consumption was
influenced by both pushing-up factors and pulling-down factors. Pushing-up factors are
due to the change in domestic urban migration structure and the change in family
structure with lifestyle combined. While pulling-down factors are materialized through
the introduction of supply and demand side control measures under TWRM known as
WCP. The basic dimension profile of Tokyo for each phase is shown in Table 1.
Phase 1 (1956 to 1972) – Period of Increasing Water consumption
As illustrated in Table 1, per capita water consumption in this period shows notable
Fig. 2(a) - Tokyo’s domestic migration urban
structure
(Statistics
Bureau,
Ministry of Internal Affairs and
Communication, 1980, 2005)
Fig. 2(b) - Trend of household structure against
per capita water consumption (Japan
Water Works Association (JWWA),
1997)
- 182 -
Journal of Water and Environment Technology, Vol. 9, No.2, 2011
Table 1 - Basic dimension profile of Tokyo by phase (1956-2007)
Element
Phase 1
Period of Increasing
Water Consumption
1956 1972
Phase 2
Period of Stabilizing
Water Consumption
1973 1992
Phase 3
Period of Decreasing
Water Consumption
1993 2007
General aspects
1. GRP/year (mil. USD)
5.09 10.9
11.4 52.7
57.2 62.8
2. Population (mil.)
9.46 11.16
11.28 11.83
11.80 12.75
Water-related aspects
1. Water resources
capacity - WR (L/p/d)
264 408
403 509
510 489
2. Total water supply
amount - TWS (L/p/d)
345 425
423 : 417
413 347
3. Effective water supply
amount - EWS (L/p/d)
245 323
330 371
369 335
4. Effective water supply
rate - EWS/TWS (%)
71 76
78 89
89 97
5. Allowance of water
resources capacity 77 96
95 122
124 141
WR/TWS (%)
Key characteristics of phases:
Phase 1: Total water supply amount is greater than the water resources capacity resulting in water
shortages, although inter-state water transfer was started in 1963. Allowance of water resources capacity
(hereinafter defined as allowance) became bigger, but is still in the red.
Phase 2: Total water supply became balanced with the water resources capacity resulting in complete
solution to water shortages. Allowance increased more than 120% which was likely due to both continued
interstate water transfers and newly introduced water conservation plan (WCP).
Phase 3: Total water supply became highly decreased by 66 L/p/d or 15.9% during this period as a result of
successful assimilation by local society to WCP after 20 years of scrutinizing in the preceding phase.
increase from 345 L/p/d in 1956 to 425 L/p/d in 1972, as pushing-up factors are bigger
than pulling-down factors. Tokyo was in a high economic growth period in this phase
where the economy grew steadily at about 9% per year, which was from 5.09 thousand
USD in 1956 to 10.9 thousand USD in 1972 in Gross Regional Product (GRP).
Population growth was rapid; about 18% of population increment in 16 years bringing
significant effects over water supply. In 1954, the total population reached 7.5 million,
which is 2.5 times bigger than during World War 2.
In 1957, the total population reached 8.52 million enabling Tokyo to become the biggest
metropolis in the world and in 1962, the total night-time population exceeded 10 million
which is the first ever in the world. National policy encourages dam construction and
wide-range water supply system or inter-state water transfer to respond to such
increasing demand. In 1972, TMG announced the efforts to have sufficient water supply
system for the people in Tokyo emphasizing the necessity of water supply development.
For counter measures against water shortages, there was water rationing since 1958 to
1973 with maximum water rationing up to 50% from water supply amount in 1964 to
prepare for the 18th Olympic Games held in Tokyo. In 1965, a special committee was
established to reduce water leakage. Furthermore, in 1966, the charging system was
revised with an average of 35.4% tariff hike due to the high cost of water resources
development. It is obvious that Tokyo faced water shortage where demand for water to
support the rapid urbanization and population growth far exceeded the supply capacity.
- 183 -
Journal of Water and Environment Technology, Vol. 9, No.2, 2011
Phase 2 (1973 to 1992) – Period of Stabilizing Water consumption
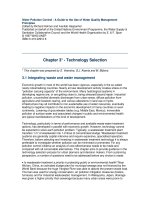
It is obvious that the per capita water consumption pattern in this period shows
fluctuation as shown in Fig. 3, assuming that pushing-up factors became equal to
pulling-down factors. Tokyo was in a stabilized economic growth period in this phase
where based on GRP, apparently the economic indicator reveal substantial steady
growth of roughly 7% per year, which was from 11.4 thousand USD in 1973 to 52.7
thousand USD in 1992 in GRP. The population growth became stabilized with only 5%
increment in 20 years reducing stress on water supply. In 1980, the population growth
became negative for the first time after World War 2.
In this period, although the government continued to develop water resources to meet
the ever increasing demand, it also began to give attention on encouraging water
conservation. Thus, TMG introduced WCP in 1973 which encouraged water
conservation and efficient water usage by various means from supply/demand side
control. In 1976, the Ministry of Public Welfare announced the target for the effective
water use at 90%. To enhance water supply services, TMG started the promotion of
kindness, speed and accuracy among the staff members of Water Bureau in 1983. For
public relation, Water Supply Museum was established in 1984 to raise citizens’
awareness on water conservation. In 1988, water resources development was integrated
into the proposal of the 4th plan for inter-state water transfers from Tone and Ara Rivers.
In the same year, the final report on ‘How to Create Water-Saving Type Municipal
System’ was published. It proposed the necessity of city-wide recycling system and
other measures. The fluctuation of water consumption in this period reflects the people’s
consideration on the WCP introduced. The people are still wondering whether to change
their water consumption style according to the mentioned policy or not. Thus, this phase
Period of Increasing
Water Consumption
Period of Stabilizing
Water Consumption
Period of Decreasing
Water Consumption
81 L/p/d of reduction
Fig. 3 - Chronological analysis of TWRM in Tokyo by phase (Bureau of
Waterworks, Tokyo Metropolitan Government, 1998)
- 184 -
Journal of Water and Environment Technology, Vol. 9, No.2, 2011
might be considered as a ‘learning phase’. Most probably, due to various measures
introduced by the government under such plan, the weightage of pulling-down factors
became equal to that of pushing-up factors which stabilized the per capita water
consumption. Thus, water consumption stabilization coupled with stabilized population
growth increased water allowances capacity more than the water demand.
Phase 3 (1993 to 2007) – Period of Decreasing Water consumption
The per capita water consumption steadily decreased yearly from 413 L/p/d in 1993 to
347 L/p/d in 2007 while pushing-up factors became smaller than pulling-down factors
in this period. Tokyo was in a low economic growth period in this phase when the
economy slowed down with a growth rate of only 0.6% per year, which was decreased
from 62.8 thousand USD in 2007 to 57.2 thousand USD in 1993 in GRP. The population
growth also remained stabilized with 8% increment in 15 years. In this period, TMG
emphasized the popularization of the consume-less-water urban model with the
announcement of a plan toward sustainable water management. In 1996, TMG
organized a committee on sustainable water supply system. Consequently, in 1997, the
committee produced the final report on ‘New Century Plan (STEP 21)’ for Tokyo’s
sustainable water supply. In the same year, Water Science Museum was opened for
educational purposes on TWRM. It helped people apprehend that huge water
consumption was not appropriate. They started to recognize WCP as a preferable
solution toward lower water consumption practice. Due to continuous water resources
capacity development coupled with the introduction of WCP in the previous period, the
water allowance capacity became higher than water demand. In this period, Tokyo had
excess water resources capacity at approximately 150 L/p/d as shown in Fig. 3.
Summary of the Analysis on TWRM by Phase
Tokyo experienced increasing, stabilizing and decreasing water consumption periods
from 1956 to 2007. Changes in population, urbanization, economic condition and
government policy have direct impacts on water consumption in each phase as
discussed previously. Coincidently, the above-mentioned water consumption periods
were the greatest contributors to the economic growth pattern. Besides, during phase 1,
water demands are greater than water supply as pushing-up factors are greater than
pulling-down factors.
Whereas, in phase 2, water consumption becomes stable as pushing-up factors and
pulling-down factors begin to be equalized. In phase 3, water supply continues to be
greater than water demand as pulling-down factors become greater than pushing-up
factors. However, it is clarified that TMG cannot forecast the future of water
consumption change and has no confidence on the successful performance of WCP.
Thus, the government tends to increase the water supply capacity corresponding to the
water demand during phase 2. As a result, Tokyo currently has excess water supply
capacity which enables Tokyo to mitigate water shortage risks in the future.
ANALYSIS ON PUSHING-UP FACTORS AND PULLING-DOWN FACTORS
(WCP) IN TWRM BY ELEMENTS
Table 2 sums up the elements in TWRM based on pushing-up and pulling-down factors
of water consumption in Tokyo. Basically, pushing-up factors are attributable to water
- 185 -
Journal of Water and Environment Technology, Vol. 9, No.2, 2011
consumption increment, while, pulling-down factors are due to WCP. The subsequent
section analyzes the decreasing and increasing amount of per capita water consumption
by elements as presented in Table 2 together with the processes involved in its
realization. The estimation method is described in Table 3 and Table 4.
Effects on Water Consumption due to Pushing-up Factors (ΔQ1)
There are significant amounts of increment in per capita water consumption due to the
change in domestic urban migration structure and the change in family structure
combined with lifestyle, despite various efforts by TMG in water consumption
reduction as summarized in Table 3 below.
ΔQ1 = change in domestic urban migration structure + change in family structure
combined with lifestyle
= 22.7 L/p/d + 66.8 L/p/d
= 89.5 L/p/d ...........................................................................................................(1)
Table 2 - Elements in TWRM based on pushing-up and pulling-down factors
Element
Pushing-up factors
Remarks
ΔQ1
- Change in domestic urban migration structure
Pulling-down factors
1. Supply side control
ΔQ2
-Reduction of non-revenue water: leakage and non-counted water
2. Direct demand side control
-Save-water type (SWT): flushing toilet and washing machine -Wastewater recycling (WWR)
-Rainwater harvesting (RWH) -Reduction in industrial sector
3. Indirect demand side control
-Water consumption reduction through public relation activities by TMG to raise awareness and to trigger
changes in water use behavior by the introduction of cumulative charging scheme
ΔQ3
ΔQ4
Table 3 - Estimation method for elements under Pushing-up Factors in TWRM
Estimation Method to Evaluate Water Consumption Pushing-up Factors by Elements
Pushing-up factors (∆Q1)
1. Change in domestic urban migration structure
Increment due to population migration structure change from 1980 to 2005 with higher population inflow to Tokyo
Metropolis (Population Census 2005 and 1980) as shown in Fig. 2(a) on population movement:
-population inflow in 1980/2005= 2.12/2.86 (million people). 2.86 – 2.12= 0.74 million people increment.
- Increment of 0.74 million people in 25 years resulted in increment of total water consumption:
0.74 million people x 392 L/p/d (average per capita water consumption from 1980 to 2005) = 290 million L/d.
-Such total water consumption increment contributes to per capita water consumption increment based on the population
in 2007 (12.752 million people) as follows: 290 million.L/d ÷ 12.752 million people = 22.7 L/p/d
2. Change in family structure combined with lifestyle
Increment in total water consumption due to family structure change combined with lifestyle from 1979 to 2007.
Higher per capita water consumption by household due to declining family members per household together with the
progress of water-consuming lifestyle (Japan Water Works Association (JWWA), 1997):
-per capita water consumption by 2 family-member households in 1979/2007 = 234/274 (L/p/d)
-per capita water consumption by 3 family-member households in 1979/2007 = 222/242 (L/p/d)
-As a result, increment in the total water consumption due to per capita water consumption increment from 226 L/p/d in
1979 where the average members of household was 2.68 people to 270 L/p/d in 2007 where the average members of
household was 2.12 people is calculated as follows: {[270 x 12.752 (population in 2007)] – [226 – 11.465(population in
1979)} = 852 million.L/d.
-Such total water consumption increment contributes to per capita water consumption increment based on the population
in 2007 (12.752 million people) as follows: 852 million.L/d ÷ 12.752 million people = 66.8 L/p/d
Total (∆Q1)
Amount
22.7 L/p/d
66.8 L/p/d
89.5 L/p/d
- 186 -
Journal of Water and Environment Technology, Vol. 9, No.2, 2011
Effects on Water Consumption due to Pulling-down Factors
Regarding pulling-down factors, there are 3 categories in measuring water conservation
effects as follows: supply side control (ΔQ2), direct demand side control (ΔQ3), and
indirect demand side control (ΔQ4) as summarized in Table 4 below.
Table 4 - Estimation method for elements under pulling-down factors in TWRM
Estimation Method to Evaluate Water Consumption Pulling-down Factors by Elements
Pulling-down factors: Supply side control (ΔQ2)
Reduction of non-revenue water: leakage and non-counted water
Decrement due to water conservation through leakage and non-counted water amount reduction from 1978 to 2007
(interview with Waterworks Bureau of TMG):
- leakage amount in 1978/2007= 67/12 (L/p/d) 67 – 12= 55 L/p/d
- non-counted water amount in 1978/2007= 21/1 (L/p/d) 21 – 1= 20 L/p/d
Total (ΔQ2)
Pulling-down factors: Direct demand side control (∆Q3)
Amount
55 L/p/d
20 L/p/d
75 L/p/d
1. Save-water type flushing toilet (SWT-FT)
a. Water conservation by SWT-FT for a newly-built house case:
[Growth rate of SWT-FT x number of people using toilet daily x water conservation amount by SWT-FT] ÷ Population
in 2007
Before analyzing the amount saved by SWT-FT, the following items are defined:
① Growth rate of SWT-FT from 1994 to 2007 (1st model of SWT-FT was available from 1994) is assumed as
proportionate to housing unit growth rate during the period. Housing units’ growth rate = (6.03 – 4.53)/ 4.53, about
33.1%; where total housing units in 1994/2007 = 4.53/6.03 (unit: million) (Statistics Bureau, Ministry of Internal
Affairs and Communication, 1994, 2007).
② Number of people using toilet daily referring to population movement as shown in Fig. 2 (a) are divided into 5
categories:
#1 and #2 are counted full as the people are in Tokyo all the time, while #3,#4 and #5 are counted as half assuming
that people are in Tokyo for half a day: 6.883 + 5.042 + [(3.051 + 0.489 + 0.3) x 0.5) = 13.845 people (unit: million)
③ Water conservation amount by SWT-FT = (52 – 21) l/p/d; where:
i. Toilet usage - 3times (urination) /1time (defecation) (interview with TOTO Co. Ltd.)
ii. Amount of water consumed for each flushing (TOTO Co. Ltd.):
-Flushing toilet model from 1970 to 1993: 13 L for both urination and defecation. Daily average: 13 x (3+1) = 52
L/p/d.
-Flushing toilet model of 2007 – 5 L for urination and 6 L for defecation. Daily average: (3x5) + (1x6) = 21 L/p/d
0.331 x 13.845 x (52 – 21) = 142.1 million.L/d
-Such amount contributes to per capita water consumption reduction based on the population in 2007 (12.752 million
people) as follows: 142.1/12.752 = 11.1L/p/d
b. Water conservation by SWT-FT for toilet-only renewal case:
- The weightage of SWT-FT stand at 1 for a newly-built house case and approximately 1 for toilet-only renewal case
(interview with the Marketing Department of TOTO Co. Ltd.). Hence, the amount of conservation by SWT-FT in
toilet-only renewal case = amount of conservation by SWT-FT for a newly-built house case = 11.1 L/p/d
22.2 L/p/d
Total amount of water conservation by SWT-FT: 11.1 L/p/d + 11.1 L/p/d = 22.2 L/p/d.
2. Save-water type automatic washing machine (SWT-AWM)
Number of washing machines in 2007 x washing machine usage x water conservation amount by SWT-AWM (compared
between 1970 and 2007) ÷ population in 2007
Before analyzing the amount saved by SWT-AWM, the following items are defined:
① Number of washing machines in 2007 = 6.03 mil. units (housing units in 2007)
② Washing machines usage = 1 (1 unit per household) x 1 (usage of 1 time washing/day) (Japan Electric Appliances
Association, 2009)
③ Water conservation amount by SWT-AWM = {[(165 – 110) x 0.9] + [(165 – 101) x 0.1]} where:
i. The replacement of washing machine or the average lifespan of washing machine is 8.7 years. In 2007, washing
machines in 90% of housing units are of 2002-model and only 10% are of 2007-model. (Japan Electric
Appliances Association, 2009).
ii. Amount of water consumed in each washing:
1970-model (traditional double-layer type washing machine) - 165 L/washing (Bureau of Waterworks, Tokyo
Metropolitan Government, 1973).
2002-model (SWT-automatic washing machine) - 110 L/washing (amount obtained by interpolation method
between 1970 and 2007)
2007-model (SWT-automatic washing machine) - 101 L/washing (average amount obtained by comparing
several washing machine models by several makers)
6.03 x 1 x { [(165 – 110) x 0.9] + [(165 – 101) x 0.1]}= 337 million.L/d
- 187 -
26.4 L/p/d
Journal of Water and Environment Technology, Vol. 9, No.2, 2011
-Such amount contributes to per capita water consumption reduction based on the population in 2007 (12.752 million
people) as follows: 337/12.752 = 26.4 L/p/d
3. Wastewater recycling (WWR)
Total in-house WWR amount in 2007 (interview with City Planning Department of TMG): 85.4 million.L/d
-Such amount contributes to per capita water consumption reduction based on the population in 2007 (12.752 million
people) as follows: 85.4/12.752 = 6.7 L/p/d
4. Rainwater harvesting (RWH)
Total RWH amount in Sumida-ku in 2007 (interview with Sumida-ku City Hall):
12.7 million.L/d x 10 times/year ÷ 365 = 0.35 million L/d
- Such amount contributes to per capita water consumption reduction based on the population in 2007 (12.752 million
people) as follows: 0.35/12.752 = 0.03 L/p/d
5. Reduction in industrial sector (Bureau of Waterworks, Tokyo Metropolitan Government, 1979, 2007).
Reduction observed by decrement in industrial water amount from year 1979 to 2007:
-amount of industrial water in 1979/2007 = 160/58 (million.L/d). 160 – 58 = 102 million.L/d.
-Such amount contributes to per capita water consumption reduction based on the population in 2007 (12.752 million
people) as follows: 102/12.752 = 8 L/p/d. Such total reduction in industrial sector is mainly due to:
i. Decrement by factory relocation to the outskirts of Tokyo Metropolis: 15 million.L/d (total water consumed by top 20
ranking factories consuming large amount of water in Tokyo in 1979)
-Such amount contributes to per capita water consumption reduction based on the population in 2007 (12.752 million
people) as follows: 15/12.752 = 1.2 L/p/d
ii. Decrement by the use of WWR due to higher water cost expected upon the introduction of cumulative water charging
scheme in 1975: 8 L/p/d – 1.2 L/p/d = 6.8 L/p/d (estimated by reverse calculation).
Total (ΔQ3)
Pulling-down factors: Indirect demand side control (ΔQ4)
6.7 L/p/d
0.03 L/p/d
8 L/p/d
63.3 L/p/d
Water consumption reduction through public relation activities by TMG to raise awareness and to trigger changes in
water use behavior by the introduction of cumulative charging scheme since 1973. Amount saved is estimated by
reverse calculation as this element is an intangible measure: [81- (63.3+75-89.5)] L/p/d
Total (ΔQ4)
32.2 L/p/d
32.2 L/p/d
Fig. 4 - Non-revenue water reduction activities by TMG (Bureau of Waterworks, Tokyo
Metropolitan Government, 1998)
Water Conservation Effects by Supply Side Control (ΔQ2)
Supply side control measures by TMG consist of leakage reduction and other
non-counted water reduction.
ΔQ2 = leakage reduction + other non-counted water reduction
= 55 L/p/d + 20 L/p/d
= 75 L/p/d ………………………………………………….………...…………(2)
- 188 -
Journal of Water and Environment Technology, Vol. 9, No.2, 2011
Huge amounts of water are conserved over the past 50 years (in 1956 the leakage rate
was 20% while in 2007 the leakage rate was reduced to 3.3%). Mainly, the following
four measures were taken to realize water consumption reduction by leakage and other
non-effective water reduction: pressure reduction in pipe, replacement of fragile piping
material (cast iron to ductile/stainless steel pipe), technical development such as
acoustic sound detector and instant repair method corresponding to users’ complaints.
Water Conservation Effects by Direct Demand Side Control (ΔQ3)
Direct demand side control measures consist of the development of save-water type
(SWT) devices, i.e. SWT flushing-toilets and automatic washing machines; wastewater
recycling (WWR); rainwater harvesting (RWH); and reduction in industrial sector.
ΔQ3 = SWT-flushing toilet + SWT washing machine+ WWR + RWH + reduction in
industrial sector
= 22.2 L/p/d + 26.4 L/p/d + 6.7 L/p/d + 0.03 L/p/d + 8 L/p/d
= 63.3 L/p/d……………………………….………………………………….…(3)
The details for each measure are as follows:
1. Save-water Type Flushing Toilet (SWT-FT)
In order to introduce SWT-FT, TMG had started its own research before any relevant
makers carried out such research. In 1973, TMG requested the Society of Heating,
Air-conditioning and Sanitary Engineers of Japan to conduct a technical research on
how to save water in flushing excreta particularly on the pipe diameter, slope and
correlation between distances of water transfer with less water. Based on the result,
TMG requested the makers to manufacture SWT-FT. As the request is assumedly
coincident with the makers’ business strategy, the development of SWT-flushing toilets
continued further to date. The development processes of SWT-FT by TOTO Co. Ltd.,
one of the leading toilet makers in Japan is shown in Fig. 5(a).
2. Save-Water Type Automatic Washing Machine (SWT-AWM)
Water used for laundry (16%) has among the biggest percentage of water consumption
in domestic water use (Ministry of Land, Infrastructure, Transport and Tourism (MLIT),
2003). In 1973, TMG requested Japan Quality Association (JQA) formerly known as
Foundations of Machine and Electronics Inspection Association to conduct a research
on the amount of water consumed during the operation of washing machines by
comparing several options on washing methods. As a result, dewatering before rinsing
was the most appropriate as the remaining detergent concentration reduced sharply and
the continuation of dewatering could be shortened. Consequently, TMG requested the
manufacturer to improve the SWT-AWM.
Within a year, the manufacturers produced the initial automatic washing machine
models. Once again TMG carried out experiments on models from those makers. The
results showed that system programming was the most desired with 45% to 77% water
consumption reduction on the condition of similar washing quality. Soon, fully
automated new washing machines were introduced in the market (Fig.5(b)).
3. Wastewater Recycling (WWR)
To promote WWR, TMG drafted “Guideline for Miscellaneous Use of Water” (Saito,
2003) in 1984. In the same year effective from April, TMG introduced a regulation
- 189 -
Journal of Water and Environment Technology, Vol. 9, No.2, 2011
making WWR practice mandatory for large-scale buildings with floor areas bigger than
30,000 m2 or buildings with potential non-potable water demand of more than 100 m3
per day (Chung and Meredith, 2008). In 2003, the Guideline for Promotion of Effective
Utilization of Water was formulated. The baseline had been upgraded for buildings with
floor areas bigger than 10,000 m2 or the development areas bigger than 30,000 m2
(Bureau of Urban Development, Tokyo Metropolitan Government, 2003). In addition,
the Japanese Ministry of Construction granted subsidies of up to 50% of the capital
costs for WWR construction to offset the associated costs and the government further
assisted in connecting commercial WWR systems to the public sewerage system
(Chung and Meredith, 2008). Continuous efforts by TMG in promoting WWR
obviously contribute significant reduction of water consumption amount.
4. Rainwater Harvesting (RWH)
In Tokyo, there are ongoing large and small-scale RWH project practices which are
initiated in order to encourage natural water cycle and to provide more stable water
supply system. Sumida-ku is an example of a district where RWH is implemented
actively also utilizing low-cost and transferable technology especially to make the most
of its various benefits. Sumida-ku is also renowned as Amamizu (rainwater) City in
Tokyo. Even though RWH is embraced in ‘Tokyo Master Plan for Water Cycle’
established in 1999, the utilization is mainly limited to Sumida-ku so far. According to
officers in Sumida City Hall, there are 750 facilities with RWH both in private and
public buildings to date.
Note: defecate / urinate
Fig. 5(a) - Flushing toilet development
Fig. 5(b) - Washing machine development
Fig. 6 - Rainwater utilization in Sumida-ku.
From left: small-scale RWH tank; large-scale RWH (rooftop of Sumida-ku Ward
Office as catchment area) and communal RWH called ‘rojison’
- 190 -
Journal of Water and Environment Technology, Vol. 9, No.2, 2011
From the interviews with Sumida-ku officers, the authors of this paper were informed
that the key elements in RWH implementation in this district are the mandatory system
coupled with subsidy scheme, registration system and strong community involvement.
The users receive subsidies which differ by the tank size if they register their RWH
installation. Such registration system enables better management of RWH for future
development. Moreover, starting from 2003 onwards, the mandatory requirement for
RWH installation is imposed for the development of new buildings with floor areas of
more than 10,000m². This mandatory system led to the increasing number of RWH
installation and utilization in Tokyo.
5. Reduction in Industrial Sector
Reduction in factories mainly resulted in industrial water reduction. One of the major
factors that contributed to such reduction was the relocation of large-scale factories in
Tokyo such as Toyosu Gas, Ebisu Brewery, Kirin Beer and others to the outskirts of
Tokyo. Another major factor was the reduction of water use in the factory through the
utilization of WWR and water conservation efforts mainly due to their cost
consciousness after the introduction of cumulative charging scheme in 1975.
Water Conservation Effects by Indirect Demand Side Control (ΔQ4)
Indirect demand side control measures consist of water consumption reduction by
promoting mindset-change and behavior-change. The support by TMG through various
measures serve two purposes toward water conservation; the first one is raising citizens’
awareness for water conservation by public relation and the second one is triggering
citizens’ behavioral change by the introduction of cumulative charging system. For
raising citizens’ awareness for water conservation, it began in 1973 where TMG started
the promotion of save-water activities. Special meeting was arranged in order to discuss
the WCP. The committee concluded that the basis of the promotion was to raise
self-awareness to custom over the habit of water users and to stimulate the public mind
where the most appropriate approach was by making the public conscious about the
difficulty in new water resources development. Among the actual activities conducted
was the publication of save-water booklet for elementary schools in 1973 and for junior
high schools in 1975. Also in 1975, water consumption monitoring activity started
where the water usage of 700 households was monitored for a period of time to review
the consumption pattern. However, according to TMG, the amount of reduction is not
clear yet but they believe the awareness campaign has significantly contributed to water
conservation.
Other than that, the Bureau of Waterworks in TMG carries out detailed PR activities by
presenting daily-life water conservation methods through their homepage, videos, and
pamphlets together with consultations through telephone calls for water conservation.
They also continuously make efforts to promote the utilization of SWT devices
including the distribution of free SWT-tap developed by them as shown in Fig.7. On the
other hand, for triggering citizens’ behavioral change, cumulative charging system was
introduced. It took up to seven years to execute such cumulative charging system since
there were controversial issues between political parties during the time regarding the
charging system. The debate for the adequacy of such system was between the capitalist
party and socialist party. The capitalist party opposed it, since the system is against the
basic principles of capitalism which promote free market where per unit price will
- 191 -
Journal of Water and Environment Technology, Vol. 9, No.2, 2011
Series of Posters
Note: These posters are published to
enhance save-water consciousness and
promote sustainable water supply by
appealing to the public to conserve
water.
Fig. 7 - Promotion activities for water conservation by TMG (Bureau of
Waterworks, Tokyo Metropolitan Government, 1998)
become cheaper if the consumptions get bigger. On the other hand, the socialist party
supported it, since it gives fair treatment among big consumers and small consumers.
However, such system was successfully introduced in 1968 and was further intensified
in 1975 where the cumulative increment structure became steeper and the bigger
consumers had to bear expensive costs from the beginning. For ΔQ4, it is difficult to
estimate the amount saved by this intangible measure, hence reverse calculation was
performed.
Total Analysis on the Effects of Pushing-up and pulling-down Factors (ΔQ)
Based on the data from TMG as shown in previously mentioned Fig. 3, the amount of
water consumption reduction in 30 years is 81 L/p/d. From the above analysis, this
amount is accounted by both pushing-up and pulling-down factors as discussed.
Therefore, ΔQ which is 81 L/p/d is represented by the following equation:
ΔQ = (pulling-down factors) – (pushing-up factors)
= (ΔQ2 + ΔQ3 + ΔQ4) – (ΔQ1)
= (75 + 63.3 + ΔQ4) – (89.5)
= 48.8 + ΔQ4 = 81 L/p/d…………………………………………………………..(4)
Likely, based on reverse calculation, indirect demand side control measure (ΔQ4) was
calculated as follows:
ΔQ = 48.8 + ΔQ4 = 81 L/p/d
Therefore, ΔQ4 = 81 – 48.8 = 32.2 L/p/d………………………….……….………...(5)
Summary of the Analysis on the Effects of Pushing-up and Pulling-down Factors
Tokyo managed to reduce 81 L/p/d of water consumption in 30 years by various
measures from supply/demand side control introduced under WCP announced by TMG
in 1973. Each element has a significant impact that contributes to the total per capita
water consumption reduction. The weightage for each category under WCP is 44:56 for
ΔQ2: ΔQ3+ΔQ4. It indicates that the supply side control measures have relatively
smaller impacts compared to demand side measures. Total demand side measures (ΔQ3
+ ΔQ4) are almost equal to supply side measures. Therefore, both supply/demand side
measures are important to be considered in TWRM. In total, the actual conservation
- 192 -
Journal of Water and Environment Technology, Vol. 9, No.2, 2011
amount in Tokyo could be 171 L/p/d or more. However, due to pushing-up factors (89.5
L/p/d) the actual reduction is equivalent to 81 L/p/d as mentioned.
DISCUSSIONS
Programming of WCP in Tokyo
Table 5 depicts the programming of WCP in Tokyo by highlighting the resisting and
driving factors relevant to each measure. Accordingly, each measure under Tokyo’s
WCP is categorized by strategic approaches into several dividing lines corresponding to
the applicability level. Thus, for supply side control measures, the applicability is
dependent on the sole decision by the water supply body (TMG) through cost and
benefit analysis. In case of demand side control measures, the dividing line is basically
in accordance with socio-economic conditions ranging from voluntary scheme to
mandatory scheme.
Table 5 - Classification of elements in 'Water Conservation Plan' from strategic
approach based on resisting and driving factors
Category
SUPPLY SIDE CONTROL
■ Resisting Factors / □ Driving Factors
Remarks
SOLE DECISION BY WATER SUPPLY BODY (TMG)
Reduction of non■ Financial/institutional restrictions for implementation of NRW reduction
Cost and benefits
revenue water (NRW):
□ Recognition on the necessity to decrease high NRW rate (20% as of 1955) consideration is basic
leakage and non-counted
condition (if cost
□ Cost/benefit estimation: prevented annual expenses by leakage reduction
benefits, feasible to
(20.6 billion yen) > annual cost for leakage reduction (8 billion yen)
Water
be implemented)
□ Existence of list of meters numbering as much as 6 million units
DEMAND SIDE CONTROL
MANDATORY SCHEME
Wastewater recycling
(WWR)
■ Opposition from developers due to higher cost for WWR compared to
ordinary water supply cost
□ Difficulty in just-in-time replacement of existing water mains in
accordance with expected demand increase by urban redevelopments
□ Introduction of TMG's regulation in 1984 onto large-scale buildings with
30,000m2 floor area or more to install in-house WWR
Cumulative charging
System
Rainwater harvesting
(RWH)
■ Opposition from capitalist party from the viewpoint of possible obstacles
for future economic growth
Big burdens for
developers and
factory
owners (compulsory
measures are
needed for the
objectives)
□ Agreement from socialist party from the viewpoint of social fare balance
■ Opposition from developers due to higher cost for RWH compared to
ordinary water supply cost
□ Difficulty in just-in-time replacement of existing water mains in
accordance with the expected demand increase by urban redevelopments
□ Introduction of TMG's regulation in 1984 onto large-scale buildings with
30,000 m2 floor area or more to install in-house RWH
□ Introduction of subsidy system by Sumida-ku in 2005 to stimulate
Relatively small
burdens for the
stakeholders
(developers
and building
owners)
medium-scale housing sites with 500m2 area or more
Save-water type (SWT):
flushing toilets and
washing machines
□ No big resisting factors due to win-win relation between the makers and
Reduction in industrial
Sector
■ Opposition from the viewpoint of possible slowness in economic growth
□ Industrial policy in 1975 to give incentives for the relocation of factories
TMG to promote sales of SWT devices
□ Coincidence of TMG's request for the development of SWT devices to the
makers with strategies of makers
out of Tokyo Metropolis
□ Cost consciousness of industrial sectors to introduce in-factory WWR
in the wake of cumulative charging system introduced in 1975
Enhancing people’s
awareness toward
water conservation
VOLUNTARY SCHEME
■ Inefficiency for higher-grade water supply services to the people
□ Promotion of water conservation activities such as save-water type
tap distribution, public relations, opening of water supply museum, etc.
- 193 -
Small burdens for the
stakeholders
(relevant
makers, factory
owners,
policy makers and
end-users)
Journal of Water and Environment Technology, Vol. 9, No.2, 2011
Mandatory Scheme
The introduction of WWR and cumulative charging system are considered as mandatory
schemes, since compulsory programmes are needed for the objectives such as the
introduction of regulation and strong governance to raise water tariff. The resisting
factors for mandatory scheme are more difficult to overcome and they usually take
longer periods to be realized. For instance, it took up to 7 years to reach agreements
between the socialist and capitalist party to introduce the cumulative charging system.
Intermediary Scheme
Rainwater harvesting is considered as intermediary scheme in Tokyo’s WCP, since the
stakeholders (comprised of the developers and building-owners) tend to volunteers for
RWH installation to realize water conservation. The practice of RWH is relatively
acceptable for Japanese people because they have a tradition of valuing natural
resources. The clear example of such practice is the cascade use of water for cleaning
rice and the washings would later be used for watering plants to utilize the remaining
nutrients. Likewise, making the most of rainwater by RWH should be the priority.
However, since the installation and running cost of RWH are rather high than the
ordinary water supply, the support by subsidy system, such as the one practiced in
Sumida-ku would be appropriate. Furthermore, the availability of low-cost technology
compared to WWR agitates RWH utilization. Therefore, the resisting factors in this
intermediary scheme pose relatively small burdens especially when compared to
measures under mandatory scheme. Realization of water conservation by this measure
would be more successful, if the driving factors could be enhanced by intensifying the
regulation, promotion and subsidies.
Voluntary Scheme
The introduction of SWT devices, water demand reduction in the industrial sectors and
enhancement of people’s awareness are considered as voluntary scheme, since they
should offer a win-win relation among stakeholders including the makers, the factory
owners and citizens, as well as the water supply body to realize water conservation.
Furthermore, resisting factors in voluntary scheme are comparatively smaller due to
some reasons for instance, the development of SWT devices corresponds to TMG’s
enthusiasm to reduce water consumption. In the industrial sectors, water consumption
reduction is rather easily materialized, as it helps to save water cost for the factory
owners. In case of people’s awareness enhancement, Japanese people traditionally have
‘mottainai’ mindset, which means a sense of regret concerning waste of resources. Thus,
TMG’s public relation activities easily ignite their voluntary spirit for water
conservation. Whereas, the driving factors for voluntary scheme normally provides
benefits for the relevant stakeholders resulting in the ease of realization.
Summary
In general, in terms of the applicability of WCP, the first priority should be the supply
side control measure which is the reduction of NRW, if cost-benefit analysis proves
practicality. It is relatively easy to push through, since the sole decision by the water
supply body is the basis. Subsequently, the voluntary scheme is easier to be executed
since the resisting factors usually have simple solutions, whereas, the driving factors
provide benefits usually leading to win-win relation for all the stakeholders. Following
- 194 -
Journal of Water and Environment Technology, Vol. 9, No.2, 2011
the voluntary scheme, the intermediary scheme is assumed to be not so burdensome.
For the applicability of the mandatory scheme programming comprising WWR and
cumulative charging system, Tokyo successfully managed to overcome the resisting
factors in the basis of strong governance of TMG. In addition, the Japanese mindset,
where normally the people will abide by regulations once realized, is helpful to boost
this scheme. Such Japanese tendencies seem to be rare in other countries, where people
oppose to their endurance imposed by bigger burdens such as investment on WWR or
increment of water tariff. In case of the application of Tokyo's WCP to developing
countries, the following should be fully investigated: the balance between
resisting/driving factors, the government's willingness to overcome the difficulties
particularly for mandatory scheme, and the people's willingness to be involved in water
conservation programming.
CONCLUSIONS
In this study, the following were clarified:
1. This study provides a good tool for TWRM in the basis of Tokyo’s experience known
as ‘Water Conservation Plan’ which can serve as efficient water-use programmes
especially for developing countries facing rapid urbanization and population growth.
2. Tokyo faced tight water resources problem during high economic growth period.
However, by incorporating both supply/demand side control under WCP, Tokyo
became advanced in water resources management and at present, Tokyo has excess
water supply to meet the demands.
3. Tokyo managed to reduce per capita water consumption to about 171 L/p/d or more
but due to pushing-up factors, which contributed 89.5 L/p/d of increment, the actual
reduction was equivalent to 81 L/p/d in 30 years or 19% from the total water supply.
4. This study also provides quantitative analysis together with the programming for
each measure under WCP as a reference for other regions facing similar problems.
5. For the applicability of WCP, considering the resisting/driving factors from Tokyo’s
experience, the first priority is NRW reduction from supply side control followed by
voluntary scheme i.e. SWT devices development, water demand reduction in
industrial sectors and enhancement of people’s awareness towards water conservation.
The implementation of intermediary scheme i.e. RWH and finally the execution of
mandatory scheme i.e. WWR and cumulative charging system must be subsequently
carried out.
6. However, the applicability of WCP in Tokyo especially the mandatory scheme is
highly related to Japanese mindset where the Japanese people traditionally pose
‘mottainai’ mindset firmly and abide by the established government rules and
regulations.
7. The applicability of the measures implemented in Tokyo is worth evaluated for other
developing countries considering local socio-economic conditions to encourage
water conservation and sustainable TWRM.
REFERENCES
Abderrahman W. A. (2000). Water Demand Management and Islamic Water
Management Principles: A Case Study, International Journal of Water Resources
Development, 16(4), 465-473.
- 195 -
Journal of Water and Environment Technology, Vol. 9, No.2, 2011
Bureau of Urban Development, Tokyo Metropolitan Government (2003). Guidelines for
Promotion of Effective Water Resources Utilization, Tokyo Metropolitan
Government, Tokyo, Japan. (in Japanese)
Bureau of Waterworks, Tokyo Metropolitan Government (1973). Experimentation
Report of Reasonable Water Use of Washing Machines, Tokyo Metropolitan
Government, Tokyo, Japan. (in Japanese)
Bureau of Waterworks, Tokyo Metropolitan Government (1979). Annual Report on
Water Supply, Tokyo Metropolitan Government, Tokyo, Japan.
Bureau of Waterworks, Tokyo Metropolitan Government (1998). Centennial Water
Supply Record, Tokyo Metropolitan Government, Tokyo, Japan.
Bureau of Waterworks, Tokyo Metropolitan Government (2007). Annual Report on
Water Supply, Tokyo Metropolitan Government, Tokyo, Japan.
Bureau of Waterworks, Tokyo Metropolitan Government (2009). Water Supply in
Tokyo: Provision of Excellent Water and High-Quality Service, Tokyo Metropolitan
Government, Tokyo, Japan.
Chung K. and Meredith P. W. (2008). Greywater Reuse: Understanding Greywater
Reuse Systems in the Current and Future Contexts and How Individuals Can
Promote Greywater Reuse, CRP 3840: Green Cities.
DeCook K. J., Foster K. E. and Karpiscak M. M. (1988). The W-Index for Residential
Water Conservation, Water Resources Bulletin, 24(6), 1295-1301.
Fenwick K. (1998). Conservation Begins at Home, Resource, 6(8), 18-19.
Fujii T. (2002). Evaluation on Save Water Policy Package in Fukuoka-Shi, Journal of
Japan Water Supply Systems, 71(7), 3-13. (in Japanese)
Japan Electric Appliances Association (2009). Household Appliances Statistics, Japan
Electric Appliances Association, Tokyo, Japan.
Japan Water Works Association (JWWA) (1997). Seismic Design and Construction
Guidelines for Water Supply Facilities, JWWA, Tokyo, Japan.
Karpiscak M. M., Brittain R. G., and Foster K. E. (1994). Desert House: A
Demonstration/Experiment in Efficient Domestic Water and Energy Use, Water
Resources Bulletin, 30(2), 329-334.
Masuda S. (2009). Japan's Official Development Assistance (ODA) in the Water Sector,
Journal of Japan Society on Water Environment, 32(8), 397-400.
Mayer P. W., DeOreo W. B., Opitz E. M., Kiefer J. C., Davis W. Y., Dziegielewski B.
and Nelson J. O. (1999). Report on Residential End Uses of Water: Denver,
Colorado. American Waterworks Association Research Foundation.
Ministry of Land, Infrastructure, Transport and Tourism (MLIT) (2003). Transition of
the amount of water usage for life, />c_actual/images/03-03.gif (August 21, 2010). (in Japanese)
Murase M., Nakamura A., and Kawasaki H. (2005). An analysis for demand structure
and price of domestic water supply. Proceedings of Hydraulics Engineering, JSCE.
49, 475-480. (in Japanese)
Nakagawa N., Kawamura A. and Amaguchi H. (2010). Analysis of Decreasing
Tendency of Domestic Water Use per Capita in Tokyo. BALWOIS 2010 - Ohrid.
Republic of Macedonia.
Saito N. (2003). Promotion of Public Awareness of Water Conservation in Tokyo, Japan.
Purification Division, Tokyo Metropolitan Waterworks Bureau.
Statistics Bureau, Ministry of Internal Affairs and Communication (1980). Population
Census. Japan Statistical Yearbook 1980, Statistics Bureau, Ministry of Internal
- 196 -
Journal of Water and Environment Technology, Vol. 9, No.2, 2011
Affairs and Communications, Tokyo, Japan.
Statistics Bureau, Ministry of Internal Affairs and Communication (1994). National
Census, Statistics Bureau, Ministry of Internal Affairs and Communications, Tokyo,
Japan.
Statistics Bureau, Ministry of Internal Affairs and Communication (2005). Population
Census. Japan Statistical Yearbook 2005, Statistics Bureau, Ministry of Internal
Affairs and Communications, Tokyo, Japan.
Statistics Bureau, Ministry of Internal Affairs and Communication (2007). National
Census, Statistics Bureau, Ministry of Internal Affairs and Communications, Tokyo,
Japan.
White S. B. and Fane S. A. (2002). Designing Cost Effective Water Demand
Management Programs in Australia, Water Sci. and Tech, 46 (6/7), 225-232.
White S. (2000). Water Demand Management and Conservation Including Water Losses
Control - National Report Australia, Water Supply, 18(1-2), 180-181.
Yamada K., Tanaka K., Sato Y. and Higashi Y. (2004). The structure analysis of
domestic water demands according to the size of the households. Proceedings of
Environmental System, JSCE. 32, 403-406. (in Japanese)
- 197 -