ENERGY TRANSITION FOR INDUSTRY: INDIA AND THE GLOBAL CONTEXT pptx
Bạn đang xem bản rút gọn của tài liệu. Xem và tải ngay bản đầy đủ của tài liệu tại đây (2.87 MB, 94 trang )
Nathalie trudeau, CeCilia tam,
dagmar graCzyk aNd Peter taylor
INFORMATION PAPER
ENERGY TRANSITION FOR INDUSTRY:
INDIA AND THE GLOBAL CONTEXT
2011
January
INTERNATIONAL ENERGY AGENCY
The International Energy Agency (IEA), an autonomous agency, was established in
November 1974. Its mandate is two-fold: to promote energy security amongst its member
countries through collective response to physical disruptions in oil supply and to advise member
countries on sound energy policy.
The IEA carries out a comprehensive programme of energy co-operation among 28 advanced
economies, each of which is obliged to hold oil stocks equivalent to 90 days of its net imports.
The Agency aims to:
n Secure member countries’ access to reliable and ample supplies of all forms of energy; in particular,
through maintaining effective emergency response capabilities in case of oil supply disruptions.
n Promote sustainable energy policies that spur economic growth and environmental protection
in a global context – particularly in terms of reducing greenhouse-gas emissions that contribute
to climate change.
n Improve transparency of international markets through collection and analysis of
energy data.
n Support global collaboration on energy technology to secure future energy supplies
and mitigate their environmental impact, including through improved energy
efficiency and development and deployment of low-carbon technologies.
n Find solutions to global energy challenges through engagement
and dialogue with non-member countries, industry,
international organisations and other stakeholders.
IEA member countries:
Australia
Austria
Belgium
Canada
Czech Republic
Denmark
Finland
France
Germany
Greece
Hungary
Ireland
Italy
Japan
Korea (Republic of)
Luxembourg
Netherlands
New Zealand
Norway
Poland
Portugal
Slovak Republic
Spain
Sweden
Switzerland
Turkey
United Kingdom
United States
The European Commission
also participates in
the work of the IEA.
Please note that this publication
is subject to specic restrictions
that limit its use and distribution.
The terms and conditions are available
online at
www.iea.org/about/copyright.asp
© OECD/IEA, 2011
International Energy Agency
9 rue de la Fédération
75739 Paris Cedex 15, France
www.iea.org
Nathalie trudeau, CeCilia tam,
dagmar graCzyk aNd Peter taylor
INFORMATION PAPER
ENERGY TRANSITION FOR INDUSTRY:
INDIA AND THE GLOBAL CONTEXT
2011
January
This information paper was prepared for the Energy Technology Perspective Project of the International
Energy Agency (IEA). It was drafted by the Energy Technology Policy Division of the IEA. This paper reflects
the views of the IEA Secretariat, but does not necessarily reflect those of individual IEA member countries.
For further information, please contact Nathalie Trudeau at
©OECD/IEA2011 EnergyTransitionforIndustry:IndiaandtheGlobalContext
Page|3
Tableofcontents
Acknowledgements 7
Executivesummary 9
Transitiontoalow‐carbonenergyfuture 14
Introduction 17
Chapter1.Industryoverview 19
EnergyandCO
2
savingspotentialinIndi a,basedonbestavailabletechnologies 21
IEAscenariosforIndia’sindustrialsector 22
Furtherconsiderations 25
Chapter2.Sectoralanalysis 27
Ironandsteel 27
Cement 36
Chemicalsandpetrochemicals 43
Pulpandpaper 51
Aluminium 59
Chapter
3.AlternativecaseforIndia:Stronggrowth 69
BasicassumptionforIndia’sstronggrowthcase 69
Materialsconsumptionandproductionunderthestronggrowthcase 70
ScenariosforindustrialenergyuseandCO
2
emissionsinthestronggrowthcase 71
AnnexA:KeytrendsinIndia’sindustrialsector 75
AnnexB:Indicatorsforthechemicalandpetrochemicalsector 81
AnnexC:References 85
AnnexD:Abbreviations,acronymsandunits 89
Listoffigures
FigureES.1:India’sdirectCO
2
emissionsreductionbyindustryinthelow‐demandcase 11
Figure1:GlobalCO
2
emissionsreductionbysectorintheBLUEScenario 17
Figure2:Industrialenergyusebyregion,2007 19
Figure3:Industrialfinalenergyconsumptionbysub‐sectorinIndiaandintheworld,2007 20
Figure4:IndustrialfinalenergymixinIndiaandintheworld,
2007 20
Figure5:Materialsproductionbyregioninthelow‐andhigh‐demandcases 24
Figure6:Useofcokedryquenchingtechnologybycountry,2004 29
Figure7:ReducingagentsconsumptioninBlastFurnacesintheworld2007/2008*/2009** 29
Figure8:Energysavingspotentialin
2007forironandsteel,basedonBAT 30
Figure9:IronandsteelenergyanddirectCO
2
intensityforlow‐demandscenarios,
Indiaandworldaverage 32
Figure10:India’sdirectCO
2
emissionsreductionbytechnologyoptionforironandsteel 33
Figure11:GlobaldirectCO
2
emissionsreductionbytechnologyoptionforironandsteel 33
EnergyTransitionforIndustry:IndiaandtheGlobalContext ©OECD/IEA2011
Page|4
Figure12:RegionalcontributiontoreducingglobaldirectCO
2
emissionsiniron
andsteel,low‐demandcase 34
Figure13:Shareofcement‐kilntechnology 37
Figure14:Thermalenergyconsumption pertonneofclinker 38
Figure15:Energy‐savingspotentialin2007forcement,basedonBAT 39
Figure16:CementdirectCO
2
intensityinIndiaandworldaverage 40
Figure17:India’sdirectCO
2
emissionsreductionbytechnologyoptionforcement 41
Figure18:GlobaldirectCO
2
emissionsreductionbytechnologyoptionforcement 42
Figure19:RegionalcontributioninglobaldirectCO
2
emissionsincement,
low‐demandcase 42
Figure20:Energysavingspotentialin2007forchemicalsandpetrochemicals,
basedonBPT 46
Figure21:India’schemicalandpetrochemical sector energyconsumption,
includingfeedstock 47
Figure22:India’sdirectCO
2
emissionsreductionbytechnologyoptionfor
chemicalsandpetrochemicals 48
Figure23:Globaldirectemissionsreductionbytechnologyoptionforchemicalsand
petrochemicals 49
Figure24:RegionalcontributiontoreducingglobaldirectCO
2
emissionsinchemicalsand
petrochemicals,low‐demandcase 49
Figure25:Pulpandpaperheatefficiencypotentials 53
Figure26:Energysavingspotentialin2007forthepulpandpaper,basedonBAT 54
Figure27:India’spulpandpaperenergyconsumptionbyenergysourceandscenarios 56
Figure28
:India’sdirectCO
2
emissionsreductionbytechnologyoptionforpulpandpaper 56
Figure29:GlobaldirectCO
2
emissionsreductionbytechnologyoptionforpulpandpaper 57
Figure30:RegionalcontributiontoreductioninglobaldirectCO
2
emissionsinpulp
andpaper,low‐demandcase 58
Figure31:Specificenergyconsumptionofmetallurgicalaluminaproduction 60
Figure32:Smeltertechnologymix,1990to2008 61
Figure33:Energysavingspotentialin2007foraluminium,basedonBAT 62
Figure34:India’sdirectandindirectCO
2
emissionsinaluminium 64
Figure35:India’sdirectCO
2
emissionsreductionbytechnologyoptionforaluminium 64
Figure36:GlobaldirectCO
2
emissionsreductionbytechnologyoptionforaluminium 65
Figure37:RegionalcontributiontoreducingglobaldirectCO
2
emissionsinaluminium,
low‐demandcases 66
Figure38:India’smaterialsproductionundertheETP2010andstronggrowthcases 71
Figure39:FinalenergyuseinIndia’sindustry 71
Figure40:India’sdirectenergyandprocessCO
2
emissionsbyindustrialsector 72
Figure41:OptionsforreducingdirectCO
2
emissi onsfromIndia’sindustryinthe
stronggrowth case 73
©OECD/IEA2011 EnergyTransitionforIndustry:IndiaandtheGlobalContext
Page|5
Listoftables
TableES.1:India’sdirectCO
2
emissionsreductionbyindustry 10
TableES.2:Production,energyconsumptionandCO
2
emissionsforIndia’s
ironandsteelin du st ry 11
TableES.3:Production,energyconsumptionandCO
2
emissionsforIndia’s
cementindustry 12
TableES.4:Production,energyconsumptionandCO
2
emissionsforIndia’s
chemicalandpetrochemicalindustry 13
TableES.5:Production,energyconsumptionandCO
2
emissi on sfor
India’spulpandpaperindustry 13
TableES.6:Production,energyconsumptionandCO
2
emissionsforIndia’s
aluminiumindustry 14
Table1:India’sindustrialmaterialsproductionandenergyuse,2007 21
Table2:India’smaterialsdemandinkilogramspercapita(kg/cap) 22
Table3:India’stotalfinalenergyusebyindustry,Mtoe 23
Table4:India’sdirectCO
2
emissionsbyindustry,MtCO
2
24
Table5:Globalsteelproduction,2007 27
Table6:India’sironandsteelproductionbyscenarios,Mt 31
Table7:Technologyoptionsfortheironandsteelindustry 35
Table8:Globalcementproduction,2007 36
Table9:India’scementindustrymainindicatorsbyscenarios 39
Table10
:Technologyoptionsforthecementindustry 43
Table11:PotentialenergyimprovementsbyBPTintheglobalchemicaland
petrochemicalsector,2006(includingbothprocessenergyandfeedstockuse)
a
45
Table12:India’sHVC,ammoniaandmethanolproduction 47
Table13:Technologyoptionsforthechemicalandpetrochemicalindustry 50
Table14:Globalpaperandpaperboardproduction,2007 51
Table15:India’spulpandpaperproductionbyscenarios 55
Table16:Technologyoptionsforthepulpandpap
erindustry 58
Table17.Globalprimaryaluminiumproduction,200 7 59
Table18:India’saluminiumproductionbyscenarios 63
Table19:Technologyoptionsforthealuminiumindustry 67
Table20:GDPprojections(%peryear,basedonpurchasingpowerparity) 69
Table21:High‐leveli
ndicatorsforIndiainETP2010andstronggrowthcases 70
Table22:India’smaterialsdemandpercapita,kg/cap 70
TableA.1:Demandprojectionforindustry,kg/cap 75
TableA.2:MaterialsproductionintheBaselineScenario,Mt 75
TableA.3:MaterialsproductionintheBLUESce
nario,Mt 77
TableA.4:FinalenergyuseinindustryintheBaselineScenario,Mtoe 79
TableA.5:FinalenergyuseinindustryintheBLUEScenario,Mtoe 79
TableA.6:DirectCO
2
emissionsinindustryintheBaselineScenario,MtCO
2
80
EnergyTransitionforIndustry:IndiaandtheGlobalContext ©OECD/IEA2011
Page|6
TableA.7:DirectCO
2
emissionsinindustryintheBLUEScenario,MtCO2 80
TableB.1:BPTvaluesonthespecificenergyconsumptionfortheproduction
ofkeychemicals(left:infinalenergyterms,denotedwithindex”f”;right:
inprimaryenergyterms,denotedwithindex“p”)
1
82
Listofboxes
BoxES.1:Scenariosfortheindustrialsector 9
Box1:TheETP2010scenarios 23
©OECD/IEA2011 EnergyTransitionforIndustry:IndiaandtheGlobalContext
Page|7
Acknowledgements
ThispaperwaspreparedbystaffoftheInternationalEnergyAgency’sDirectorateofSustainable
EnergyPolicyandTechnologyincollaborationwiththeDirectorateofGlobalEnergyDialogue.
A number of Indian experts have contributed significantly to improving the data and analysis
presented in this paper. The IEA is grateful for the
contribution of the India Energy Technology
Perspectives Expert Group and wishes to thank the then Secretary, Ministry of Power, H. S.
Brahma for establishing the India Energy Technology Expert Group to work with the IEA in
preparingEnergyTechnology Perspectives2010.
The expert group provided invaluable insights to our team
to develop the India analysis. The IEA
wish to thank for their important contributions: S.M. Dhiman, Member (Planning), Central
Electricit y Auth orit y ,chairmanoftheExpertgroup;DilipChenoy,DirectorGeneral,SocietyofIndian
Automobile Manufacturers (SIAM), chairman of the transportation sub‐group; I.C.P.Keshari,Joint
Secretary,MinistryofPower,chairman
ofthepowersub‐group;Dr.AjayMathur,DirectorGeneral,
Bureau of Energy Efficiency (BEE), chairman of the buildings sub‐group; V. Raghuraman, Chief
Adviser, Jaguar Overseas Ltd, chairman of the industry sub‐group; A. S. Bakshi, Chief Engineer,
Central Electricity Authority (CEA); Amarjeet Singh, Chief Engineer (C&E), (CEA); Anita Gahlot,
DeputyDirector,CEA;andtheconvenerandmembersofthesub‐work ing groups:
Sub‐Groupfo rPowersector
:SewaBhawan,R.K.PuramChiefEngineer,CEA(convener);Ms.Shruti
Bhatia,ConferederationofIndianIndustry(CII);Dr.Pradeep Dadhich,SeniorFellow,The Energy
and Resources Institute (TERI); Mr. D.K.Dubey, AGM (CCT); Shri P.K. Goel, Director, Ministry of
Power; Shri R.B. Grover, Scientific Adviser, Departm ent of Atomic Energy (DAE); Shri D.K. Jain,
ExecutiveDirector (Engg),NTPC Ltd; Dr. Sudhir Kapur, Member CII National Committee on Power
and MD & CEO‐CountryStrategyBusine ss ; Shri R.K. Kaul, Joint Advisor,PlanningCommission; Sh.
Sanjeev Mahajan, DGM (PE‐CCT) ; Shri Sudhir Mohan, Advisor, Ministry of New and Renewable
Energy (MNRE); Mr.B.H.Narayana, Addl.Dir.,
Central Power Research Institute(CPRI); Mr.Sunil
Parwani, Addl. General Manager (Power Sector‐Planning & Monitoring), BHEL; Shri D.N. Prasad,
Director,MinistryofCoal;ShriR.K.Sethi,Director,MinistryofEnvironmentandForests(MOEF);Sh.
ArunSrivastavaScientificOfficer/Engineer‐H,(StrategicPlanningGroup),DAE.
Sub‐GroupforBuildingssector
:Sh.SanjaySeth,EnergyEconomist,BEE(Co nvener);Mr.Pradeep
Kumar,SeniorFellow,TERI;Mr. K.I.Singh,GM(PE‐Infrastruct ureServices),NTPCLtd;Mr.S.Srinivas,
Principal Counsellor, CII Green Business Centre, Hyderabad; Sh. Lekhan Thakkar, Vice President,
GujaratUrbanDevelopmentCompanyLtd.(GUDC);Dr.Vakil,CEPTUniversity,Ahmedabad.
Sub‐Group for
Industry sector:Sh. Amarjeet Singh, Chief Engineer (C&E), CEA (Convener); Shri
B.N.Bankapur,Director(Ref),IndianOilCorporation(IOC);Mr.M.R.Gandhi,Scientist‐G,Central
Salt&MarineChemicalResearchInstitute;Dr.SatishKumar,ChiefofParty,USAIDECO‐IIIProject,
IRG; Sh. A. Panda, ED (S&EP); Shri K. Murali, Director (Ref), Hindustan Petroleum
Corporation
Limited (HPCL); Sh. U. Venkata Ramana; Sh. Gautam Roy, GM(T); Mr. Ambuj Sagar, Indian
Institute of Technology Delhi (IIT); Mr. Girish Sethi, Director(EET Division), TERI; Mr. S.P. Singh,
GM (E&P); Sh. S.B. Thakur, DGM (S&EP); Mr. K.S. Venkatagiri, Principal Counsellor, CII Green
BusinessCentre,Hyderabad;SaurabhYadav,Knowledge
ManagementSpecialist,BEE.
Sub‐Group for Transport sector
: Smt. Neerja Mathur, Chief Engineer (OM), CEA(Convener);
Dr.Ajit Gupta, Retd. Advisor, MNRE; Mr. Saurabh Dalela, Addl. Dir, NATRiP; Sh. Dinesh Tyagi,
Director(Tech)NationalAutomotiveTe stingandR&DInfrastructureProject(NATRiP).
EnergyTransitionforIndustry:IndiaandtheGlobalContext ©OECD/IEA2011
Page|8
AswellasallotherparticipantsattheJointIEA‐IndiaWorkshoponRegionalAnalysisofIndiawho
provided valuable comments and feedback on the Indian analysis including, but not limited to:
Suresh Chander, Chief Engineer, CEA; K.K. Roy Chowdhury, Technical Associate, Cement
Manufacturers’ Association; Sriganesh Gandham, GM‐ Corporate R&D, HPCL;
Shri Alok kumar
Goyal, Scientist, CPRI; Praveen Gupta, Director, CEA; Shri A.K. Gupta, Chief Engineer, CEA; Ravi
Kapoor, USAID, ECO‐III; Shri S. M. Kulkarni, Hindalco; A.K. Kulshreshtha, CDE (PE‐Mech); Rajesh
Kumar, Assistant Director, CEA; Mr. R.C Mall, IPMA; Dr. Nand, Fertiliser Association of India; P.
Pal, Deputy GM,
Engineering; Prof. V.K. Paul, Head of the Dept of Building Engineering &
Management; Shri M.S. Puri, Chief Engineer, CEA; Prof. P.K. Sarkar, Professor of Transport
Planning; Naveen Kumar Sharma, GM, Grinding Unit, JK Lakshmi Cement Ltd.; K. Sheshadri,
Assistant Director I, CEA; Shri Avtar Singh, Indian Paper Manufacturers Association (IPMA); K.I
Singh,NTPC;HardayalSingh,DeputyDirector,CEA;MajorSingh,ChiefEngineer,CEA;V.K.Singh,
Deputy Director, CEA; Dr. B.P. Thapliyal, Scientist, Central Power Research Institute (CPRI); C.B.
Trivedi,DeputyDirector,CEA;AnilKVarshney,AdditionalVicePresident,BSESRajdhaniPower.
©OECD/IEA2011 EnergyTransitionforIndustry:IndiaandtheGlobalContext
Page|9
Executivesummary
Population growth, the modernisation of lifestyles, higher electrification rates and rapidly
growinggrossdomesticproduct (GDP)in Indiadrivea largeincrease inener gy demandand put
pressure on the security, reliability and affordability of energy supply, all of which are strongly
linkedtoeconomics tabilityanddevelopment.
Globally,theerosion
ofenergy security,thethreatofdisruptivecli matechangeandthegrow ing
energy needs of the developing world all pose major challenges to energy decision makers.
Energy security concerns are compounded by the increasingly urgent need to mitigate
greenhouse‐gas (GHG) emissions, including those relating to energy production and
consumption.
Currentenergyconsumptionandcarbondioxide(CO
2
)emissiontrendsrundirectly
counter to the repeated warnings sent by the United Nations Intergovernmental Panel on
ClimateChange(IPCC),whichconcludesthatonlyscenarios resultingin a50% to85%reduction
ofglobal CO
2
emissionsby2050 (comparedto 2000 levels)canlimitthelong‐term global mean
temperatureriseto2.0°Celsius(°C)to2.4°C(IPCC,2007).
TheBLUEScenario,developedbytheInternationalEnergyAgency(IEA)andpresentedinEnergy
Technology Perspectives 2010 (ETP2010) (IEA,2010), examines the least‐cost pathways
for
meetingthegoalofreducingglobalenergy‐relatedCO
2
emissions to50%of2005levels by2050
while also proposing measures to overcome technical and policy barriers. The BLUE Scenario is
consistentwithalong‐termglobalriseintemperaturesof2.0°Cto3.0°C,butonlyifthereduction
inenergy‐relatedCO
2
emissionsiscombinedwithdeepcutsinotherGHGemissions.
ThescenarioenvisagedintheBLUEScenariorequiredCO
2
emissionsreductionacrossalltheenergy‐
consumingsectors. Forindustry,acti onisparticularlycrucialinthefivemost energy‐intensivesectors:
iron and steel; cement; chemicals and petrochemicals; pulp and paper; and aluminium. Globally,
these sectors currently account for 77% of total direct CO
2
emissions from industry; in India, they
accountfor56%ofindustrialenergyconsumptionand 82%ofdirectCO
2
emi ssion s.
BoxES.1:Scenariosfortheindustrialsector
Each country and region of the world will contribute differently to the reduction in emis sions
from the industrial sector, depending on the expected growth in production as well as the
potentialforenergyandCO
2
savings.
InETP2010,theIEAdevelopedtwodifferentscenariostoanalysetheindustrialsector:
TheBaselineScenarioreflectsdevelopmentsthatareexpectedonthebasisoftheenergypolicies
thathavebeenimplementedorthathavebeenapprovedandaretobeimplemented.
TheBLUEScenarioistarget‐drivenandaimstoachievetotalemissionsfromtheindustrythatare
24%lowerin2050thanthe2007level.
Given the recent global economic crisis and uncertainties about projecting long‐term growth in
consumption of materials, the IEA also developed two different cases for each scenario: a low‐
demandandahigh‐demandcaseforindustrialmaterials.Theindustriallow‐demandcaseisused to
developtheglobalBLUEScenariopresentedinETP2010.
Going beyond the analysis presented in the ETP2010, the IEA has developed an alternative strong
growthcase forIndia. Inthisalternativecase,thefuturegrowthof GDPishigherthanthatusedfor
thedevelopmentofETP2010.
EnergyTransitionforIndustry:IndiaandtheGlobalContext ©OECD/IEA2011
Page|10
Inthe caseofIndia,total industrialenergyconsumption between2007and2050 isexpected to
grow 3.5 times under the Baseline low‐demand scenario and4.2 times under the high‐demand
scenario. By implementing policies and measures defined in the BLUE Scenario, energy
consumptioninIndiawouldbehigherin
2050thanin2007,butbetween121million tonnesofoil
equivalent(Mtoe)and140MtoelowerthanintheBaselineScenarioin2050.Inanyscenario,the
finalenergyusein2030and2050issignificantlyhigherthantoday.
Nosingleoptioncanyieldthenecessaryemissionreductions.Energy
efficiencyalonewillnotbe
sufficient to reduce emissions in the industrial sector as the production growth in India by far
exceeds the savings potential from energy efficiency. Gover nment policies are needed to
facilitateatransitiontomoreefficientandlower‐carbontechnologies.
Asignificantreduction inCO
2
emissions in Indianindustry willonlybe possible ifallsub‐sectors
contribute. Direct industry emissions can only be limited to an increase of 100% and 268% of
currentlevelsby2050ifallsub‐sectorssignificantlyreducetheirfutureemissionsbelowthelevel
anticipated in the Baseline Scenario (Table
ES.1). In the BLUE Scenario, all sub‐sectors need to
reduceemissionssubstantiallyin2050and,fortheoverallindustrialsector,obtainlevelsthatare
46%(low‐demandcase)and51%(high‐demandcase)lowerthanintheBaselineScenario.
TableES.1:India’sdirectCO2emissionsreductionbyindustry
Total
industry
Iron and
steel
Cement
Chemicals and
petrochemicals
Pulp
and
paper
Aluminium
Other
industries
Direct CO
2
emissions in industry, Mt CO
2
2007 413 151 128 48 8 4 74
2050
Baseline low-demand 1 564 703 422 132 36 14 256
Baseline high-demand 1 852 858 483 173 62 21 256
Baseline strong growth 2 807 1 153 1 060 229 87 22 256
BLUE low-demand 827 333 275 68 17 12 122
BLUE high-demand 906 362 291 77 31 16 129
BLUE strong growth 1 519 532 676 119 50 22 122
Changes in BLUE 2050 vs. 2007
BLUE low-demand 100% 121% 114% 42% 113% 214% 65%
BLUE high-demand 120% 140% 126% 61% 285% 321% 74%
BLUE strong growth 268% 253% 426% 149% 507% 469% 65%
Changes in BLUE 2050 vs. Baseline 2050
BLUE low-demand -47% -53% -35% -48% -52% -16% -53%
BLUE high-demand -51% -58% -40% -55% -49% -24% -50%
BLUE strong growth -46% -54% -36% -48% -43% -1% -53%
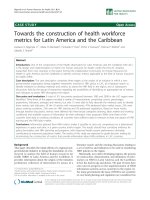
Eachindustrialsub‐sectorwillcontributetolimitthegrowthindirectCO
2
emissionsinIndiaunder
the BLUE low‐demand scenario (FigureES.1). Direct CO
2
emissions reduction is limited in the
aluminiumsectorgivenitshighshareofelectricityuse.Theironandsteelsectorwillcontributethe
©OECD/IEA2011 EnergyTransitionforIndustry:IndiaandtheGlobalContext
Page|11
mosttothereduction.Thescenarioisconsistentwitha50%reductioninglobalCO
2
emissionsand
a24%reductionintheglobalindustrysectorin2050,comparedtothe2007level.
FigureES.1:India’sdirectCO
2
emissionsreductionbyindustryinthelow‐demandcase
Ironandsteel
India’scrudesteelproductionisprojectedtoincreasefivetotentimesbetween2007and2050,
underboththeBaselineandBLUEscenarios.Energyconsumptionalsoincreasesbutataslower
pace(TableES.2).Severaloptionsexistintheironandsteelsectortoreducethelevelofenergy
use and associated CO
2
emissions. In the BLUE Scenario, energy consumption in 2050 is about
28% lower than in the Baseline Scenario. Direct CO
2
emissions in 2050 in the BLUE Scenario
wouldbetwiceashighthanin2007,butabout50%lowerthanintheBaselineScenario.
TableES.2:Production,energyconsumptionandCO
2
emissi on sforIndia’sironandsteelindu stry
2007 Baseline–2050 BLUE–2050
low‐
demand
high‐
demand
strong
growth
low‐
demand
high‐
demand
strong
growth
Crudesteelproduction
(Mt)
53 266 355 550 266 355 550
Energyconsumption
(Mtoe)
38 173 211 286 122 153 209
DirectCO
2
emissions
(MtCO
2
)
151 703 858 1153 333 362 532
TheresultsoftheBLUEScenarioarebasedonthepursuitoffourmaintechnicaloptions:
Improving energy efficiency through the deployment of existing best available technologies
(BATs)andthedevelopmentofnewtechnologies;
Fuel switching through gas‐based direct reduced iron (DRI), reducing coal‐based DRI
production,usingCO
2
‐freeelectricityandhydrogen;
Improvingthematerialsflowmanagement(highrecyclingrates);and
Providingcarboncaptureandstorage(CCS).
EnergyTransitionforIndustry:IndiaandtheGlobalContext ©OECD/IEA2011
Page|12
Cement
DemandforcementinIndiawillbebetween3.8and9.7timeshigherin2050thanitwasin2007.
ProductionisprojectedtobethesameundertheBaselineandBLUEscenarios(TableES.3).
TableES.3:Production,energyconsumptionandCO
2
emissionsforIndia’scementindustry
2007 Baseline–2050 BLUE–2050
low‐
demand
high‐
demand
strong
growth
low‐
demand
high‐
demand
strong
growth
Cementproduction(Mt) 170 646 742 1656 646 742 1656
Energyconsumption
(Mtoe)
13 42 48 105 48 55 126
DirectCO
2
emissions
(MtCO
2
)
128 422 483 1060 275 291 676
Based on the technology characteristics of India’s cement industry, it appears clear that the
efficiency of India’s cement production is better than the world average. The majority of large
kilns are among the most energy efficient in the world. As such, little improvement can be
achievedbyapplyingBATsinthese
large kilns,butthereislargepotentialtoimproveefficiencyif
BATisappliedin smallerunits.Othermeasurescoulddeliverlargeenergy and/orCO
2
emissions
reduction.Thosemeasuresinclude:
Improving cement productionenergy efficiencyby deployingexisting BATs for new plants and
smallunits,andphasingoutwetkilnsandretrofittingtomoreenergy‐efficienttechnologies;
Expandingtheuseofclinkersubstitutes;
Fuel switching to less carbon‐intensive fossil fuels, and
expanding the use of biomass and
alterativefuels;and
ProvidingCCS.
Chemicalsandpetrochemicals
India’schemicalandpetrochemicalsectorcontinuestobeveryinnovative,butisitunclearhowit
will develop in future if, for example, substantially higheroil and gas pricesslow demand.Even
though the pace is expected to slow to some extent, the sector is still expected to grow
significantlyin
thecomingdecades,bothinIndiaandglobally.
A growing world population is likely to require more fertilisers to produce food and to meet
increaseddemandforbiomassasafuelandafeedstock.Inthelastfewdecades,thesectorhas
experienced substantial growth world wide. The production of
high‐valued chemicals (HVC)
1
in
India is projected to be between 4.3 and 10times higher in 2050 than in 2007. Ammonia and
methanolproductionwillalsoincreasesubstantially(TableES.4).
1
High‐valuechemicalsincludeethylene,propylenefromthepyrolysisgasofsteamcrackers,benzene(containedamounts,excluding
extractedamounts),butadiene(alsocontained),acetyleneandhydrogen(soldasfuel).
©OECD/IEA2011 EnergyTransitionforIndustry:IndiaandtheGlobalContext
Page|13
TableES.4:Production,energyconsumptionandCO
2
emissionsforIndia’schemicaland
petrochemicalindustry
2007 Baseline–2050 BLUE–2050
low‐
demand
high‐
demand
strong
growth
low‐
demand
high‐
demand
strong
growth
Production(Mt)
‐ High‐valuechemicals 10 45 80 104 39 59 91
‐ Ammonia 13 30 33 47 30 33 47
‐ Methanol 0.1 0.8 1.0 1.4 0.8 1.0 1.4
Totalenergy
consumption(Mtoe)
27 83 126 165 74 100 153
TotaldirectCO
2
emissions(MtCO
2
)
48 132 173 229 68 77 119
Iftheexpectedsubstantialgrowthinthechemicalandpetrochemicalsectoristobesustainable
and consistent with achieving broader goals for CO
2
emissions reduction, steps will need to be
taken,notablyon:
Implementingbestpracticetechnologies(BPT)intheshorttermandnewtechnologiesinthe
longterm;
Expandingtheproductionofbio‐basedplasticsandchemicals,andcontinuingtoswitchaway
fromoilfeedstock;
Improvingtheflowmanagemen t
ofmaterials;and
ProvidingCCS.
Pulpandpaper
Demandfor paperand paperboardinIndiaisexpected to increasefrom 7.7kilogramper capita
(kg/cap) today to 43kg/cap in the low‐demand case, 76kg/cap in the high‐demand case and
120kg/capinthestronggrowthcase.Thesestrongincreasesindemandwilldrivetheproduction
of
paper and paperboard in India from 7.6Mt in 2007 to between 81Mt and 232Mt in 2050.
Despite this strong increase in production, the energy consumption associated with the
production of pulp and paper will only be 6.1 to 15times higher in the BLUE Scenario in 2050
thanin2007(TableES.5).
TableES.5:Production,energyconsumptionandCO
2
emissi onsforIndia’spulpandpaperindustry
2007 Baseline–2050 BLUE–2050
low‐
demand
high‐
demand
strong
growth
low‐
demand
high‐
demand
strong
growth
Production(Mt)
‐ Pulp 4 13 21 19 11 19 16
‐ Paperandpaperboard 8 81 148 232 81 148 232
Totalenergy
consumption(Mtoe)
3 19 33 47 17 31 43
TotaldirectCO
2
emissions(MtCO
2
)
8 36 62 87 17 32 50
EnergyTransitionforIndustry:IndiaandtheGlobalContext ©OECD/IEA2011
Page|14
The following options are available to limit the growth in energy use and associated CO
2
emissionsinthepulpandpaperindustry:
Deploying BATs, including black liquor and biomass gasification, increasing waste heat
recovery, developing and implementing new paper‐drying technologies, and increasing the
useofcombinedheatandpower(CHP);
Fuelswitchingfromfossilfuelstocombustiblebiomass;
Increasingtheuse
ofrecoveredpaper;and
ProvidingCCS.
Aluminium
Indiais animportant playerinthealuminiumsector,especially becauseof itsabundant bauxite
reserves. In 2007, India was the eighth‐largest producer of primary aluminium world wide. The
strong growth in production between 2007 and 2050 (Table ES.6) will mostly be driven by the
growthinaluminiumusedin
transportation,buildingandpowersectors.
TableES.6:Production,energyconsumptionandCO
2
emissionsforIndia’saluminiumindustry
2007 Baseline–2050 BLUE–2050
low‐
demand
high‐
demand
strong
growth
low‐
demand
high‐
demand
strong
growth
Primaryaluminium
production(Mt)
1 11 17 20 10 16 20
Energyconsumption
(Mtoe)
3 16 25 28 14 20 26
DirectCO
2
emissions
(MtCO
2
)
4 14 21 22 12 16 22
Data available on the sector suggest that average energy intensity of primary aluminium
productioninIndiaiscurrentlyclosetotheworldaverage.Thereisstillroomtofurther improve
theenergyefficiencyandreduceCO
2
emissionsby:
Implementingenergyefficiencymeasuresinbothrefiningandsmelting;
Increasingtheuseoflow‐carbonelectricitysources;
Increasingrecycling;and
Introducingnewsmeltingtechnologies.
Transitiontoalow‐carbonenergyfuture
Atrulyglobalandintegratedenergytechnologyrevolutionisessentialtoaddresstheintertwined
challengesofenergysecurityandclimatechangewhilealsomeetingthegrowingenergyneedsof
thedevelopingworld.ForIndiatoplayitspartinrealisingtheglobalgoalsoftheBLUEscenario,it
willneed to
achieve rapideconomicdevelopmentoverthenext 40years withonly avery small
increaseinCO
2
emissions.Currentlythereisnoprecedentforsuchalow‐CO
2
developmentpath.
It will need to be based on meeting the increasing energy needs of India’s growing population
throughthewidespreaddeploymentofarangeofexistingandnewlow‐carbontechnologies.
©OECD/IEA2011 EnergyTransitionforIndustry:IndiaandtheGlobalContext
Page|15
In the industrial sector, the application of BATs and the development of breakthrough
technologieswillhelpinreducingemissions.CCSwillbeneededtokeeptheincreaseinemissions
inlinewiththeoverallreductiontargets.PriorityshouldbegiventoreducingtheCO
2
intensityin
the three largest industri al sectors (iron and steel, chemicals and petrochemicals and cement).
Specialattentionshouldfocusoncoal‐basedDRI,pulpandpapermakingandsmall‐scalecement
kilns.Therethreeareasofferinterestingopportunitiestoincreaseefficiencyandlimitthegrowth
inenergyconsumption.
Thechallenge
forIndiawillbetoachieveastrongeconomicgrowthwhileimprovingtheirenergy
security but without locking in high emissions. In identifying the step towards achieving this,
national technology roadmaps for the most promising low‐carbon technologies should be
developed. It will also require international collaboration on a number of
initiatives. Enhanced
internationalco‐operationforresearching,developing,sharingandtransferringtechnologieswill
be required. International mechanisms for reducing carbon such as the Clean Development
Mechanism(CDM)willneedtoplayaroleindeployinglow‐carbonenergytechnologiesinIndia.
EnergyTransitionforIndustry:IndiaandtheGlobalContext ©OECD/IEA2011
Page|16
©OECD/IEA2011 EnergyTransitionforIndustry:IndiaandtheGlobalContext
Page|17
Introduction
Thefourthas sessmentreportoftheUnitedNations IntergovernmentalPanelonClimateChange
(IPCC), released in Novem ber 2007, concluded that global carbon dioxide (CO
2
) emissions must
bereducedbybetween50%and85%by2050(comparedto2000levels)ifglobalwarmingisto
belimitedtobetween2.0°Celsius(°C)and2.4°C.
Following the publication of the IPCC report, the urgency to address climate change rose
significantly.AgeneralguidelineisthatglobalCO
2
emissionsmustbehalved.
In 2010, the International Energy Agency (IEA) pub lished Energy Technology Perspectives 2010
(ETP2010)(IEA,2010).Thebookexplainshowtotransformtheglobalenergyeconomyoverthe
coming decades. A BLUE Scenario was developed to explore the energy and technology
implicationsofreducingglobalenergy
‐relatedCO
2
emissionsto50%ofthe2005levelsby2050.If
fullyimplemented,theBLUEScenariocouldlimitthelong‐termglobalmeantemperatureriseto
between 2.0°C and 3.0°C. The analysis indicates that beyond 2030, the end‐use sectors
(residential, services, industry and transport) have an increasingly important role to
play in
reducing emissions (Figure1). Achieving such a significant reduction requires maximum energy
efficiencyworldwideandavirtuallydecarbonisedpowersector.
Figure1:GlobalCO
2
emissionsreductionbysectorintheBLUEScenario
Note: CO
2
emissions savings from fuel transformation have been allocated to the transport sector and the reduction in CO
2
from
electricitysavingshasbeenallocatedtoend‐usesector.
Source:IEA,2010.
Toachievea50%reductioninCO
2
emissionsgloballyby2050,ETP2010calculatedthat,basedon
a“least‐costapproach”,industrywouldhavetoreduceits overallemissionsto24% ofthe2007
levelsby 2050. Thecontributionfrom different countries andindustrial sectorsvaries according
to their respective potential to reduce emissions through energy efficiency,
the availability of
fuel‐switching and recycling options, and their potential for deploying carbon capture and
storage(CCS).
EnergyTransitionforIndustry:IndiaandtheGlobalContext ©OECD/IEA2011
Page|18
AspartoftheETP2010analysis,theBaselineandBLUEscenariospresentedinthepreviou s ETP
report(ETP2008,IEA,2008a)havebeenelaboratedtoincludemoreinformationonthefollowing
fourcountries/regions:China,India,OECDEurope
2
andtheUnitedStates.
ThisworkingpaperfurtherdevelopstheanalysispresentedintheIndiachapterofETP2010and
provides insights on the implications of achieving deep energy and CO
2
emission cuts in the
industrial sector both for India and globally. It investigates
from a Baseline Scenario the least‐
cost options to significantly reduce energy and CO
2
emissions in India’s industrial sector, while
enablingtheIndianeconomytocontinuetogrowandalleviateenergypoverty.Itdoes sofroma
techno‐economical perspective– buildingondetailed resource andtechnology data forIndia.It
also identifies the key technologies for India, as well as the energy and CO
2
savings that would
resultfromtheirdeployment.Itanalysesthepossibilitiesforenergyefficiencyimprovementsand
CO
2
emissions reductionforthe fivemost energy‐intensiveindustrialsectorsincluding:iron and
steel; cement; chemicals and petrochemi cals; pulp and paper; and aluminium. Each sector
presentsareviewofrecenttrendsbasedonthelatestIEAindustryindicators
3
andananalysisof
thepotentialofexistingtechnologiestoincreaseenergyefficiencyandreduceCO
2
emissionsfor
Indiaandfortheworld.
Theintentisnot
toexami newhatkindofenergysavingsorCO
2
emissionsreductionIndiashould
makeinthefutureoranalysehowtoachievethedeployment oflow‐carbontechnologyinIndia,
or what technology transfer should look like and in which areas it would be needed. However,
discussionofgenerictechnologytransferissuesisincludedinETP2010.
Thepaper
comprisesthreechapters:
Chapter1pr ovidesanoverviewoftheresultsfortheindustrialsectorbothforIndiaandforthe
world.Theresults arepresentedforthetwodifferentvariantsoftheindustrialsectorincludedin
ETP2010–thelow‐andhigh‐demandcases.
Chapter 2 examines the
energy and emissions trends by sub‐industry, both for India and the
globaleconomy.Italsoprovidesinsightsintothefutureenergytechnologiesthatwillplaya part
inreducingemissionsforIndiaandatthegloballevel.
Chapter 3 presents an alternative case using stronger growth in gross domestic product
(GDP)
and materials production for India. The “strong growth” case shows the implication of a strong
growth in India assuming the same level of research, development, demonstration and
deployment(RDD&D)andthecarbonpriceisthesameasintheBLUEScenario.
2
OECD Europe includes: Austria, Belgium, Czech Republic, Denmark, Finland, France, Germany, Greece, Hungary, Iceland, Ireland,
Italy, Luxembourg, the Netherlands, Norway, Poland, Portugal, Slovak Republic, Spain, Sweden, Switzerland, Turkey and the United
Kingdom.
3
Inthecontextofthispublication,an“indicator”isdefinedasanyinformationthathelpstoexplainanenergysituationorachangein
energy at the economy, industry, country or global level. Indicators in this paper include: energy intensity; use of a particular
technologyorfeedstock;efficiencyimprovement;and
savingspotential.
©OECD/IEA2011 EnergyTransitionforIndustry:IndiaandtheGlobalContext
Page|19
Chapter1.Industryoverview
In India, industrial energy use
4
reached 150million tonnes of oil equivalent (Mtoe) in 2007
accounting for 38% of the country’s final energy used. From a global persp ective, India is the
fourth‐largest industrial energy consumer with a 5% share of total industrial energy use,
surpassedonlybyChina,theUnitedStatesandRussia(Figure
2).
Globally,industryaccountsforone‐thirdofalltheenergyusedandforalmost40%ofworldwide
carbon dioxide (CO
2
) emissions. In 2007, total final energy use in industry amounted to
3019Mtoe.Directemissions
5
ofCO
2
inindustryamountedto7.6gigatonnesofCO
2
(GtCO
2
)and
indirectemissions
6
to3.9 GtCO
2
.ReducingCO
2
emissionsfromindustrymustbeanessentialpart
of a global action to prevent dangerous climate change. The International Energy Agency (IEA)
analysis shows that industry will need to reduce its current direct emissions by about 24% of
2007levelsifitistohalveglobalemissionsfrom2005levels
by2050.
Figure2:Industrialenergyusebyregion,2007
Note:Thisincludescokeovens,blastfurnacesandpetrochemicalfeedstock.
Sources:IEA,2009b;IEA,2009c.
The five most energy‐intensive industrial sectors (iron and steel, cement, chemicals and
petrochemicals, pulp and paper, and aluminium) accounted for 56%of India’s industrial energy
consumption in 2007. Globally, these five sectors accounted for 66% of industrial energy
consumption(Figure3).
4
Inthisdoc ument,ironan dsteelincludesenergyuseforcokemaking.Theenergydataforchemicalsandpetrochemicalsincludefeedstock.
5
Directemissionsincludefuelcombustionandprocess‐relatedCO
2
emissionsfromwithintheindustry.
6
Indirectemissionsareemissionsfromthepowergenerationsectorduetoelectricityuseinindustry.
EnergyTransitionforIndustry:IndiaandtheGlobalContext ©OECD/IEA2011
Page|20
Figure3:Industrialfinalenergyconsumptionbysub‐sectorinIndiaandintheworld,2007
Note:Thisincludescokeovens,blastfurnacesandpetrochemicalfeedstock.
Sources:IEA,2009b;IEA,2009c;IEAanalysis.
The final energy mix of Indian industry is dominated by coal and oil (Figure4). The share of
biomassuseinIndianindustryislargecomparedtoother countries.InIndia,industryconsumes
about45%ofallelectricitygeneratedinthecountry.Intheindustrialsector,electricityaccounts
for 15% of
energy consumption. About 30% of the electricity used by industry is generated by
captivepowerplants.
7
Figure4:IndustrialfinalenergymixinIndiaandintheworld,2007
Note:Thisincludescokeovens,blastfurnacesandpetrochemicalfeedstock.
Sources:IEA,2009b;IEA,2009c.
Animportantshortcoming of the data on India’s energy use, asreportedin theIEA statistics, is
that over 22Mtoe of electricity, 28Mtoe of biomass and waste, and 7Mtoe of natural gas
consumption are not allocated to particular sub‐sectors but are reported under “non‐specified
industry”.Overall,
about43%ofindustrialenergyuseinIndiaisreportedunderthenon‐specified
7
Captivestationsareunitssetupbyindustrialplantsfortheirexclusivesupply.
©OECD/IEA2011 EnergyTransitionforIndustry:IndiaandtheGlobalContext
Page|21
category(Table1).Furthermore,thestatisticsforbiomassconsumptionarehighlyuncertain.Asa
consequence,itisnotpossibletoperformdetailedenergyefficiencyanalysesfortheindustryas
awholebasedonthesedata.TheIEAhasdevelopedestimatesofIndia’senergyconsumptionby
compiling a mixture of top‐down
and bottom‐up sources. The energy use as reported in IEA
statistics(IEA,2009c)aswellastheestimatesusedinthecurrentanalysisarepresentedinTable
1.Theseestimatesarebasedoncurrentproductionlevelsandenergyintensitiesfromarangeof
sources.Thereisstillaneed
tovalidatethesedata.
Table1:India’sindustrialmaterialsproductionandenergyuse,2007
Production
Reported
energy use
Reported
electricity use
Estimated
energy use
Estimated
electricity use
Estimated
direct CO
2
emissions
(Mt) (Mtoe) (Mtoe) (Mtoe) (Mtoe) (Mt CO
2
)
Industry sector 150 22 150 22 413
Iron and steel 53 33 38 3.3 151
Chemicals and
petrochemicals
27 27 48
Non-ferrous metals
0.4
Total aluminium
2 - - 2.9 1.6 3.8
Non-metallic minerals
11
Cement
170 - - 13 1.1 128
Pulp, paper and
printing
1.4
8.2
Paper and
paperboard
8 - - 1.4 0.4
Pulp
4 - - 1.7 0.3
Recovered paper
1 - - 0.1 0.0
Food and tobacco
10 n.a. n.a. n.a.
Textile and leather 1.3 n.a. n.a. n.a.
Other
2 66 15 74
Non-specified industry 65 22
Notes:Iron andsteelincludesenergyuseforcoke makingand theenergydata forchemicalsandpetrochemicals include feedstock.
Thetablehasbeencompiledfromamixtureoftop‐downandbottom‐upsourcesandsothetotalsmaynotmatch.
Sources:Worldsteel,2009;USGS,2009a;IAI,2009a;IPMA,2010a;
IEA,2009a,b,c;IEAanalysis.
Energy and CO
2
savings potential in India, based on best
availabletechnologies
8
InordertoquantifytheenergyandCO
2
savingspotentialbyapplyingbestavailabletechnologies
(BATs), the IEA developed a top‐down approach. In this approach the theoretical minimum
energyconsumptioniscalculatedbyassumingeachprocessinasectorwouldapplyBAT(orbest
practice technology [BPT] in the case of the chemical and petrochemical sector). In
order to
assess the potential reduction inenergy and CO
2
emissions, the estimatedenergy consumption
valuesarecomparedtothereportedactualenergyconsumption.
8
Defining best available technology (BAT) requires consideration of bothtechnical and economic factors. In the IEA’s analysis, BAT
designation in relation to energy efficiency in a particular industry has been drawn from a range of sources, including technical
documentation produced for the European Union Directive 96/61/EC concerning integrated pollution prevention
and control, and
other technical and peer reviewed literature. In contrast to BAT, BPT is a term that applies to technologies and processes that are
currentlydeployed.BATcould,inmanycases,beidenticaltoBPT.Inothercases,anewtechnologymayhavejustemergedbutisnot
yetdeployed.
Ifthisisthecase,theBATenergyefficiencymaybebetterthanBPT.
EnergyTransitionforIndustry:IndiaandtheGlobalContext ©OECD/IEA2011
Page|22
Asisthecaseinmostcountries,significantenergyandCO
2
savings inIndianindustryarepossible
when BATs are implemented. It is estimated that applying BATs in the five industrial sectors
analysed(ironandsteel,pulpandpap er,chemicalsandpetrochemicals,cementandaluminium)
couldreduceIndia’sfinalenergyuse bybetween10%and25%. TotalestimatedsavingsinIndia
could amount to 17Mtoe per year, which is equivalent to 11% of the industrial energy
consumptionin2007and4%ofIndia’stotalenergyconsumption.
The BAT analysis does not take into account the potential improvements in energy efficiency
fromindustrialcaptivepowerplants.Itisimportanttoanalysethe
energyefficiencypotentialof
those captive plants to assess the overall reduction potential. However, the peculiarities of
India’sindigenousresourcesandindustry,suchasthehighsilica contentinironore,low‐quality
coalandtheexistenceofnumeroussmall‐scaleplants,meansthatthesesavingsmightbeharder
to
achieveand maybe overstated. Furthermore,it will notbe possible toachievethese savings
immediately. The rate of implementing BATs in practice depends on a number of factors,
includingcapitalstockturnover,relativeenergycosts,rawmaterialavailability,ratesofreturnon
investmentandregulation.
IEAscenariosforIndia’sindustrialsector
Worldwide implementation of BATs is just the first step in improving energy efficiency and
makingdeepcutsinCO
2
emissionsinindustry.Adetailedmodellingframewor kisusedtoanalyse
the long‐term potential for new technologies to improve energy efficiency and reduce CO
2
emissionsandtoexaminedifferentscenariostotheyear2050.
IfIndia follows atraditionalgrowth modelwithatransitionfromanagriculturalsocietyto ahighly
urbanised society, the need for materials will be enormous. This is reflected in the demand
projecti onsfor2030and2050(Table2)and
raisesquestionsreg ardingtheavailabilityofresources.
Table2:India’smaterialsdemandinkilogramspercapita(kg/cap)
2007
2030
2050
low-demand high-demand low-demand high-demand
Primary aluminium 0.9 3.5 5.9 6.3 8.8
Cement 151 325 364 400 460
Chemicals and petrochemicals
HVC
9 17 27 28 50
Methanol
0.1 0.4 0.4 0.6 0.7
Ammonia
12 16 19 19 23
Iron and steel 49 150 175 200 250
Paper and paperboard 8 23 39 43 76
Industrial materials production, energy use and CO
2
emissions are all projected to rise. As the
production of materials increases, industrial energy consump tion is expected to reach between
524Mtoeand634Mtoein2050undertheBaselineScenario(Table3).
©OECD/IEA2011 EnergyTransitionforIndustry:IndiaandtheGlobalContext
Page|23
Table3:India’stotalfinalenergyusebyindustry, Mtoe
2007
Baseline – 2050 BLUE – 2050
low-demand high-demand low-demand high-demand
Aluminium 3
16 25 14 20
Cement 13
42 48 49 55
Chemicals and petrochemicals 27
83 126 74 100
Iron and steel 38
173 211 122 153
Pulp and paper 3
19 33 17 31
Other industries 66
191 191 126 134
Total 150
524 634 402 624
Sources:IEA,2009c;IEAanalysis.
The Baseline Scenario considers all policies implemented to date. A BLUE Scenario, in which global
industrial energy‐related emissions would be 24% lower by 2050 compared to 2007 levels, has been
investigatedwithmaximumuse ofenergyefficiency,highlevelsofrecycling,greatersharesofbiomassuse
andtheimplementationof
carboncaptureandstorage(CCS)intheironandsteel,cement,chemical,and
pulpandpapersectors.IntheBLUE ScenarioforIndia,finalenergyuseis approximately22%lowerthanin
the Baseline Scenario, but still between 2.7 and 3.3times higher than the 2007 level. Because the
product ion
growthfarexceedsthesavingspotentialfromenergyefficiencyandotherreductionoptions,in
allscena riosthefinalenergyusein2030and2050willbesignificantlyhigherthantoday.
Box1:TheETP2010scenarios
IntheBaselineScenario forIndia,totaldirectindustrialCO
2
emissionsareprojectedtorisefrom
413milliontonnes ofCO
2
(MtCO
2
)in 2007 tobetween1568 Mt CO
2
and 1852MtCO
2
in 2050
(Table 4). In the BLUE Scenario, total industrial CO
2
emissions rise by a much lower rate to
TheETP2010BaselineScenariofollowstheReferenceScenario,outlinedintheWorldEnergyOutlook
2009,to2030,andthenextendsitto2050.TheBaselineScenarioassumesthatgovernmentswillnot
introduce new energy and climatepolicies. In contrast, the BLUE Scenario(with several variants) is
target‐orientated:itsetsthegoalofhalvingglobalenergy‐relatedCO
2
emissionsby2050(compared
to 2005 levels). It examines the least‐cost means of achieving that goal through the deployment of
existingandnewlow‐carbontechnologies.
These scenarios are not predictions. They are internally consistent analyses of the least‐cost
pathways that may be available to meet energy policy objectives, given a certain set of optimistic
technologyassumptions.
For the industry sector, given the recent global economic crisis and uncertainties about projecting
long‐term growth in consumption of materials, a low‐demand and a high‐demand case have been
developedforeachindustryandforallcountriesanalysed.Inthefivesectorscoveredinthisanalysis,
the difference in materials demand between the low‐ and high‐demand cases to 2050 varies by
between 20%and 50%. As both the BLUE low‐ and high‐demand scenarios aim to achieve the same
levelof CO
2
emissionsin 2050,agreater reduction inemissions levels is neededin the high‐demand
casethaninthelow‐demandone.As aresult,costsarealsohigherinthehigh‐demandcase.
The industrial scenarios take an optimistic view of technology development and assume that
technologies are adopted as they become cost‐competitive. The analysis does not assess the
likelihoodoftheseassumptionsbeingfulfilled.ButitisclearthatdeepcutsinCO
2
emissionscanonly
beachievedifallcountriesplaytheirpart,bothinseekingtoachievethatoutcomeandindeveloping
anddeployingthetechnologiesthatcanhelptobringitabout.