The Role of Gestures and Facial Cues in Second Language Listening Comprehension pptx
Bạn đang xem bản rút gọn của tài liệu. Xem và tải ngay bản đầy đủ của tài liệu tại đây (178.57 KB, 39 trang )
The Role of Gestures and Facial Cues in Second
Language Listening Comprehension
Ayano Sueyoshi and Debra M. Hardison
Michigan State University
This study investigated the contribution of gestures
and facial cues to second-language learners’ listening
comprehension of a videotaped lecture by a native speaker
of English. A total of 42 low-intermediate and advanced
learners of English as a second language were randomly
assigned to 3 stimulus conditions: AV-gesture-face
(audiovisual including gestures and face), AV-face (no
gestures), and Audio-only. Results of a multiple-choice
comprehension task revealed significantly better scores
with visual cues for both proficiency levels. For the higher
level, the AV-face condition produced the highest scores;
for the lower level, AV-gesture-face showed the best
results. Questionnaire responses revealed positive atti-
tudes toward visual cues, demonstrating their effective-
ness as components of face-to-face interactions.
Nonverbal communication involves conveying messages to
an audience through body movements, head nods, hand-arm
Ayano Sueyoshi and Debra M. Hardison, Department of Linguistics and
Germanic, Slavic, Asian and African Languages.
Ayano Sueyoshi is now affiliated with Okinawa International University,
Japan.
This article is based on the master’s thesis of the first author prepared
under the supervision of the second. We thank Jill McKay for her
participation in the study and Alissa Cohen and Charlene Polio for their
comments on the thesis.
Correspondence concerning this article should be addressed to Debra
M. Hardison, A-714 Wells Hall, Michigan State University, East Lansing,
MI 48824. Internet:
Language Learning 55:4, December 2005, pp. 661–699
661
gestures,
1
facial expressions, eye gaze, posture, and interperso-
nal distance (Kellerman, 1992). These visual cues as well as the
lip movements that accompany speech sounds are helpful for
communication: ‘‘eliminating the visual modality creates an
unnatural condition which strains the auditory receptors to
capacity’’ (von Raffler-Engel, 1980, p. 235). Goldin-Meadow
(1999) suggested that ‘‘gesture serves as both a tool for commu-
nication for listeners, and a tool for thinking for speakers’’ (p. 419).
For speakers, gestures facilitate retrieval of words from memory
and reduce cognitive burden. For listeners, they can facilitate
comprehension of a spoken message (e.g., Cassell, McNeill, &
McCullough, 1999) and convey thoughts not present in speech.
The power of facial speech cues such as lip movements is well
documented through studies involving the McGurk effect (the
influence of visual or lip-read information on speech perception;
e.g., McGurk & MacDonald, 1976; for a review, see Massaro,
1998). This article presents the findings of a study designed to
(a) assess the contribution of gestures and facial cues (e.g., lip
movements) to listening comprehension by low-intermediate and
advanced learners of English as a second language (ESL) and
(b) survey their attitudes toward visual cues in language skill
development and face-to-face communication. The first lan-
guages (L1s) of the majority of participants were Korean and
Japanese.
Although nonverbal communication gives clues to what
speakers are thinking about or enhances what they are saying,
cultural differences may interfere with understanding a
message (e.g., Pennycook, 1985) . Facial expressions in Korean
culture are different from those in Western cultures in terms of
subtlety. Perceptiveness in interpreting others’ facial expres-
sions and emotions (nun-chi) is an important element of non-
verbal communication (Yum, 1987). In Japan, gestures and
facial expressions sometimes serve social functions such as
showing politeness, respect, and formality. Bowing or looking
slightly downward shows respect for the interlocutor (Kagawa,
2001). Engaging eye contact is often considered rude in Asian
662 Language Lea rning Vol. 55, No. 4
culture. Matsumoto and Kudoh (1993) found that American par-
ticipants rated smiling faces more intelligent than neutral faces,
whereas Japanese participants did not perceive smiling to be
related to intelligence.
Hand gestures represent an interactive element during
communication. The majority (90%) are produced along with
utterances and are linked semantically, prosodically (McNeill,
1992), and pragmatically (Kelly, Barr, Church, & Lynch, 1999).
Iconic gestures, associated with meaning, are used more often
when a speaker is describing specific things. Beat gestures,
associated with the rhythm of speech, are nonimagistic and
frequently used when a speaker controls the pace of speech
(Morrel-Samuels & Krauss, 1992). Like iconics, metaphoric ges-
tures are also visual images, but the latter relate to more
abstract ideas or concepts. Representational gestures (i.e., icon-
ics and metaphorics) tend to be used more when an interlocutor
can be seen; however, beat gestures occur at comparable rates
with or without an audience (Alibali, Heath, & Myers, 2001).
Deictics are pointing gestures that may refer to specific objects
or may be more abstract in reference to a nonspecific time or
location.
Various studies with native speakers have shown that the
presence of gestures with a verbal message brings a positive
outcome to both speakers and listeners. Morrel-Samuels and
Krauss (1992) found that a gesture functions as a facilitator to
what a speaker intends to say. In narration, gestures are syn-
chronized with speech and are conveyed right before or simulta-
neously with a lexical item. They facilitate negotiation of
meaning and help speakers to recall lexical items faster
(Hadar, Wenkert-Olenik, Krauss, & Soroket, 1998). Gestures
are particularly effective for listeners when the intelligibility of
the speech is reduced, as in noisy conditions. Riseborough (1981)
examined the interaction of available visual cues in a story-
retelling task with native speakers of English. A story was told
to participants in four conditions, all with audio but varying in
visual cues: no visual cues, a speaker with no movement, a
Sueyoshi and Hardison 663
speaker with vague body movement, and a speaker with ges-
tures. These conditions were presented in the clear and in two
different levels of noise. Results indicated that more information
from the story was recalled by the group that saw the speaker’s
gestures. There was no significant difference in mean scores
across the other three groups. The noise factor had a significant
effect. With the higher levels of noise, the amount of the story
participants could recall decreased, but only for those who had
not seen the speaker’s gestures.
Gestures also function as an indicator of language develop-
ment. From a production standpoint, Mayberry and Nicoladis
(2000) found iconic and beat gestures had a strong correlation
with children’s language development. At the prespeaking stage,
children mainly use deictics (i.e., pointing gestures) such as
waving and clapping. However, as their speaking ability devel-
ops, they start to use iconics and beats. From a comprehension
perspective, in a comparison of ESL children (L1 Spanish) and
native-English-speaking children, the ESL children compre-
hended much less gestural information than the native speak-
ers, which Mohan and Helmer (1988) attributed to their lower
language proficiency. Understanding or interpreting nonverbal
messages accurately is especially important for second language
(L2) learners whose comprehension skill is more limited.
The influence of lip movements on the perception of individ-
ual sounds by native speakers of English has a long history.
McGurk and MacDonald (1976) described a perceptual illusory
effect that occurred when observers were presented with video-
taped productions of consonant-vowel syllables in which the
visual and acoustic cues for the consonant did not match. The
percept the observers reported often did not match either cue.
For example, a visual /ga/ dubbed onto an acoustic /ba/ produced
frequent percepts of ‘‘da.’’ Hardison (1999) demonstrated the
occurrence of the McGurk effect with ESL learners, including
those whose L1s were Japanese and Korean. In that study,
stimuli also included visual and acoustic cues that matched.
The presence of a visual /r/ and /f/ significantly increased
664 Language Lea rning Vol. 55, No. 4
identification accuracy of the corresponding acoustic cues.
Japanese and Korean ESL learners also benefited from auditory-
visual input versus auditory-only in perceptual training of
sounds such as /r/ and /l/, especially in the more phonologically
challenging areas based on their L1: /r/ and /l/ in final position
for Korean participants and in initial position for Japanese
(Hardison, 2003, 2005c). Although participants had been in
the United States only 7 weeks at the time the study began,
auditory-visual perception (i.e., the talker’s face was visible) was
more accurate than auditory-only in the pretest, and this benefit
of visual cues increased with training. Lip movements are the
primary, though perhaps not the sole, source of facial cues to
speech. There is some evidence suggesting that changes in a
speaker’s facial muscles in conjunction with changes in the
vocal tract may contribute linguistic information (Vatikiotis-
Bateson, Eigsti, Yano, & Munhall, 1998). A survey by Hattori
(1987) revealed that Japanese students who lived in the United
States for more than 2 years reported that they looked more at the
facesoftheirinterlocutorsasaresult of this experience, allowing
them to use v isual i nformation to facilitate comprehension.
It does not appear necessary for an observer to focus on only
one area of an image for speech information. Following a speech-
reading experiment using eye-tracking equipment with native
speakers of English, Lansing and McConkie (1999) suggested
that in terms of facial cues, observers may use the strategy of
looking at the middle of a speaker’s face to establish a global
facial image and subsequently shift their gaze to focus attention
on other informative areas. This is consistent with Massaro’s
(1998) argument that speech information can be acquired with-
out direct fixation of one’s gaze.
Gestures and facial cues may facilitate face-to-face interac-
tions involving L2 learners. Interactions offer them opportu-
nities to receive comprehensible input and feedback (e.g., Gass,
1997; Long, 1996; Pica, 1994) and to make modifications in their
output (Swain, 1995). Introducing gestures in language learning
also improves the social pragmatic competence of L2 learners
Sueyoshi and Hardison 665
(Saitz, 1966). In a recent study, Lazaraton (2004) analyzed the
use of gestures by an ESL teacher in teaching intermediate-level
grammar in an intensive English program. Based on the variety
and quantity of gestures, and the teacher’s subsequent reflec-
tions, Lazaraton concluded that the data pointed to the ‘‘poten-
tial significance of gestural input to L2 learners’’ (p. 106). The
process of listening becomes more active when accompanied by
visual motions, and the nonverbal aspect of speech is an integral
part of the whole communication process (Perry, 2001).
Other studies focusing on gesture use by L2 learners have
found that those learning English as an L2 in a naturalistic
setting have the benefit of greater exposure to nonverbal com-
munication features such as gestures and tend to acquire more
native-like nonverbal behaviors in contrast to learners of
English as a foreign language (EFL; McCafferty & Ahmed,
2000). Learners also use more gestures when producing L2
English than their L1s (e.g., Gullberg, 1998). For example, L1
Hebrew speakers used significantly more ideational gestures in
a picture description task using their L2 (mean of 205.9 gestures
per 1,000 words) than their L1 (mean of 167.5; Hadar, Dar, &
Teitelman, 2001). Gesture rates for the picture descriptions were
higher than for translation tasks. Hadar et al. (2001) suggested
that because picture description involved a greater processing
demand at the semantic level than translation, the results were
an indication that the semantic level (vs. the phonological level)
of oral production drives gesture production. An unexpected
finding was that gesture rates were higher for English-to-
Hebrew translation (85.9 gestures per 1,000 words) than for
Hebrew-to-English (17.1). This suggests that translation into
Hebrew (the L1) was semantically more demanding, perhaps as
a result of a larger L1 lexicon.
Despite the apparent importance of nonverbal communica-
tion in L2 production (e.g., McCafferty, 2002), little research has
been conducted on the effects of visual cues on ESL learners’
listening comprehension. English (1982) examined the effect of
different types of instruction using a videotaped lecture. One
666 Language Lea rning Vol. 55, No. 4
group in English’s study received instruction focusing on the
nonverbal cues of the lecturer, and another group received
instruction focusing on verbal discourse. A control group received
no specific instruction. English reported no effect of instruction;
however, because a note-taking task was used, it is likely that
the participants were unable to attend adequately to the stimu-
lus because they were focused on taking notes.
Research by Cabrera and Martinez ( 2001) demonstrated a
positive effect of visible gestures on students’ comprehension
during storytelling in an EFL class at a primary school in
Mexico. The study was designed to compare the comprehension
of two groups. One had a storytelling class using linguistic mod-
ifications such as simplified input, and the other had interaction
modifications including teacher’s repetitions, comprehension
checks, and gestures. The latter group showed better compre-
hension of the story; however, it is not possible to differentiate
the contributions of each type of modification.
In the present study, the main objective was to examine the
effects of gestures and facial cues (e.g., lip movements) on adult
ESL students’ listening comprehension by controlling input con-
tent and background knowledge. A multiple-choice comprehen-
sion task was used to minimize the confounding of listening with
other skills such as speaking or writing and for effectiveness
within time constraints (Dunkel, Henning, & Chaudron, 1993).
Three stimulus conditions were created from a video-recorded
lecture. There was an audio-only (A-only) condition, and there
were two audiovisual (AV) conditions: AV-gesture-face, which
showed both the lecturer’s gestures and facial cues, and AV-
face, which showed the lecturer’s head and upper shoulders (no
gestures). There was no condition in which only the gestures
were visible because of the unnatural appearance of the stimu-
lus, which could affect the results (e.g., Massaro, Cohen,
Beskow, & Cole, 2000; Summerfield, 1979). Each of these three
conditions was further divided into two proficiency levels.
We use the term lecture to denote a relatively informal
conversational style of speech with no overt interaction between
Sueyoshi and Hardison 667
lecturer and audience. In this sense, we follow Flowerdew and
Tauroza (1995), who characterized this type of material as ‘‘con-
versational lecture’’ (p. 442) in contrast to the reading of scripted
materials. Although the lecturer in the present study was given
information to ensure that specific content was included, this
information was in the form of words and phrases in an outline
rather than full sentences to be read. She did not need to make
frequent reference to the outline because of her knowledge of the
topic. The transcript of the clip (see Appendix A) shows the
sentence fragments, hesitations, and false starts that character-
ize conversational speech. This style of speech is also typical of
academic settings today and has been used in other studies (e.g.,
Hardison, 2005a; Wennerstrom, 1998). It offers greater general-
ization of results to daily conversational interactions than would
otherwise obtain from the use of read speech.
2
This study was motivated by the following research ques-
tions and hypotheses. (The first question was addressed through
the comprehension task, and the remaining two through a
questionnaire.)
1. Does access to visual cues such as gestures and lip move-
ments facilitate ESL students’ listening comprehension?
We hypothesized that the AV-gesture-face group in the present
study would show better listening comprehension scores for
the higher and lower proficiency levels because of the
presence of both facial and gestural cues, followed by the
AV-face groups, and then the A-only. This was based on previous
research demonstrating the contribution of facial cues to percep-
tual accuracy and word identification (Hardison, 1999, 2003,
2005b, 2005c) and studies suggesting that gestures accompanying
speech contain meaningful information that facilitates compre-
hension of content (Cabrera & Martinez, 2001; Goldin-Meadow,
1999; Morrel-Samuels & Krauss, 1992; Riseborough, 1981).
2. Does proficiency level affect the learners’ preference for visual
cues in communication and their choice of activities for
668 Language Lea rning Vol. 55, No. 4
the development of listening and speaking skills and
vocabulary?
3. Does proficiency level affect the perception of gestures in
general and participants’ own gesture use with L1 and L2
speech?
We hypothesized that learners in both proficiency levels would
have positive attitudes toward the presence of additional visual
cues to aid communication and skill development, but the higher
proficiency learners might consider facial cues more informative
and report paying more attention to them as a result of their
linguistic experience.
Method
Participants
A total of 42 ESL learners (29 female, 13 male) ranging in
age from 18 to 27 years participated in this study. The majority
had Korean (n ¼ 35) as their L1; the others’ L1s were Japanese
(n ¼ 3), Chinese (n ¼ 1), Thai (n ¼ 1), and Italian (n ¼ 1), and 1
participant did not specify. None of the participants knew the
lecturer in this study. The learners were enrolled in either the
Intensive English Program (IEP) or English for Academic
Purposes Program (EAP) at a large Midwestern university in
the United States. The learners from the lowest and second-
lowest levels in the IEP formed the lower proficiency level
(n ¼ 21), and those who were in the highest level in the IEP
(n ¼ 17) or in EAP courses (n ¼ 4) were considered the higher
proficiency level (n ¼ 21). Level placement in the IEP was deter-
mined on the basis of an in-house placement test of listening,
reading, and writing skills (reliability coefficients for the listen-
ing and reading sections of this placement test over the past
several years have ranged from .83 to .95). Participants were
recruited through an announcement of the study made to the
Sueyoshi and Hardison 669
relevant classes from these levels. Those who chose to partici-
pate volunteered to do so outside of their usual classes.
Participants in both levels of proficiency were randomly
assigned to one of the three stimulus conditions: AV-gesture-
face, AV-face, and A-only. Each of the six groups had 7 partici-
pants (N ¼ 42). The majority reported a length of residence
(LOR) in the United States or other English-speaking country
of 6 months or less. A breakdown of LORs per group is given in
Table 1. Following the tabulation of data, the results were
offered to the participants upon request using the reference
numbers they were assigned at the time of the study.
Materials
Materials selection. A female graduate teaching assistant
whose L1 is American English was video-recorded giving a lec-
ture, ‘‘Ceramics for Beginners’’ (see Appendix A). This topic was
chosen in order to avoid any influence of prior knowledge
(confirmed by questionnaire results) and to ensure a sufficient
amount of gesture use. One of the ESL teachers in the program
Table 1
LOR reported by participants according to proficiency level and
stimulus group
Number of months of residence
Proficiency level Stimulus group 1–6 7–12 13–24 24–36
Higher AV-gesture-face 6 1
AV-face 5 1 1
A-only 6 1
Lower AV-gesture-face 4 1 1 1
AV-face 5 1 1
A-only 6 1
Note. The total number of participants per group was 7.
670 Language Lea rning Vol. 55, No. 4
who is also a test developer and ceramicist assisted in the prep-
aration of the lecture content and related questions. Other
native speakers examined the questions following Brown’s
(1996) guidelines on test item formats. They also evaluated the
auditory intelligibility of the stimulus.
The lecturer followed an outline containing key information,
which had been selected for the purposes of constructing listening
comprehension questions based on the lecture. This lecturer was
selected because of her knowledge of ceramics, use of gestures,
and experience in teaching. Prior to the video recording for this
study, she was observed during one of her usual lectures for an
undergraduate general education course in American history and
culture in order to analyze the quantity and variety of her gesture
use. She was allowed to review the lecture outline in advance, and
to expand on or omit some of the material to ensure a more
natural delivery with minimal reference to the outline during
recording. The first part of the lecture covered definitions of
terms and a brief history of ceramics, which tended to be done
in narrative form. Most of the content dealt with how to make
basic pottery and involved description and gesture use.
Materials recording and editing. Two video-recording ses-
sions using the same lecture outline were scheduled, each last-
ing approximately 20 min. After both were reviewed, one was
selected for use in the study on the basis of frequency of gesture
use and sound quality. Two Sony digital video camera recorders
(Model DCR-TRV27) were used for simultaneous recording; one
showed the lecturer’s upper body in order to capture gesture use,
and the other was focused on her face (shoulders and above).
These recordings provided two stimulus conditions: AV-gesture-
face and AV-face. The lecturer was not told what kind of ges-
tures to use or how to use them, so in the AV-face condition, her
hands were occasionally visible. This was inevitable because of
our preference for naturalistic gesture quality. The recordings
were made in a small room. Because speakers have been found
to produce more representational gestures when an audience
was present (Alibali et al., 2001), two observers were invited
Sueyoshi and Hardison 671
into the room during recording. The lecturer was instructed to
speak as if she were speaking to a whole class.
The video was edited with iMovie, a movie-editing program
for Macintosh computers. Because of the different focus for each
camera, the image of the face in the AV-face condition was some-
what larger than in the AV-gesture-face condition. Recordings
were edited into five small clips for the purpose of reducing depen-
dence on memory for the listening comprehension task. In addi-
tion, to keep the content coherent within each clip, the length of
each varied from 2 to 4 min. The subtopics of the five clips were (a)
the history of ceramics, (b) tools and techniques, (c) hand-building
procedures, (d) kneading the clay, and (e) shaping it on the wheel.
After editing, all clips were compressed (using IMA4:1, an output
format) from the original video and exported to QuickTime,an
audio/video playback program. After several editing and testing
sessions, the final sound property was set at 22,050 Hz, the video
format was 320 Â 240 pixels by Sorenson video 3 (the Quick Time
standard for high-quality video), and the video track format size
was 320 Â 240 pixels. The stimulus for the A-only group consisted
of the recording’s audio track only.
Listening task. A multiple-choice comprehension task was
used to test participants’ comprehension of the lecture (see
Appendix A). A ll questions had to be designed so that it was p ossible
to answer them with out visual cue s (for the A-only groups).All
participants were given the same questions. Four multiple-choice
questions, each with four options, were prepared for each c lip.
Prior to the study, the listening task was used for a sepa-
rate project with advanced nonnative speakers (EAP) and lower
proficiency IEP students who had no knowledge of ceramics.
These participants were from the same language program as
those in the current study. Analysis of the data from these two
groups indicated main effects of proficiency level (i.e., the EAP
students had higher scores) and stimulus condition (i.e., higher
scores obtained with visual cues).
Questionnaire. The first six items of the questionnaire (see
Appendix B) asked about participants’ background, including thei r
672 Language Lea rning Vol. 55, No. 4
L1, LOR in an English-speaking country, experience wi th ceramics ,
and use of English. Item 6 was included to assess the learners’
exposure to visual cues in English communication. Three items
(7–9) asked the participants to rank (from 1 to 3) the activities
they thought improved their listening, speaking, and vocabulary-
building skills in English to determine any preference for acti vities
that provide visual cues. Vocabulary development was included
because it is an integral part of developing language proficiency.
Items 10–18 used 5-point Likert scales, where 5 represented
strongly agree and 1 was strongly disagree.Theseitemswere
related to participants’ attention to and use of visual cu es (facial
and gestural) in daily life and were motivated by observations
expressed b y nonnative speakers in our program and participants
in other studies (e.g., Hardison, 1999), regarding the d iffere nces
they no te between their L1 cultures an d t he United States in terms
of articulatory settings for speech and gesture use.
3
Then, the
AV-gesture-face and AV-face condition participants were asked
different questions about their perceptions of the visual cues in
the lecture. The A-only groups were asked if they tho ught their
comprehension could have been facilitated by seeing the lecturer.
The final question was open-ended and offered all participants the
opportunitytomakecommentsaboutthelisteningtask.
Procedure
Listening comprehension task. The experiment was con-
ducted in a regular classroom equipped with a built-in computer
and a speaker that was suspended from the ceiling in the middle
of the room. Several sessions were conducted for each stimulus
condition to accommodate participants’ schedules. The testing
was conducted in small groups of 5–8 participants. The stimuli
for the AV-gesture-face and AV-face groups were presented via
computer (using QuickTime) and projected onto a screen at the
front of the classroom. The audio was played through the
speaker. For viewing, ‘‘double size’’ was used instead of ‘‘full
size’’ to prevent the image from blurring. This permitted
Sueyoshi and Hardison 673
life-sized images. For the A-only group, only the audio track was
presented.
A response booklet was distributed to each participant. This
included written i nstructions on the fron t page indicating t hat
participants were to answer four multiple-choice questions during
the 2-min pause after each 2- to 4-min clip. They were not allowed to
read the questions in advance. After listening/viewing the clip, they
were told to turn the page to answer the questions for that clip. In
contrast to those in the study by English (1982),participantsinthe
currentstudywerenotallowedtotakenotesduringtheexperiment,
to maximize attention t o the visual input f or the A V-gesture-face and
AV-face groups. For comparability a cross groups, the A-only group
was also not allowed to take notes. One of the researchers observed
each session to monitor participants’ attention to visual cues.
Questionnaire. Following the listening comprehension
task, participants were asked to complete the questionnaire,
which was included in the response booklet. They were allowed
to inquire when they did not understand the meaning of the
questions in this section. Each session took 30 min including
instructions at the beginning, the listening comprehension
task, and completion of the questionnaire. The questionnaire
was completed after the listening task so as not to bias any of
the responses.
Results and Discussion
To give the reader a better idea of the types of gestures the
participants saw in the lecture, discussion of the results begins
with a description of these gestures, their relative frequency,
and examples, followed by the results of the listening compre-
hension task and the questionnaire.
Gesture Types
Four major types of gestures (iconics, deictics, metaphorics,
and beats) as defined by McNeill (1992) were tabulated to
674 Language Lea rning Vol. 55, No. 4
determine the relative use of each type by the lecturer. Some
gestures involved one hand; others involved both. As the lecturer
did not have any papers, etc., in her hands, she was free to use
both hands to gesture.
4
Beats were the most frequently used
(38%), followed closely by iconics (31%), then metaphorics
(23%) and deictics (8%). The following examples are taken from
the lecture. The words and phrases shown in italics were accom-
panied by gesture. In Example (1), the lecturer was describing a
loop tool, and in (2), she was demonstrating a procedure. Both
examples were accompanied by the iconic gestures described in
square brackets.
(1) ‘‘They’re shaped with triangles or circles [pointed fin-
gers shaped in a triangle and a circle] on the top that are
hollowed out [a sign similar to ‘OK’] by wires . . .’’
(2) ‘‘So, you allow yourself to kind of gently remove the
machine from the clay and slide the clay over to [two
hands forming a circle as if holding an object and moving
it to the left] a . . . erm . . . piece of wax paper . . .’’
The following is an example of a metaphoric gesture from the
lecture.
(3) ‘‘. . . it does sound a little odd considering it has nothing
[moving the hand from side to side] to do with clay or
pottery in the name.’’
In this lecture, deictics accompanied comparisons and con-
trasts, especially when the lecturer talked about the history and
characteristics of ceramics in different regions, as shown in (4)–(6).
For example, the commonly used gestures in (4) and (5) accompa-
nied expressions of contrast and involved a movement of the hand
from a palm-down to a palm-up position. In (4), the palm-down
position corresponded to pot and the palm-up corresponded to clay.
(4) ‘‘Pot or clay’’
(5) ‘‘It was something that was really used for a function
rather than form.’’
Sueyoshi and Hardison 675
(6) ‘‘urn color were [sic] varied, different from Mesopotamia
era.’’
Beats were noted throughout the lecture but occurred most
often when the lecturer emphasized important information with
constant movements of her hands or emphasized a key term with
one hand movement associated with a higher pitch and greater
stress, as in (7), in which stores and formed were stressed.
(7) ‘‘. . . clay does not come in the shape you see it in . . . in
all the stores as it’s already formed.’’
Listening Comprehension Task
The listening task was designed to address the first research
question: Does access to visual cues such as gestures and lip
movements facilitate ESL students’ listening comprehension?
Independent variables were stimulus condition (AV-gesture-face,
AV-face, A-only) and level of proficiency (higher, lower). The num-
ber of correct answers (total score ¼ 20) for the listening compre-
hension task was tabulated separately for each proficiency level
(higher, lower) within each stimulus condition (AV-gesture-face,
AV-face, A-only). The Kuder-Richardson formula 20 (K-R20) esti-
mate of reliability
5
was .73, which falls within the desirable range
of .70 to 1.00 (Nunnally, 1978) and is acceptable given the rela-
tively small number of questions and the subject population.
Longer tests and participants with wider and continuous ranges
of ability increase test reliability coefficients (Sax, 1974).
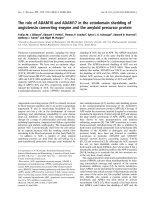
As shown in Figure 1, the mean score of the lower profi-
ciency learners showed a gradual decline in performance across
groups, from AV-gesture-face (M ¼ 10.14, SD ¼ 1.95), to AV-
face (M ¼ 8.71, SD ¼ 0.64), to A-only (M ¼ 7.57, SD ¼ 0.48).
However, scores for the higher proficiency learners did not follow
this trend; for them, the AV-face group received the highest
mean score (M ¼ 13.29, SD ¼ 0.84) followed by AV-gesture-
face (M ¼ 11.14, SD ¼ 2.54) and A-only (M ¼ 8.57, SD ¼ 0.61).
The greatest difference in the means between the proficiency
676 Language Lea rning Vol. 55, No. 4
levels (4.58) was in the AV-face condition. The groups that
received input with visual cues performed better than those
that received auditory-only input regardless of proficiency
level. Although the mean scores may appear low, it is important
to note that this was an introduction to a topic unknown to the
participants, the speech style was conversational, note taking
was not permitted, and there was no opportunity for participants
to activate any relevant schema through prelistening activities
or to request clarification or repetition.
A two-factor analysis of variance (ANOVA) [Proficiency Level
(higher, lower) Â Stimulus Condition (AV-gesture-face, AV-face,
A-only)] revealed a main effect of stimulus condition, F(1,
36) ¼ 13.54, p < .001.
6
Tukey’s honestly significant difference
test indicated that the scores for the A-only condition were signifi-
cantly different from those of the AV-gesture-face and AV-face
conditions. There was no significant difference between the latter
two conditions, both of which involved visual cues. These findings
10.14
8.71
7.57
11.14
13.29
8.57
0
2
4
6
8
10
12
14
16
18
20
AV-gesture-face AV-face A-only
Stimulus Condition
Mean Accuracy
Lower Proficiency
Higher Proficiency
Note: Maximum total score
= 20.
Figure 1. Mean listening comprehension scores: Proficiency Level  Stimulus
Condition.
Sueyoshi and Hardison 677
confirmed the hypothesis that the more visual information avail-
able to the participants, the better the comprehension. Because
note taking was not permitted, gestures, as visual images, likely
facilitated memory encoding and subsequent recall of information
when participants answered the comprehension questions.
There was a main effect of level of proficiency, F(2,
36) ¼ 9.60, p < .001. Across stimulus conditions, scores were
better for the higher proficiency level. In addition, there was a
significant Stimulus Condition  Proficiency Level interaction,
F(2, 36) ¼ 4.00, p < .05. The total amount of variance accounted
for by these factors was .42 (omega-squared). The difference
between the two proficiency levels was greatest in the AV-face
condition. The higher proficiency learners benefited most from the
AV-face stimulus, followed by AV-gesture-face and then A-only.
This order was not as predicted; however, it is compatible with
other studies, which indicated the positive effect of lip move-
ments on the identification accuracy of learners with a high-
intermediate level of proficiency (Hardison, 1999, 2003, 2005b,
2005c). Lip movements are associated with the phonological
component of speech, which may account for their reduced infor-
mation value in the present study for the lower proficiency
learners, who had less experience with the association between
L2 speech sounds and articulatory movements.
In contrast, the AV-gesture-face condition produced the
best scores for the lower proficiency learners. The difference
between the two visual-stimulus conditions is the presence of
gestures associated with the semantic, and in the case of beats,
prosodic components of the lecturer’s speech. Participants in this
stimulus condition may have focused their attention on the ges-
tures or may have shifted their attention back and forth from the
lecturer’s gestures to her face (Lansing & McConkie, 1999).
Questionnaire
The questionnaire addressed research questions 2 and 3
involving a comparison of responses from the two proficiency
678 Language Lea rning Vol. 55, No. 4
levels with regard to preferred activities for language skill devel-
opment, perceptions of the value of gestures, and gesture use.
Activities contributing to skill development (items 6–9).
Responses to questionnaire items 6–9 (see Appendix B) were
tabulated according to the rankings (from 1 to 3) participants
assigned to activities in which they used English (item 6) and to
activities that contributed to the development of their listening
skills (item 7 ), speaking proficiency (item 8), and vocabulary
development (item 9).
In Table 2, the far left column includes th e questionnaire
item n umber (6–9) followed by a list of activities. The column
under the heading ‘‘1’’ shows the number of participants who
ranked the activity first; the column under the heading ‘‘2’’
shows the number who ranked it second; and so on. The resu lts
for the higher and lower proficiency levels were compared by
chi-square analysis where cell sizes were adequate. None
reached significance. Chi-s quare values ranged from .23 to
4.80; with two degrees of freedom, a value of 5.991 is needed
to reach significance at the .05 level. These findings indicated a
strong similarity in the rankings given by both proficiency
levels.
Results for questionnaire item 6 indicated that the most
common activity using English was ‘‘homework’’ followed by
‘‘English use in class’’ and ‘‘watching TV.’’ These responses likely
stem from the participants’ status as learners enrolled in struc-
tured English programs designed for academic preparation. Item
7 referred to their choice of activities to improve listening skills.
In general, both proficiency levels preferred ‘‘watching TV’’ and
‘‘talking to Americans’’ to develop their listening skills. One factor
contributing to this preference may be the presence of visual cues.
Item 8 addressed preferences for activities contributing to the
improvement of their speaking skills. Both proficiency levels
perceived ‘‘Talking to Americans’’ as the most effective activity
followed by ‘‘watching TV.’’ While the above results suggest a
positive attitude toward visual cues, it is not possible to conclude
that it is the auditory-visual nature of these activities that
Sueyoshi and Hardison 679
Table 2
Frequency of rankings of general activities using English that con-
tribute to language skill development: Questionnaire items 6–9
Item
Q6: Use of English Higher Proficiency Lower Proficiency
Ranking 1 2 3 Total 1 2 3 Total
Homework 4 9 4 17 0 12 6 18
English use in class 9 5 1 15 12 3 1 16
TV 1 5 7 13 3 3 8 14
Talking to friends 4 2 1 7 4 2 0 6
Reading 1 1 4 6 0 0 1 1
E-mail 2 0 3 5 1 0 1 2
Radio 0 0 0 0 1 0 2 3
Q7: Improve listening Higher Lower
Ranking 1 2 3 Total 1 2 3 Total
TV 68519 58619
Talking to Americans 87116 144119
Attending class 3 0 6 9 0 2 4 6
Radio/CD 3 0 5 8 2 3 2 7
Talking to friends in English 1 3 2 6 0 0 4 4
Q8: Improve speaking Higher Lower
Ranking 1 2 3 Total 1 2 3 Total
Talking to Americans 18 1 0 19 15 3 2 20
TV 33814 15410
Talking to friends in English 0 8 0 8 29314
Attending class 0 2 4 6 0 1 5 6
Radio/CD 0 0 2 2 1 1 1 3
Q9: Build vocabulary Higher Lower
Ranking 1 2 3 Total 1 2 3 Total
Reading 13 4 1 18 8 9 0 17
Homework 5 3 3 11 6 5 3 14
Attending class 1 5 4 10 1 3 5 9
TV 0 0 6 6 0 0 6 6
Talking to friends in English 1 4 0 5 3 0 3 6
Talking to Americans 1 1 2 4 1 0 1 2
Radio/CD 0 0 2 2 0 1 0 1
E-mail 0 0 0 0 1 0 1 2
Note. The statistic for each activity represents the frequency with which it was
ranked first, second or third by respondents. The total possible response was 21 for
each group. There were no statistically significant differences between proficiency
levels according to chi-square analysis.
680 Language Lea rning Vol. 55, No. 4
contributes the most to their preference. ‘‘Talking to Americans’’
was the most popular activity reported by the learners for devel-
oping listening and speaking skills, especially speaking. This
response is supported by the extensive literature on interaction
either between native and nonnative speakers or between non-
natives. Listening to the radio or CDs was the least-preferred
activity by both proficiency levels, perhaps because of a combina-
tion of factors such as the lack of visual cues, rapid speech rate,
and reduced intelligibility of lyrics. Item 9 dealt with the prefer-
ence for activities that contribute to vocabulary building. Not
surprisingly, ‘‘reading’’ was the most-preferred activity, compati-
ble with findings that reading contributes to overall language
proficiency development (Gradman & Hanania, 1991).
Preference for visual cues (items 10–23). Items 10–12
referred to preference for attending to visual cues (e.g., speaker’s
face, gestures, TV vs. radio) in general listening comprehension.
Items 13–14 concerned participants’ perceived differences in
their gesture use when speaking in English versus their L1
and in gesture use by Americans versus people in their native
countries. Items 15–16 referred to the learners’ perceptions of
the contribution of gestures to the comprehension by others of
their speech in English and in their L1s. Items 17–18 addressed
the attention they paid to a speaker’s lip movements and ges-
tures in face-to-face communication. Response data were tabu-
lated, and t-tests were conducted to compare the ratings given by
the higher and lower proficiency levels.
Table 3 summarizes the participants’ responses to items
10–18. The first column indicates the focus of the items, and
the second shows the relevant questionnaire item numbers.
‘‘Overall mean’’ refers to the mean score for all participants
and is followed by the standard deviation (SD). Separate mean
scores are given for each proficiency level, and the t-value is
given for the comparison of results by proficiency level.
Although differences between proficiency levels for items 10–18
did not reach statistical significance, there were several note-
worthy patterns.
Sueyoshi and Hardison 681
Table 3
Summary of responses to questionnaire items 10–18 and t-test statistics comparing higher and lower
proficiency groups
Focus
Item
numbers
Overall
mean SD
Mean for
higher
proficiency
group
Mean for
lower
proficiency
group t-value
Preference for seeing a
speaker’s face to
understand English
10 4.05 0.91 4.24 3.86 1.37
Preference for seeing a
speaker’s gestures to
understand English
11 4.21 0.78 4.24 4.19 0.19
Preference for TV
versus radio
12 4.24 0.88 4.43 4.05 1.42
More gestures used by
learner in English than L1
13 3.67 1.05 3.90 3.43 1.48
More gestures used by
Americans than L1
speakers
14 4.00 0.85 3.86 4.14 1.08
Perceived contribution
of gestures to
comprehension
of learner’s L2 speech
15 3.60 1.01 3.42 3.76 1.01
Perceived contribution of
gestures to comprehension
of learner’s L1 speech
16 3.29 0.67 3.43 3.14 0.95
Attention paid to a
speaker’s lip movements
17 3.29 1.11 3.43 3.14 0.83
Attention paid to a
speaker’s gestures
18 3.93 0.71 4.00 3.86 0.65
*p < .05.
As shown in Table 3, the highest overall mean ratings were
given to items 10–12 and indicated a strong preference for visual
cues in general L2 listening comprehension. The higher profi-
ciency learners provided identical mean ratings for the value of
seeing a speaker’s face (item 10) and gestures (item 11). The
lower proficiency level tended to prefer gestures to facial cues.
The responses to items 13 and 14 revealed that participants
tended to use gestures more when speaking English than when
speaking their L1. They were conscious of differences in gesture
use between their L1 and L2 cultures and reported that
Americans use gestures more frequently than people in their
native countries. For items 15–16, both proficiency levels per-
ceived that interlocutors would understand them better if they
used gestures when communicating in English and their L1s.
Responses to item 17 also indicated a tendency to pay
attention to a speaker’s lip movements in face-to-face commu-
nication (overall M ¼ 3.29). For items 15, 16, and 17, partici-
pants marked a wide range of responses from 5 (strongly agree)
to 1 (strongly disagree) on the Likert scale. Especially for item
17, the responses showed two opposing viewpoints: 21 of the 42
participants responded that they paid attention to a speaker’s lip
movements, and 21 responded they did not. However, for item
18, only 2 out of 42 respondents reported they did not pay any
attention to gestures.
There was a strong association between participants’ per-
ception of gesture efficacy and their attention to gestures: 31 out
of 36 participants (86%) who responded that gestures helped
their comprehension of a speaker to some degree (item 11) also
reported that they paid attention to the interlocutor’s gestures in
face-to-face communication (item 18). However, their perception
of gesture efficacy had less connection with their use of gestures;
24 out of 36 (67%) reported they used gestures in their English
speech (item 13).
Perception of visual cues and the listening comprehension
task (items 19–23). Questionnaire items 19–23 involved partici-
pants’ feedback on the stimulus used in the listening
684 Language Lea rning Vol. 55, No. 4
comprehension task; therefore each stimulus group was
assigned different questions. Table 4 provides a summary of
the analysis of the responses.
The responses to item 19 (A-only groups) revealed that the
higher proficiency level (M ¼ 3.86) showed a stronger belief
compared to the lower level (M ¼ 3.00) that comprehension of
the lecture would have been better with visual cues, but the
difference was not significant, t(12) ¼ 1.69, ns. Items 20 and 21
were given to the AV-face groups. The higher proficiency level
(item 20, M ¼ 4.57) had a significantly stronger belief compared
to the lower level that the presence of visual cues from the
lecturer’s face facilitated their comprehension, t(12) ¼ 2.49,
p < .05, Z
2
¼ .34. In addition, there was a significant difference
between the higher proficiency (item 21, M ¼ 4.57) and lower
proficiency (M ¼ 3.71) learners in their ratings of how much
they felt seeing the speaker’s gestures would have helped com-
prehension of the lecture, t(12) ¼ 3.13, p < .01, Z
2
¼ .45.
The AV-gesture-face grou ps were assigned items 22 and
23. Responses to item 22 indicated that both proficiency levels
thought the presence of gestures helped their comprehension of
the lecture: 14 out of 14 responded either Strongly agree or
Agree (M ¼ 4.50). In addition, for item 23, the participants
reported that the presence of facial cues w as also helpful
(M ¼ 4. 00), but not to the same degree. There was no significant
difference between the proficiency levels for either item. A
paired t-test revealed no significant difference in the ratings
given by the higher proficiency learners to items 22 (gestures
as an aid to comprehension) and 23 (facial cues as an aid to
comprehension), t(6) ¼ 1.73, ns. The same analysis for the rat-
ings by the lower level learners also revealed no significant
difference, t(6) ¼ 1.08, ns.
General Discussion
This study investigated the contribution of gestures and
facial cues (e.g., lip movements) to ESL learners’ listening
Sueyoshi and Hardison 685