Patterns of neural activity associated w
Bạn đang xem bản rút gọn của tài liệu. Xem và tải ngay bản đầy đủ của tài liệu tại đây (329.75 KB, 14 trang )
Patterns of neural activity associated with honest
and dishonest moral decisions
Joshua D. Greene1 and Joseph M. Paxton
Department of Psychology, Harvard University, 33 Kirkland Street, Cambridge, MA 02138
Edited by Marcus E. Raichle, Washington University School of Medicine, St. Louis, MO, and approved June 11, 2009 (received for review January 7, 2009)
What makes people behave honestly when confronted with opportunities for dishonest gain? Research on the interplay between
controlled and automatic processes in decision making suggests 2
hypotheses: According to the ‘‘Will’’ hypothesis, honesty results
from the active resistance of temptation, comparable to the controlled cognitive processes that enable the delay of reward. According to the ‘‘Grace’’ hypothesis, honesty results from the
absence of temptation, consistent with research emphasizing the
determination of behavior by the presence or absence of automatic
processes. To test these hypotheses, we examined neural activity
in individuals confronted with opportunities for dishonest gain.
Subjects undergoing functional magnetic resonance imaging
(fMRI) gained money by accurately predicting the outcomes of
computerized coin-flips. In some trials, subjects recorded their
predictions in advance. In other trials, subjects were rewarded
based on self-reported accuracy, allowing them to gain money
dishonestly by lying about the accuracy of their predictions. Many
subjects behaved dishonestly, as indicated by improbable levels of
‘‘accuracy.’’ Our findings support the Grace hypothesis. Individuals
who behaved honestly exhibited no additional control-related
activity (or other kind of activity) when choosing to behave
honestly, as compared with a control condition in which there was
no opportunity for dishonest gain. In contrast, individuals who
behaved dishonestly exhibited increased activity in control-related
regions of prefrontal cortex, both when choosing to behave
dishonestly and on occasions when they refrained from dishonesty. Levels of activity in these regions correlated with the frequency of dishonesty in individuals.
dishonesty ͉ fMRI ͉ honesty ͉ lie detection ͉ moral judgment
R
ecent research in moral psychology/neuroscience has focused on the respective roles of automatic and controlled
processes in moral judgment (1, 2), particularly in the context of
hypothetical dilemmas involving life-and-death tradeoffs (‘‘trolley problems’’) (3–11). Comparably little is known about the
cognitive processes that generate honest and dishonest behavior
(12, 13), and the neural bases of choices to behave honestly or
dishonestly have, to our knowledge, never been studied specifically. Though there is much recent research on brain-based lie
detection (14), subjects in these experiments are instructed to lie,
and therefore their behavior is not genuinely dishonest.* Moreover, studies examining instructed lies do not examine the choice
to lie.
The present study uses fMRI (functional magnetic resonance
imaging) and a behavioral design inspired by research on moral
hypocrisy (15) to examine the neural bases of honest and
dishonest choices. More specifically, this study tests 2 competing
hypotheses concerning the cognitive nature of honesty. According to the ‘‘Will’’ hypothesis, honesty results from the active
resistance of temptation, comparable to the controlled cognitive
processes that enable individuals to delay gratification (16, 17).
According to the ‘‘Grace’’ hypothesis, honesty results from the
absence of temptation, consistent with research emphasizing the
determination of behavior by the presence or absence of automatic processes (1, 18). These hypotheses make competing
predictions concerning the engagement of prefrontal structures
12506 –12511 ͉ PNAS ͉ July 28, 2009 ͉ vol. 106 ͉ no. 30
associated with cognitive control (19–23) in honest individuals
as they choose to refrain from dishonest behavior.
Subjects undergoing fMRI attempted to predict the outcomes
of random computerized coin-flips and were financially rewarded for accuracy and punished for inaccuracy. In the No
Opportunity condition, subjects recorded their predictions in
advance, denying them the opportunity to cheat by lying about
their accuracy. In the Opportunity condition, subjects made their
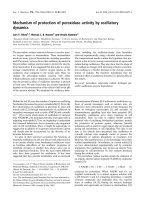
predictions privately and were rewarded based on their selfreported accuracy, affording them the opportunity to cheat. (Fig.
1) We used a cover story to justify our giving subjects obvious
opportunities for dishonest gain. This study was presented as a
study of paranormal abilities to ‘‘predict the future,’’ aimed at
testing the hypotheses that people are better able to predict the
future when their predictions are (i) private and (ii) financially
incentivized. Thus, subjects were implicitly led to believe, first,
that the opportunity for dishonest gain was a known but unintended by-product of the experiment’s design and, second, that
they were expected to behave honestly. We note that in employing this cover story, subjects were deceived about the experimenters’ interests, but not about the economic structure of the
task.
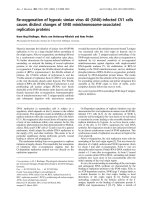
Thirty-five subjects were classified as honest, dishonest, or
ambiguous based on self-reported accuracy in the Opportunity
condition (Fig. 2). We emphasize that these labels describe these
subjects’ present behavior only and that we make no claims
concerning their more general behavioral tendencies. Fourteen
subjects reporting improbably high levels of accuracy at the
individual level (one-tailed binomial test, P Ͻ 0.001), 69% or
higher, were classified as dishonest (M ‘‘accuracy’’ ϭ 84%). This
conservative threshold was used to ensure an adequate number
of cheat trials per dishonest subject. The 14 lowest-accuracy
subjects (M accuracy ϭ 52%) were classified as honest. This was
the largest group of subjects exhibiting no significant evidence of
cheating at the group level (486/926 trials, P Ͼ 0.05). Measures
were taken to exclude dishonest subjects who disguised their
cheating by underreporting accuracy for relatively low-value
Opportunity trials. The remaining 7 subjects (M ϭ 62%) were
classified as ambiguous. (See Methods and supporting information (SI) Text for further discussion of subject classifications/
exclusions.)
As noted above, the Will and Grace hypotheses make competing predictions concerning the neural activity of honest
individuals when they choose to refrain from dishonest behavior.
More specifically, these hypotheses make competing predictions
concerning the following comparison within the honest group:
Author contributions: J.D.G. and J.M.P. designed research, performed research, analyzed
data, and wrote the paper.
The authors declare no conflict of interest.
This article is a PNAS Direct Submission.
1To
whom correspondence should be addressed. E-mail:
*In one study (40), subjects were instructed by a second experimenter to deceive the first
experimenter. This deception, though described as ‘‘dishonest,’’ involves neither temptation nor, in our estimation, morally questionable behavior.
This article contains supporting information online at www.pnas.org/cgi/content/full/
0900152106/DCSupplemental.
www.pnas.org͞cgi͞doi͞10.1073͞pnas.0900152106
Table 1. Reaction time data
Group
Condition
M (SD) RT, ms
Honest
Op Win
Op Loss
No-Op Win
No-Op Loss
Op Win
Op Loss
No-Op Win
No-Op Loss
Op Win
Op Loss
No-Op Win
No-Op Loss
519 (195)
556 (215)
520 (152)
580 (215)
511 (229)
585 (324)
507 (208)
548 (307)
527 (218)
800 (298)
504 (164)
611 (274)
Ambiguous
Dishonest
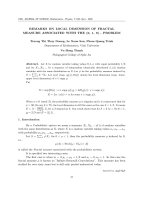
Fig. 1. Task sequence: The subject (1) observes the trial’s monetary value and
privately predicts the outcome of the upcoming coin flip, (2) records this
prediction by pressing 1 of 2 buttons (No Opportunity condition) or presses
one of these buttons randomly (Opportunity condition), (3) observes the
outcome of the coin flip, (4) indicates whether the prediction was accurate, (5)
observes the amount of money won/lost based on the recorded prediction (No
Opportunity) or the reported accuracy (Opportunity), and (6) waits for the
next trial. Op, opportunity. Button presses in response to screen 2 in the
Opportunity condition and screen 4 in the No Opportunity condition control
for motor activity.
Opportunity Loss trials (in which the subject lost money because
s/he chose not to cheat) vs. No-Opportunity Loss trials (in which
the subject lost money and could do nothing about it). According
to the Will hypothesis, forgoing an opportunity for dishonest gain
requires the active resistance of temptation. Thus, the Will
hypothesis predicts that, in the honest group, the Opportunity
Loss trials (relative to No-Opportunity Loss trials) will preferentially engage brain regions associated with response conflict,
cognitive control, and/or response inhibition. Such regions include the anterior cingulate cortex (ACC) (19, 20), the dorsolateral prefrontal cortex (DLPFC) (20, 21, 23), and the ventrolateral prefrontal cortex (VLFPC) (22, 24, 25). For convenience
we refer to these regions as the ‘‘control network,’’ but our use
of this label does not imply a one-to-one mapping of structure to
function. (See SI Text for further discussion.) According to the
Grace hypothesis, honest behavior follows from the absence of
temptation, implying no need to actively resist temptation when
the opportunity for dishonest gain is present. Thus, the Grace
hypothesis, in its strongest form, predicts that honest individuals
will exhibit no additional control-related activity when they
choose to refrain from dishonest behavior. Both of these hypotheses also make competing predictions concerning reaction
time (RT). The Will hypothesis predicts that honest individuals
will exhibit increased RTs when they choose to refrain from
dishonest behavior, reflecting the engagement of additional
controlled cognitive processes in actively resisting temptation. In
contrast, the Grace hypothesis, in its strongest form, predicts that
honest individuals will exhibit no difference in RT between
Opportunity Loss trials and No-Opportunity Loss trials.
With respect to dishonest individuals, there are at least 3
reasons to expect increased control network activity for Opportunity trials. First, research on instructed lying consistently
implicates control network activity in decisions to lie (14, 26),
possibly because honesty is the default response in such contexts.
Second, dishonest individuals may engage cognitive control in
resisting the temptation to lie, however infrequently or unsuccessfully. Third, control network activity may be engaged in the
process of actively deciding whether to lie, independent of the
choice made. The present study is not designed to distinguish
among these processes, but may offer guidance for future
research. As an alternative to all 3 of these hypotheses, one might
suppose that individuals who cheat do so automatically, engaging
no additional control processes. We note that this hypothesis,
though analogous to the Grace hypothesis, is distinct from the
Grace hypothesis because it applies to dishonest behavior rather
than honest behavior.
Results
Behavioral Data. Table 1 summarizes the RT data. Here we report
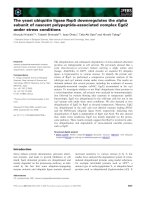
Fig. 2. Distribution of self-reported percent Wins in the Opportunity condition. Subjects were classified into 3 groups based on the probability that
they behaved dishonestly. Mean percent Wins in the No Opportunity condition was 50%. See Table 1 for reaction time data.
Greene and Paxton
on planned contrasts following a 2 (group: Honest vs. Dishonest) ϫ 2 (condition: Opportunity vs. No Opportunity) ϫ 2
(outcome: Win vs. Loss) mixed-effects ANOVA with subject as
a random effect using the residual maximum likelihood (REML)
fitting method. We compared Opportunity Win trials, which
include both honest and dishonest wins, to No-Opportunity Win
PNAS ͉ July 28, 2009 ͉ vol. 106 ͉ no. 30 ͉ 12507
NEUROSCIENCE
Op, opportunity; RT, reaction time.
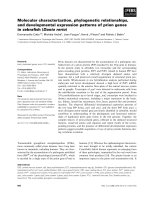
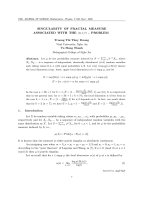
Fig. 3. Brain regions exhibiting increased activity in the Opportunity condition, as compared with the No Opportunity condition, broken down by group (honest
vs. dishonest) and outcome type (win vs. loss). BA, Brodmann area. fMRI data are projected onto a reference anatomical image. (A) Increased activity in bilateral
DLPFC is associated with decisions to lie (Opportunity Wins Ͼ No-Opportunity Wins) in dishonest subjects. (B) Increased activity in bilateral ACC/SMA, DLFPC,
VLPFC, DMPFC, and right parietal lobe is associated with decisions to refrain from lying (Opportunity Losses Ͼ No-Opportunity Losses) in dishonest subjects. (C)
Increased activity in bilateral VLPFC is associated with decisions to accept honest wins (Opportunity Wins Ͼ No-Opportunity Wins) in honest subjects. No
significant effects were observed in association with decisions to refrain from lying (Opportunity Losses Ͼ No-Opportunity Losses) in honest subjects.
trials, which include only forced honest wins. Within the dishonest group there was no significant difference in RT between
these 2 cells [F(1, 78) ϭ 0.31, P ϭ 0.58]. Within the dishonest
group, Opportunity Loss trials involve ‘‘limited honesty’’ (i.e.,
decisions to refrain from dishonest behavior in individuals who
are willing to behave dishonestly in the present context). The
No-Opportunity Loss trials, in contrast, involve only forced
losses. Within the dishonest group, there was a significant
difference in RT between these 2 cells [F(1, 78) ϭ 21.98, P Ͻ
0.0001]. This finding suggests that additional cognitive processes
are engaged when dishonest subjects forgo opportunities for
dishonest gain (i.e., when they engage in limited honesty).
Consistent with these findings, Opportunity Loss trials were
slower than Opportunity Win trials within the dishonest group
[F(1, 27) ϭ 44.30, P Ͻ 0.0001].
Within the honest group there was no significant difference in
RT between Opportunity Win trials and No-Opportunity Win
trials [F(1, 78) ϭ .001, P ϭ 0.97]. Critically, there was also no
significant difference in RT between Opportunity Loss trials and
No-Opportunity Loss trials [F(1, 78) ϭ 0.03, P ϭ 0.87]. This
finding contrasts starkly with that obtained for the dishonest
group and is consistent with the Grace hypothesis, suggesting
that honest subjects engage no additional cognitive processes
when they forgo opportunities for dishonest gain. Likewise, there
was no significant difference in RT between Opportunity Win
trials and Opportunity Loss trials in the honest group [F(1, 78) ϭ
1.81, P ϭ 0.18].
For Opportunity Win trials, there was no significant difference
in RT between the honest and dishonest subjects [F(1, 58.2) ϭ
0.04, P ϭ 0.84]. For Opportunity Loss trials, however, the
dishonest subjects took longer [F(1, 58.2) ϭ 15.27, P ϭ 0.0002].
As these findings suggest, within the Loss trials there was a
significant group ϫ condition interaction [F(1, 26) ϭ 8.67, P ϭ
0.007], generated by the longer RTs for Opportunity Loss trials
in the dishonest group. No such interaction was observed within
the Win trials [F(1, 26) ϭ 0.75, P ϭ 0.39].
fMRI Data. (See Table S1 for a summary of fMRI contrasts.) To
identify neural activity associated with choosing to behave
dishonestly, we separately analyzed the data from the dishonest
group. (See following text for group comparisons.) We compared Opportunity Win trials (which include both honest and
dishonest wins) to No-Opportunity Win trials (which include
only honest wins). This comparison revealed increased activity
bilaterally in the DLPFC for Opportunity Win trials, associating
12508 ͉ www.pnas.org͞cgi͞doi͞10.1073͞pnas.0900152106
these regions with choosing to lie (Fig. 3A and Table S1).
Critically, these 2 conditions, both here and in subsequent
contrasts, did not differ significantly in mean reward/punishment
per trial (signed Wilcoxon rank sum, P Ͼ 0.5). Thus, the findings
reported here cannot be explained in terms of differing levels of
reward. The reverse contrast (No-Opportunity Wins Ͼ Opportunity Wins) yielded no significant effects.
To identify neural activity associated with choosing to refrain
from dishonest behavior in the dishonest group (limited honesty)
we compared Opportunity Loss trials (limited honest losses) to
No-Opportunity Loss trials (forced losses). This comparison
revealed increased activity for Opportunity Loss trials bilaterally
in the control network (Fig. 3B and Table S1). The reverse
contrast yielded no significant effects. Thus, consistent with the
RT data, we find that control network activity is most robustly
associated not with lying, but with refraining from lying in
individuals who are willing to lie in the present context (i.e., with
limited honesty).
To identify neural activity associated with honest behavior, we
repeated the previous analyses in the honest group. Once again,
the critical test for the Will and Grace hypotheses is the
comparison between Opportunity Loss trials and NoOpportunity Loss trials. Consistent with the RT data, this
comparison revealed no significant effects. This null result is
striking in that the same contrast (with identical power and
statistical thresholds) revealed robust activation in dishonest
subjects (Fig. 3B). To further explore this finding, we conducted
a spatially restricted analysis using a region of interest (ROI)
mask generated by the same contrast in dishonest subjects (Fig.
3B) and a dramatically reduced voxelwise threshold (P Ͻ 0.05).
This contrast also yielded no significant effects. A voxelwise
analysis restricted to the PFC confirmed this group ϫ condition
interaction in the R DLPFC, ACC/SMA, and DMPFC (P Ͻ 0.05
corrected). A whole-brain analysis (Fig. S1) confirmed this
interaction in the R parietal lobe (P Ͻ 0.001 uncorrected). The
L DLPFC and bilateral VLPFC exhibited this interaction as well,
but at lower thresholds (see Tables S1 and S2). Thus, the honest
subjects, unlike the dishonest subjects, showed no sign of engaging additional control processes (or other processes) when
choosing to forgo opportunities for dishonest gain. These findings support the Grace hypothesis. Critically, all 14 honest
subjects stated in debriefing that they were aware of the opportunity to cheat, indicating that their honest behavior was not due
to ignorance.
Comparing Opportunity Wins to No-Opportunity Wins reGreene and Paxton
vealed increased activity for Opportunity Wins bilaterally in the
VLPFC and no significant effects for the reverse contrast (Fig.
3C and Table S1). These VLPFC regions are ventral to those
identified previously. Neither the Will nor Grace hypothesis
explains why honest subjects would exhibit increased VLPFC
activity when choosing to accept honest wins.† We emphasize,
however, that this result is not inconsistent with the Grace
hypothesis, which specifically predicts the absence of additional
control network activity for only those trials in which honest
subjects forgo dishonest wins (Opportunity Loss trials).
The present findings suggest that individual differences in
control network activity may be correlated with individual
differences in the presence/frequency of dishonest behavior. To
explore this possibility, we performed a backward stepwise
multiple regression analysis using each subject’s self-reported
percent Wins in the Opportunity condition (an estimate of lying
frequency) as the dependent variable. We initially entered into
the model 18 independent neural variables for each subject,
consisting of the mean percent signal change (averaged over 3
postdecision time points) in spherical ROIs corresponding to
each of the 9 brain regions identified in our analyses of dishonest
subjects, for both Opportunity Win and Opportunity Loss trials.
We also included each subject’s mean RT for Opportunity Win
and Opportunity Loss trials. Following stepwise reduction, the
resulting model captured 79% of the variance using 5 brain
regions and 7 independent variables (Fig. 4 and Table S3).
Discussion
The behavioral and fMRI data support the Grace hypothesis
over the Will hypothesis, suggesting that honest moral decisions
depend more on the absence of temptation than on the active
resistance of temptation. Individuals who behaved honestly
showed no sign of engaging additional controlled cognitive
processes when choosing to behave honestly. These individuals
exhibited no additional neural activity of any kind when they
chose to forgo opportunities for dishonest gain, as compared
with control trials in which there was no such opportunity. We
†It
is possible that this activity reflects the honest subjects’ pride or self-doubt upon
accepting legitimately won rewards, respectively positive and negative responses to these
events. This interpretation is consistent with the implication of this region in the regulation of ‘‘self-conscious emotion’’ (42).
Greene and Paxton
‡One
study (41) did find increased prefrontal activity in association with the reporting of
‘‘salient truth,’’ but the regions identified in this study appear to overlap minimally with
those identified here.
PNAS ͉ July 28, 2009 ͉ vol. 106 ͉ no. 30 ͉ 12509
NEUROSCIENCE
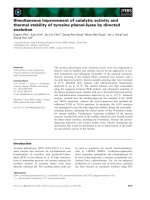
Fig. 4. A stepwise regression model accounts for the frequency of dishonest
behavior in individuals (as indexed by percent Wins in the Opportunity condition) based on fMRI BOLD signal in 5 brain regions (L DLPFC, DMPFC, R
parietal lobe, and bilateral VLPFC). Model R2 ϭ 0.79; Adj. R2 ϭ 0.74, r ϭ 0.89,
n ϭ 35, P Ͻ 0.0001 (See Table S3).
provided a more stringent test of this negative result by dramatically reducing the statistical threshold for this comparison,
focusing on brain regions that exhibited effects for this comparison in dishonest subjects (Fig. 3B). This more-stringent test also
revealed no effects, and further tests (group ϫ contrast interaction) confirmed that the honest and dishonest subjects exhibited different patterns of activity in these regions. The RT data
support the Grace hypothesis as well: Honest individuals took no
longer to forgo opportunities for dishonest gain than they did to
report their forced losses in control trials. Dishonest individuals,
in contrast, took considerably longer to forgo opportunities for
dishonest gain. This convergent support for the Grace hypothesis
is somewhat surprising. We conducted a survey to assess the a
priori plausibility of the Will and Grace hypotheses and found
that ordinary people tend to favor the Will hypothesis (See SI
Text).
Dishonest behavior was associated with neural activity in brain
regions associated with cognitive control, including the ACC (19,
20), DLPFC (20, 21, 23), and VLPFC (22, 24, 25) (Fig. 3 A and
B). Moreover, patterns of activity in these control-related regions were correlated with individual differences in the frequency of dishonest behavior (Fig. 4 and Table S3). These
findings are consistent with prior research examining instructed
lying (14) in associating control network activity with lying.
However, in contrast to prior studies,‡ we find that control
network activity is most robustly associated, not with lying per se,
but with the limited honesty of individuals who are willing to lie
in the present context. It is unlikely that control network activity
associated with limited honesty (Fig. 3B) is related to overcoming a default honesty response because such responses are
themselves honest. However, this hypothesis may still explain the
DLPFC activity observed in association with decisions to lie (Fig.
3A). Alternatively, all of the observed control network activity
may reflect (often unsuccessful) attempts to resist temptation.
Finally, this activity may reflect the process of actively deciding
whether to lie, independent of the choice made. This may be the
most parsimonious explanation, given that control network
activity was observed in decisions to lie as well as decisions to
refrain from lying in dishonest individuals. The fact that control
network activity was more robust and widespread in association
with decisions to not lie may be explained by the fact that all
Opportunity Loss trials involve decisions not to lie, whereas only
a minority of Opportunity Win trials involve decisions to lie
because most Opportunity Win trials are won honestly. Consistent with this idea, a direct comparison of Opportunity Win to
Opportunity Loss trials revealed no effects in the control
network (Table S1), suggesting that the patterns of activity
associated with lying and refraining from lying in dishonest
individuals are not so dissimilar. Finally, we emphasize that the
control network activity observed in association with limited
honesty is not inconsistent with the Grace hypothesis. This is
because the Grace hypothesis applies only to honest decisions in
individuals who consistently behaved honestly and not to decisions reflecting limited honesty.
Although the tasks in the Opportunity and No Opportunity
conditions are nearly identical, they differ at the first response
stage (recording prediction vs. random button-press; see Fig. 1).
Thus, one might suppose that it is this task difference, rather
than processing related to dishonesty, that explains the effects
observed when comparing these conditions. However, if that
were so, such effects should also be observed in the honest group,
but they were not. In addition, this would not explain why activity
in the regions identified correlates with the frequency of dis-
honest behavior (Fig. 4). Finally, peak response time in these
regions is more consistent with these effects being related to the
accuracy reports (Ϸ5 sec earlier) than the prediction/random
responses (Ϸ8 sec earlier) (27) (See Fig. S2 and related discussion in SI Text).
RT data are often used to identify the engagement of additional cognitive processing in task performance. We note that,
here, the fMRI data complemented and/or outstripped the RT
data in this capacity in at least 3 ways. First, the fMRI data
revealed increased bilateral DLPFC activity in association with
decisions to lie (Opportunity Win trials Ͼ No-Opportunity Win
trials), whereas the RT data revealed no effect for this comparison. Second, though the RT data accounted for 27% of the
individual behavioral variance, the fMRI data accounted for
79% of this variance, including all of the variance accounted for
by the RT data. Finally, given that fMRI data can identify the
engagement of additional cognitive processes that are not apparent in RT data, the null results observed in the fMRI data
provide support for the Grace hypothesis that is complementary
to, and probably stronger than, that supplied by the RT data.
Although our present focus is on the cognitive neuroscience
of honesty and dishonesty, our findings and methods may be of
interest to researchers studying brain-based lie detection (14), in
part because the present study is arguably the first to establish a
correlation between patterns of neural activity and real lying.
However, the present experiment has several notable limitations
that deserve attention. First, the model we have developed has
not been tested on an independent sample, and therefore its
probative value remains unknown. Second, our task design does
not allow us to identify individual lies. Third, our findings
highlight the challenge in distinguishing lying from related
cognitive processes such as deciding whether to lie. Finally, it is
not known whether our task is an ecologically valid model for
real-world lying. For example, the neural signature of real
prepared lies (28) may look different from the patterns observed
in association with lying here. Bearing these limitations in mind,
our findings may suggest new avenues for research on brainbased lie detection. For example, our findings suggest that
interrogations aimed at eliciting indecision about whether to lie,
rather than lies per se, may be more effective, provided that the
goal is to assess the trustworthiness of the subject rather than the
veracity of specific statements.
Several further limitations of the present study deserve attention. First, we cannot determine how many of our dishonest
subjects were aware of their dishonesty (13). Some subjects
spontaneously confessed in debriefing, but we did not, in this first
study, probe dishonest subjects concerning their levels of selfawareness due to this topic’s sensitive nature. Second, although
our analyses revealed no evidence of temptation and consequent
control in the honest subjects, it is not known whether these
subjects experienced and willfully extinguished temptation early
in the experiment. Third, although many honest subjects claimed
in debriefing to have behaved honestly for moral reasons (e.g.,
‘‘I was feeling moral’’), we cannot here make claims concerning
these subjects’ motivations for behaving honestly (13). In calling
these subjects ‘‘honest,’’ we are claiming only that they engaged
in no (or very little) dishonest behavior. The data, however, do
not support the hypothesis that their honest behavior was
actively motivated by processes present only in the Opportunity
condition, such as concern with being caught. If that were so, we
would expect to observe some kind of increased activity in the
honest subjects for the contrast Opportunity Loss Ͼ NoOpportunity Loss, but no such activity was observed. Finally, as
noted previously, it is not known whether the behavior observed
here reflects stable dispositions to behave honestly or dishonestly (29–31). The present findings do suggest, however, that
some individuals can, at least temporarily, achieve a state of
moral grace.
12510 ͉ www.pnas.org͞cgi͞doi͞10.1073͞pnas.0900152106
Methods
Subjects. We report data from 35 healthy adults (18 females, 17 males, ages
18 –58, mean age 24 years). All were right-handed, native English speakers and
were screened for the absence of any history of psychiatric and neurological
problems. In addition to the data drawn from these 35 subjects, data from 8
subjects were discarded for technical reasons (excessive head movement,
software/hardware failures, image artifact). Data from 4 subjects were discarded due to unbalanced factors (too few self-reported losses in the Opportunity condition) as recommended by AFNI (32). Data from 4 subjects were
discarded due to suspicions revealed in debriefing concerning the study’s
purpose. Data from one subject were discarded due to ignorance of the
possibility of cheating revealed in debriefing. Data from one subject were
discarded due to evidence that the subject deliberately underreported accuracy for relatively low-value Opportunity trials to disguise cheating. To ensure
an adequate balance of honest and dishonest subjects, some subjects were
recruited from a pool of participants who participated in pilot testing. These
subjects were not debriefed before participating in the present study. (See SI
Text for further discussion of subject exclusions/inclusions.) Subjects were paid
$75 by check for participating, in addition to winnings from the experimental
task.
Procedures. All experimental procedures complied with guidelines of the
Harvard University and Partners Healthcare IRBs. Subjects gave written informed consent and filled out the following personality/psychometric inventories: the Ten-Item Personality Measure (33), the Need for Cognition Scale
(34), the Disgust Scale (Revised) (35, 36), a 3-item delayed discounting questionnaire (Greene Lab instrument), and the Positive and Negative Affect
Schedule (37). Exploratory results related to these questionnaires were inconclusive and are not reported here. To support our cover story, we also had
subjects complete the Paranormal Belief Scale (38). Subjects were given detailed directions and completed a minimum of 8 practice trials to ensure task
competence. (See SI Text.) At this point some subjects mentioned to the
experimenter that it was possible to cheat. The experimenter responded by
acknowledging his awareness of that possibility, explained that the possibility
of cheating was a necessary by-product of the experimental design, and
encouraged the subject to follow the directions (which preclude cheating if
followed).
Subjects completed a total of 210 trials as described in Fig. 1. Within the 70
Opportunity trials, the values $3, $4, $5, $6, or $7 USD each appeared 14 times,
as was the case for the 70 No Opportunity trials. (See SI Text regarding
deviations.) We included an additional set of 70 low-value Opportunity trials
that were worth $0.02, $0.10, $0.25, $0.35, and $0.50 USD. Each of these values
also appeared 14 times. Data from these trials were not analyzed. They were
included to provide dishonest subjects with additional opportunities for
‘‘limited honesty,’’ giving them cover for cheating in the regular (highervalue) Opportunity trials. Subjects were paid the cumulative value of their
winnings/losses. Net losses were capped at $0, and net winnings were capped
at $75 (not including participation payment). Trials appeared in random order
in a series of 7 blocks of 30 trials each. Subjects’ understanding of the
experiment was assessed in debriefing. They were asked in an open-ended
way about their thoughts and experiences during the experiment. Subsequently, subjects were informed of the true nature of the experiment and
were asked whether they were aware that they could cheat. Some subjects
were excluded based on their responses to these questions (See previous text
and SI Text).
Image Acquisition. Images were acquired using a 3.0 T Siemens Magnetom Tim
Trio full-body scanner at the Martinos Center for Biomedical Imaging of
Massachusetts General Hospital. A high-resolution, whole-brain structural
scan (1 mm isotropic voxel MPRAGE) was acquired before functional imaging.
T2*-weighted functional images were acquired in 33 axial slices parallel to the
AC-PC line with a 0.5-mm interslice gap, affording full-brain coverage. Images
were acquired using an EPI pulse sequence, with a TR of 2,500 ms, a TE of 30
ms, a flip angle of 90, a FOV of 200 mm, and 3.0 ϫ 3.0 ϫ 5.0 mm voxels. Four
additional images included at the start of each run to allow for signal stabilization were discarded.
Image Analysis. Image preprocessing and analysis used the AFNI software
package (32). Images were slice-time corrected, motion corrected, spatially
smoothed using an 8-mm FWHM Gaussian filter, despiked, and normalized to
percent signal change within run. fMRI data were analyzed using multiple
regression at the subject level and a mixed effects ANOVA followed by
planned contrasts (voxelwise uncorrected threshold P Ͻ 0.001, cluster Ն8) at
the group level. Data were fitted using 28 ‘‘tent’’ regressors (piecewise linear
Greene and Paxton
splines) corresponding to 7 time points (0, 2.5, ϩ5, ϩ7.5, ϩ10, ϩ12.5, ϩ15 sec
postresponse), 2 conditions (Opportunity, No Opportunity), and 2 behavioral
outcomes (Win, Loss). Beta weights from time points corresponding to the
decision period (ϩ5, ϩ7.5, and ϩ10 sec following the appearance of screen 4)
were averaged to generate 4 parametric maps for each subject, corresponding
to the 4 main cells: condition (Opportunity vs. No Opportunity) ϫ outcome
(Win vs. Loss). Individual subject data were analyzed using a general linear
model that included 6 sets of motion parameters as regressors of no interest.
Images were then resampled to 3.0 mm isotropic voxels and spatially normalized to the standard coordinate space of Talairach and Tournoux (39) for
group analyses. Subjects were classified as honest, dishonest, or ambiguous as
described in the main text (see Fig. 2). Data for honest and dishonest subjects
were first separately submitted to mixed-effects ANOVAs with subject as a
random effect and condition and outcome as fixed effects. For each group, the
following planned contrasts were performed using a voxelwise threshold of
P Ͻ 0.001 and a cluster threshold of 8 voxels using a third nearest-neighbor
algorithm: Opportunity Wins vs. No-Opportunity Wins, Opportunity Losses vs.
No-Opportunity Losses, Opportunity Wins vs. Opportunity Losses. To test for
group differences (group ϫ condition interactions), we conducted voxelwise
analyses over the PFC (defined anatomically by AFNI) using a voxelwise
threshold of P Ͻ 0.05 and a cluster threshold of 199 voxels, corresponding to
a corrected threshold of P Ͻ 0.05 (algorithm from AFNI AlphaSim). We also
tested for these interactions using whole-brain and ROI-based analyses (see
Tables S1 and S2). To minimize the biased selection of voxels for our individual
differences regression analysis, we replaced our functionally defined ROIs (Fig.
3 A and B) with spherical ROIs (radius 8 mm) centered on the centers of mass
of the original ROIs. (Method suggested by Robert Cox, February 20, 2009.)
1. Haidt J (2001) The emotional dog and its rational tail: A social intuitionist approach to
moral judgment. Psychol Rev 108:814 – 834.
2. Pizarro DA, Bloom P (2003) The intelligence of the moral intuitions: Comment on Haidt
(2001). Psychol Rev 110(1):193–196; discussion 197–198.
3. Ciaramelli E, Muccioli M, Ladavas E, di Pellegrino G (2007) Selective deficit in personal
moral judgment following damage to ventromedial prefrontal cortex. Soc Cogn Affect
Neurosci 2(2):84 –92.
4. Cushman F, Young L, Hauser M (2006) The role of conscious reasoning and intuition in
moral judgment: Testing three principles of harm. Psychol Sci 17(12):1082–1089.
5. Greene JD, Morelli SA, Lowenberg K, Nystrom LE, Cohen JD (2008) Cognitive load
selectively interferes with utilitarian moral judgment. Cognition 107:1144 –1154.
6. Greene JD, Sommerville RB, Nystrom LE, Darley JM, Cohen JD (2001) An fMRI investigation of emotional engagement in moral judgment. Science 293(5537):2105–2108.
7. Koenigs M, et al. (2007) Damage to the prefrontal cortex increases utilitarian moral
judgements. Nature 446(7138):908 –911.
8. Mendez MF, Anderson E, Shapira JS (2005) An investigation of moral judgement in
frontotemporal dementia. Cogn Behav Neurol 18(4):193–197.
9. Mikhail J (2007) Universal moral grammar: Theory, evidence and the future. Trends
Cogn Sci 11(4):143–152.
10. Schaich Borg J, Hynes C, Van Horn J, Grafton S, Sinnott-Armstrong W (2006) Consequences, action, and intention as factors in moral judgments: An fMRI investigation. J
Cogn Neurosci 18(5):803– 817.
11. Valdesolo P, DeSteno D (2006) Manipulations of emotional context shape moral
judgment. Psychol Sci 17(6):476 – 477.
12. Kern M, Chugh D (2009) Bounded ethicality: The perils of loss framing. Psychol Sci
20:378 –384.
13. Mazar N, Amir O, Ariely D (2007) The dishonesty of honest people: A theory of
self-concept maintenance. Social Science Research Network. Available at http://
ssrn.com/abstractϭ979648.
14. Sip KE, Roepstorff A, McGregor W, Frith CD (2008) Detecting deception: The scope and
limits. Trends Cogn Sci 12(2):48 –53.
15. Batson CD, Thompson ER, Seuferling G, Whitney H, Strongman JA (1999) Moral
hypocrisy: Appearing moral to oneself without being so. J Pers Soc Psychol 77:525–537.
16. McClure SM, Laibson DI, Loewenstein G, Cohen JD (2004) Separate neural systems value
immediate and delayed monetary rewards. Science 306(5695):503–507.
17. Metcalfe J, Mischel W (1999) A hot/cool-system analysis of delay of gratification:
Dynamics of willpower. Psychol Rev 106(1):3–19.
18. Bargh JA, Chartrand TL (1999) The unbearable automaticity of being. Am Psychol
54:462– 479.
19. Botvinick MM, Braver TS, Barch DM, Carter CS, Cohen JD (2001) Conflict monitoring and
cognitive control. Psychol Rev 108(3):624 – 652.
20. MacDonald AW, III, Cohen JD, Stenger VA, Carter CS (2000) Dissociating the role of the
dorsolateral prefrontal and anterior cingulate cortex in cognitive control. Science
288(5472):1835–1838.
21. Miller EK, Cohen JD (2001) An integrative theory of prefrontal cortex function. Annu
Rev Neurosci 24:167–202.
22. Elliott R, Dolan RJ, Frith CD (2000) Dissociable functions in the medial and lateral
orbitofrontal cortex: Evidence from human neuroimaging studies. Cereb Cortex
10(3):308 –317.
23. Koechlin E, Ody C, Kouneiher F (2003) The architecture of cognitive control in the
human prefrontal cortex. Science 302(5648):1181–1185.
24. Beer J, Knight R, D’Esposito M (2006) Controlling the integration of emotion and
cognition. Psychol Sci 17(5):448 – 453.
25. Eisenberger NI, Lieberman MD, Williams KD (2003) Does rejection hurt? An FMRI study
of social exclusion. Science 302(5643):290 –292.
26. Spence SA, et al. (2001) Behavioural and functional anatomical correlates of deception
in humans. Neuroreport 12(13):2849 –2853.
27. Huettel S, Song A, McCarthy G (2004) Functional Magnetic Resonance Imaging (Sinauer, Sunderland, MA).
28. Ganis G, Kosslyn SM, Stose S, Thompson WL, Yurgelun-Todd DA (2003) Neural correlates
of different types of deception: An fMRI investigation. Cereb Cortex 13(8):830– 836.
29. Doris JM (2002) Lack of Character: Personality and Moral Behavior (Cambridge Univ
Press, Cambridge).
30. Harman G (1999) Moral philosophy meets social psychology: Virtue ethics and the
fundamental attribution error. Proc Aristotelian Soc 99:315–331.
31. Ross L, Nisbett RE (1991) The Person and the Situation (McGraw-Hill, New York).
32. Cox RW (1996) AFNI: Software for analysis and visualization of functional magnetic
resonance images. Comput Biomed Res 29:162–173.
33. Gosling SD, Rentfrow PJ, Swann WB (2003) A very brief measure of the Big Five
personality domains. J Res Pers 37:504 –528.
34. Cacioppo J, Petty R, Kao C (1984) The efficient assessment of need for cognition. J Pers
Assess 48:306 –307.
35. Rozin P, Haidt J, McCauley C, Dunlop L, Ashmore M (1999) Individual differences in
disgust sensitivity: Comparisons and evaluations of paper-and-pencil versus behavioral
measures. J Res Pers 33:330 –351.
36. Olatunji BO, et al. (2007) The Disgust Scale: Item analysis, factor structure, and
suggestions for refinement. Psychol Assess 19(3):281–297.
37. Watson D, Clark LA, Tellegen A (1988) Development and validation of brief measures
of positive and negative affect: The PANAS scales. J Pers Soc Psychol 54(6):1063–1070.
38. Tobacyk JJ, Milford G (1983) Belief in paranormal phenomena: Assessment instrument
development and implications for personality functioning. J Pers Soc Psychol 44:1029 –
1037.
39. Talairach J, Tournoux P (1988) A Co-Planar Stereotaxic Atlas of the Human Brain
(Thieme, New York).
40. Abe N, Suzuki M, Mori E, Itoh M, Fujii T (2007) Deceiving others: Distinct neural
responses of the prefrontal cortex and amygdala in simple fabrication and deception
with social interactions. J Cogn Neurosci 19(2):287–295.
41. Langleben DD, et al. (2005) Telling truth from lie in individual subjects with fast
event-related fMRI. Hum Brain Mapp 26(4):262–272.
42. Beer JS, Heerey EA, Keltner D, Scabini D, Knight RT (2003) The regulatory function of
self-conscious emotion: Insights from patients with orbitofrontal damage. J Pers Soc
Psychol 85(4):594 – 604.
Greene and Paxton
PNAS ͉ July 28, 2009 ͉ vol. 106 ͉ no. 30 ͉ 12511
NEUROSCIENCE
ACKNOWLEDGMENTS. Many thanks to Randy Buckner, Miguel Capo´, Fiery
Cushman, Brendan Dill, Dan Gilbert, Jonathan Haidt, Andrea Heberlein,
Wendy Mendes, Amitai Shenhav, Mike Waskom, Dan Wegner, and members
of the MacArthur Foundation Law and Neuroscience Project for their comments/assistance. This material is based upon work supported by the John D.
and Catherine T. MacArthur Foundation (Award 07– 89249-000-HCD) and the
Regents of the University of California. Any opinions, findings, conclusions, or
recommendations expressed in this publication are those of the authors and
do not necessarily reflect the views of the John D. and Catherine T. MacArthur
Foundation or of the Regents of the University of California. This research was
also supported by the National Science Foundation (SES-082197 8) and the
Athinoula A. Martinos Center for Biomedical Imaging (NCRR P41RR14075).
Supporting Information
Greene and Paxton 10.1073/pnas.0900152106
SI Text
SI Methods and Related Discussion. The present experimental
design differs substantially from those used previously in cognitive neuroscience and moral psychology. For this reason, we
here attempt to anticipate concerns and misunderstandings that
are likely to arise from our methods and interpretation. This
section includes supplemental methodological information and
addresses related concerns. The SI Discussion that follows
addresses further concerns related to the interpretation of our
data.
Exclusion of Subject for Strategic Underreporting of Accuracy. We
classified subjects as ‘‘honest’’ or ‘‘dishonest’’ based on their
reported levels of accuracy in the Opportunity condition. However, it is possible to gain money dishonestly while maintaining
a chance level of accuracy by cheating in relatively high-value
Opportunity trials and deliberately underreporting accuracy for
relatively low-value Opportunity trials. Subjects who use this
strategy should exhibit improbably high levels of cumulative
reward given their win/loss percentages. To identify such subjects
we compared the winnings of each honest subject to those of
simulated honest subjects (10,000 permutations) with win/loss
percentages individually matched to the subject being tested.
Based on these findings, we discarded the data of one subject
initially classified as honest whose winnings were improbably
large given that subject’s win/loss percentage (P ϭ 0.005). The
winnings of all other honest subjects were consistent with their
respective win/loss percentages (P Ͼ 0.05), making the excluded
subject an extreme outlier. This subject was excluded because
s/he could not be classified as ‘‘honest’’ (for obvious reasons) and
did not meet our established, and rather conservative, criteria for
inclusion in the ‘‘dishonest’’ group, which is based on selfreported accuracy in the Opportunity condition. Likewise, it did
not make sense to include this subject in the ‘‘ambiguous’’ group
because his/her self-reported accuracy appears to be distorted,
and it is this accuracy report that is used in the individual
differences analysis that includes the ‘‘ambiguous’’ subjects.
Exclusion of Subjects Based on Suspicion or Ignorance. In debriefing,
subjects were first asked, in an open-ended way, what they
thought the experiment was about. At this point in debriefing, 4
subjects initially classified as dishonest, 1 subject classified as
ambiguous, and 4 subjects classified as honest voiced suspicions
that the experiment was about cheating/lying/dishonesty. We
discarded the data from the 4 dishonest subjects, but not the
others. Our aim in doing this was to exclude data from subjects
who may be seen as morally justified in deceiving the experimenters because they believed that the experimenters were
attempting to deceive them. We adopted this policy as a conservative measure, anticipating that some may hesitate to call
such deception dishonest. (See the following discussion concerning our operational definitions of honesty and dishonesty.) We
included the remaining subjects because it is not essential to our
design that honest behavior be motivated by purely moral (rather
than prudential) considerations. (See the following discussion.)
Additional analyses verified that our key findings held when the
4 suspicious honest subjects were excluded.
Subjects were eventually informed of the purpose of the
experiment and were asked whether they were aware that they
could cheat. All but one subject indicated that they were aware
of this. Data from this subject were excluded because our aim is
Greene and Paxton www.pnas.org/cgi/content/short/0900152106
to investigate honest behavior in the face of opportunity for
dishonest gain, and this subject was not aware of the opportunity.
Inclusion of Subjects with Prior Participation. To ensure an adequate
supply of dishonest behavior for our fMRI experiment, we
recruited subjects who, based on their performances in pilot
testing, were likely to exhibit high levels of dishonest behavior in
a second testing session, and while undergoing brain scanning.
These subjects were not debriefed before their participation in
the fMRI experiment. Two consequences of this procedure
deserve attention. First, the distribution of honest/dishonest
performances observed in the fMRI study (Fig. 2) is not
necessarily representative of our subject pool. (The proportions
of subjects reaching dishonesty threshold in pilot testing and in
the present experiment were comparable, both at Ϸ40%, depending on exclusions. However, only 26% of first-time subjects
reached dishonesty threshold in the present experiment, suggesting that the brain scanning environment may have reduced
the level of dishonesty.) Second, the proportion of first-time and
repeat subjects differs between the honest and dishonest groups,
raising the possibility that our findings could be accounted for by
differences in task experience rather than differences in honest/
dishonest behavior (11 of 14 honest subjects were first-time
subjects; 5 of 14 dishonest subjects were first-time subjects). This
alternative hypothesis could possibly explain why we observed
differences in control network activity between groups. However, it cannot explain within-group (first-time group or repeatgroup) correlations between levels of control network activity
and frequency of dishonest behavior.
Thus, to test this alternative hypothesis, we reexamined the
results of our regression analysis correlating individual differences in control network activity with individual levels of
dishonesty (Fig. 4 and Table S2). To determine whether the
success of the regression model depends on a confound based on
first-time (n ϭ 19) vs. repeat (n ϭ 16) subjects, we separately
assessed the accuracy of the model predictions for both groups.
The correlations between model predictions and actual values
were very high for both groups: r ϭ 0.89 (P Ͻ 0.0001) for
first-time subjects and r ϭ 0.95 (P Ͻ 0001) for repeat subjects.
Because the model accounts for most of the variance within the
first-time subjects and within the repeat subjects, the success of
the model cannot be explained in terms of confounding differences between these 2 groups. We note that this regression
analysis is based on percent signal changes in ROIs identified by
our 2 critical within-subject contrasts: Opportunity Wins Ͼ
No-Opportunity Wins and Opportunity Losses Ͼ NoOpportunity Losses.
Probabilistic Classification of Subjects as Honest, Dishonest, or Ambiguous. One might object to our use of statistical methods to
classify subjects as honest and dishonest. More specifically, one
might claim that it is illegitimate to label behavior as dishonest
simply because the evidence indicates that the subject in question
probably cheated. We note, however, that most scientific conclusions are supported by statistical analyses culminating in
probability estimates (P values). Thus, this objection, if taken
seriously, would discredit not only our classification system, but
the conclusions of most scientific papers. We emphasize further
that our threshold for classifying an individual subject as dishonest is very conservative (P Ͻ 0.001). It is true that our method
does not allow us to identify individual responses as dishonest,
but this does not prevent us from identifying individual subjects
1 of 8
as dishonest. (See discussion of implications for brain-based lie
detection in following text.) Finally, we emphasize again that in
labeling subjects as dishonest, we are describing their present
behavior only and not ascribing to them stable personality traits.
Characteristics of Honest vs. Dishonest Subjects. There were no
significant differences in age (t test, P ϭ 0.16), gender (2, P ϭ
0.7), or paranormal belief (t test, P ϭ 0.83) between honest and
dishonest subjects.
Procedural Deviations. For 13 subjects, a stimulus programming
error caused the properly randomized sequence of Opportunity
and No Opportunity trials used in the first run to be repeated for
subsequent runs. This error, although regrettable, does not
compromise the findings presented here. Subjects were given no
additional information that would allow them to make more
accurate predictions, and the resulting changes in trial sequence
did not confound the comparisons made in our analyses. The
primary consequence of this error is that subjects did not
necessarily respond to equal numbers of each trial type, thus
reducing statistical power. Subjects may also have been able to
anticipate upcoming trial types, but, once again, the repetition in
sequencing provided subjects with no strategically useful information.
Subject Instructions. The following instructions were presented to
subjects on a computer:
Thank you for participating. In this study your job is to predict the
outcomes of computerized random coin flips. You may not think
that you have the ability to do this, and that’s okay. Just do your best.
You may be surprised at what you can do! Press any key to continue.
It has been suggested that people make more accurate predictions
when they are motivated to predict accurately. To test this idea, we
will be providing you with varying levels of financial incentive.
Before each coin flip happens, an amount of money will appear on
the screen (e.g., $0.25 or $5.00). This is the amount of money that
you will win or lose depending on whether you accurately predict the
outcome of the coin flip. If your prediction is correct, then you win
the amount of money shown. If your prediction is incorrect, you lose
the amount of money shown. The computer will keep track of all
of your wins and losses. If, at the end of the experiment, your money
total is positive, you will be paid that amount. If your total is negative
or zero, you will not win any additional money. This is not pretend
money. This is real money that you will be paid based on your
performance in the experiment. However, your winnings cannot
exceed $75. Press any key to continue.
It has been suggested that people’s ability to predict the future is
disrupted if they have to record their predictions externally (i.e.,
outside of their minds). To test this idea, we will sometimes ask you
to report your prediction in advance. In other cases, you will simply
tell us after the fact whether or not your prediction was correct. Press
any key to continue.
Before each coin flip you will see the dollar amount that the trial
is worth and, below it, the word ‘‘PREDICT’’ on the screen. At that
point you should make your prediction in your mind. Next you will
either see the word ‘‘RECORD’’ or the word ‘‘RANDOM.’’ If you
see the word ‘‘RECORD’’ you should press the button on the LEFT
to indicate that you are predicting HEADS or the button on the
RIGHT to indicate that you are predicting TAILS. If you see the
word ‘‘RANDOM’’ then you should randomly press either the
LEFT button or the RIGHT button. When you make random
responses, you should not follow any fixed pattern. Press any key to
continue.
Next you will see the word ‘‘HEADS’’ or ‘‘TAILS’’ appear on the
screen. This is the outcome of the computerized coin flip. After that
you will see a screen that says ‘‘CORRECT?’’ At that point you must
indicate whether or not your prediction was correct. If you were told
to hit a random button, it does not matter which button you hit.
Greene and Paxton www.pnas.org/cgi/content/short/0900152106
Whether or not your prediction was correct depends only on the
prediction you made in your mind and the outcome of the coin flip.
Press the LEFT key to indicate (YES) that your prediction was
correct. Press the RIGHT key to indicate (NO) that your prediction
was incorrect. If you failed to form a prediction before the outcome
of the coin flip was revealed, then you should indicate that your
prediction was incorrect. After you have said whether your prediction was correct, the computer will tell you how much money you
won or lost on that coin flip. Press any key to continue.
You will make a total of 210 predictions. You will do these in 7
groups of 30 trials. There will be about 10 seconds between the end
of one trial and the beginning of the next one. After each group of
trials you will have a chance to rest. The whole task will take a little
less than 90 min. Press any key to continue.
You are now ready to practice. Remember, first comes the dollar
amount telling you what the coin flip is worth and the word
‘‘PREDICT.’’ At that point you will make your prediction privately
to yourself. (Note that the dollar amounts presented here will not
count toward your final total.) Then you will see either ‘‘RECORD’’
or ‘‘RANDOM.’’ If you see ‘‘RECORD’’ enter your prediction
(LEFT key HEADS, RIGHT key for TAILS). If you see ‘‘RANDOM’’ press either the LEFT key or the RIGHT key randomly.
Then you will see the outcome of the coin-flip (HEADS or TAILS).
Then you will see the word ‘‘CORRECT?’’ on the screen. At that
point you indicate whether the prediction you made in your mind
was correct. Press the LEFT key (YES) if your prediction was
correct or the RIGHT key (NO) if your prediction was incorrect.
Then the computer will tell you how much money you won or lost
on that coin flip. Then you wait for the next coin flip, which will
begin with a dollar amount, as before. Press any key to begin
practicing.
SI Discussion
Defining Honesty and Dishonesty. In attempting to study honesty
and dishonesty scientifically, one cannot avoid making assumptions about what it means to be honest or dishonest, despite that
these terms are not precisely defined in ordinary discourse. For
present purposes we have defined honesty and dishonesty in
minimal behavioral terms, i.e., as behaviors that a reasonable
person would regard as honest or dishonest given the circumstances. Were the honest people really honest? In refraining
from lying, they knowingly ‘‘left money on the table.’’ This
behavior must have some motivational basis, which we here refer
to as honesty. This minimal, behavioral conception of honesty
does not involve ascribing noble motivations to these individuals.
In calling them honest, we are claiming only that they chose not
to behave dishonestly. [It is a controversial philosophical question whether, and to what extent, more noble forms of honesty
and other virtues exist (1).] Were the ‘‘dishonest’’ people really
dishonest? These individuals violated the rules of the game, to
which they had agreed, and gained money as a result. What’s
more, most of the individuals we tested either did not violate
these rules or did so less than they could have. This suggests a
prevailing norm against the behavior we have called dishonest.
We are agnostic as to whether this dishonest behavior is conscious or unconscious. In our opinion, the observed association
between control network activity and dishonest behavior is no
less significant, and is perhaps more significant, if it turns out that
the dishonest behavior in question is largely unconscious.
Interpretation of Control Network Activity and Reverse Inference.
Because our conclusions do not depend on any specific interpretation of the observed control network activity, or even on
the appropriateness of the ‘‘control network’’ label, our conclusions do not depend on any kind of problematic reverse inference
(2). With respect to the honest subjects, our key finding is that
no brain regions, whether in the control network or elsewhere,
2 of 8
exhibited significant increases in activity when honest subjects
chose to forgo opportunities for dishonest gain (as compared
with matched trials with no opportunity). Here there is no
reverse inference because there are no regional brain activations
to interpret. To the extent that we may accept the ‘‘control
network’’ label as valid, we may infer that an analogue of the
Grace hypothesis applied to dishonesty is probably false: Dishonest behavior appears to involve the engagement of additional
controlled cognitive processes.
Attribution of fMRI BOLD Effects to Accuracy Reports. As noted in the
main text, it is unlikely that the fMRI BOLD effects attributed
to dishonest decisions (Fig. 3 A and B) are related to the
preceding behavioral responses whereby subjects recorded their
predictions (No Opportunity) or pressed random buttons (Opportunity). Once again, this is because the honest subjects (who
also recorded their predictions/pressed random buttons) did not
exhibit such effects and because the fMRI data are correlated
with the frequency of dishonest behavior (Fig. 4). We also noted
that the timing of the BOLD signal is more consistent with its
being related to the accuracy reports than to the prediction/
random responses. This is illustrated in Fig. S2, which depicts the
mean time course of fMRI BOLD activity in the regions
depicted in Fig. 3 A and B for the conditions that exhibited
greater activity in the relevant contrasts. As Fig. S2 illustrates,
the signal tends to peak Ϸ5 sec following the accuracy report,
consistent with the typical 4- to 6-sec lag in peak BOLD response
following a neural event (3). If the signal were primarily related
to the earlier behavioral responses, one would expect the signal
to peak Ϸ3 sec earlier.
The RT data also speak against this alternative interpretation.
As noted in the main text, accuracy reports took longer for
Opportunity Loss trials than for No-Opportunity Loss trials (P Ͻ
0.0001) and for Opportunity Win trials (P Ͻ 0.0001), but only
within the dishonest group. We performed parallel analyses on
the RTs for the earlier behavioral responses. For the first
contrast (dishonest: Opportunity Loss vs. No-Opportunity Loss)
we found a marginally significant effect (P ϭ 0.04) in the
direction opposite that predicted by the alternative hypothesis.
That is, the dishonest subjects took slightly longer to record their
predictions (No Opportunity) than to make their random button
presses (Opportunity). This is consistent with their putting more
effort into prediction in the No Opportunity condition (when
they have to make a prediction), but this result cannot explain
why Opportunity trials are associated with more control network
activity. The second contrast (dishonest: Opportunity Loss vs.
Opportunity Win) did not reveal any significant difference in the
random button-press RTs (P ϭ 0.29). Thus, the RT data for the
moral decisions converge with the fMRI data, but the RT data
for the earlier behavioral responses do not.
1. Kavka, G (1986) Hobbesian Moral and Political Theory (Princeton Univ Press, Princeton,
NJ).
2. Poldrack RA (2006) Can cognitive processes be inferred from neuroimaging data?
Trends Cogn Sci 10:59 – 63.
Greene and Paxton www.pnas.org/cgi/content/short/0900152106
Is It Self-Evident That the Grace Hypothesis Is Correct? A common
criticism of social-psychological research is that the conclusions
reached are self-evident. Here, one might suppose that it is
self-evident that the Grace hypothesis is correct. Indeed, the
Grace hypothesis may be self-evidently correct with respect to
some situations. For example, it seems highly unlikely (although
not impossible) that ordinary law-abiding citizens actively resist
the temptation to shoplift whenever they walk through a store
with minimal security. Thus, one might wonder whether the
situation examined here is also one in which it is self-evidently
the case that honest behavior involves little active self-control.
To assess commonsense expectations concerning the psychology of honest behavior in our coin-flip prediction experiment,
we conducted an additional survey. We emphasize, however, that
this survey was not conducted to assess the validity of the
conclusions drawn from our main experiment. Rather, we conducted this survey to empirically assess the extent to which our
main conclusion is self-evident. [Other researchers have used
similar techniques to assess the self-evidence of their conclusions, most famously Milgram (4).]
Fifty subjects (27 females, mean age 27.5) completed a 1-page
survey in Harvard Square and were compensated $2. The survey
described the behavioral aspect of the coin-flip prediction
experiment in detail and asked people to respond to the following 2 questions:
Question 1: Please circle the answer below that best describes how
things would go if you were to participate in this experiment:
A. I would not be tempted to cheat, at least not for most of the
experiment.
B. I would be tempted to cheat during much of the experiment,
but I would resist that temptation and not cheat.
C. I would cheat.
Question 2: Which of the following statements do you think best
describes people who choose NOT to cheat in this experiment?
A. These people are not tempted to cheat, at least not for most
of the experiment.
B. These people are tempted to cheat during much of the
experiment, but they resist that temptation and don’t cheat.
The results were as follows:
Question 1: A. 38% (19/50), B. 46% (23/50), C. 16% (8/50)
Question 2: A. 32% (16/50), B. 68% (34/50).
Thus, a majority of survey subjects who thought that they
themselves would behave honestly in this experiment thought
that they would do so through substantial resistance of temptation (Will). Here, respondents did not significantly favor one
hypothesis over the other (binomial test, P Ͼ 0.05), despite the
fact that a majority favored the Will hypothesis. In response to
question 2, the tendency to favor the Will hypothesis (answer B)
was significant (binomial test, P Ͻ 0.02). Thus, it is by no means
self-evident that the findings of our experiment would end up
supporting the Grace hypothesis, and, if anything, common sense
appears to favor the Will hypothesis.
3. Huettel S, Song A, McCarthy G (2004) Functional Magnetic Resonance Imaging (Sinauer, Sunderland, MA).
4. Milgram, S (1974) Obedience to Authority (Harper and Row, New York).
3 of 8
Fig. S1. Selected brain regions exhibiting interactions between group (honest vs. dishonest) and condition (Opportunity vs. No Opportunity) within Win trials
(A) and Loss trials (B). fMRI data are projected onto a reference anatomical image. See Table S2 for further details. BA, Brodmann area.
Greene and Paxton www.pnas.org/cgi/content/short/0900152106
4 of 8
Fig. S2. Time course of activity in brain regions exhibiting increased activity in the Opportunity condition (vs. No Opportunity) within dishonest subjects (see
Fig. 3 A and B). Data are shown for the Opportunity condition only. Bold responses tend to peak Ϸ5 sec following the accuracy report (moral decision). This is
consistent with BOLD effects in these regions being related to accuracy reports, rather than prior behavioral responses, which occurred Ϸ8 sec before the peak
responses in most regions.
Greene and Paxton www.pnas.org/cgi/content/short/0900152106
5 of 8
Table S1. Results of planned fMRI contrasts
Group/contrast/region
R/L/M
BA
Max t
(df ϭ 13)
k
Talairach
coordinates
Group ϫ Contrast
F(1, 26)
P
L
R
9/10
9/10
5.72
5.53
11
9
35,Ϫ47, 30
Ϫ29,Ϫ50, 27
1.20
4.46
0.29
0.04
M
9.13
201
Ϫ8,Ϫ23, 50
11.02
0.003
R
L
M
R
L
R
32
8/6
9/10
10/46
9
39/7
47
47
7.36
5.10
4.84
5.07
5.06
5.06
133
9
17
16
15
11
Ϫ35,Ϫ32, 32
46,Ϫ38, 23
7,Ϫ47, 29
Ϫ38, 67, 44
40,Ϫ23,Ϫ10
Ϫ44,Ϫ20, Ϫ1
13.42
3.12
9.03
12.86
4.71
3.59
0.001
0.09
0.006
0.001
0.04
0.07
R
R
2
2
5.04
5.59
15
10
Ϫ32, 38, 69
Ϫ44, 35, 63
0.02
0.48
0.89
0.49
L
R
47/13
47/13
6.01
5.12
36
9
31,Ϫ20,Ϫ13
Ϫ29,Ϫ14,Ϫ13
2.58
5.76
0.12
0.02
R
R
L
3
8
6
6.88
6.39
4.56
264
21
13
Ϫ41, 29, 54
Ϫ14,Ϫ41, 54
23,Ϫ20, 54
2.04
2.63
4.12
0.17
0.12
0.05
Dishonest
Op Wins Ͼ No-Op Wins
Superior frontal gyrus (DLPFC)
Op Losses Ͼ No-Op Losses
Anterior cingulate (ACC)/
Superior frontal gyrus (SMA)
Middle frontal gyrus (DLPFC)
Medial frontal gyrus (DMPFC)
Inferior/superior parietal lobe
Inferior frontal gyrus (VLPFC)
Op Wins Ͼ Op Losses
Postcentral gyrus
Postcentral gyrus
Honest
Op Wins Ͼ No-Op Wins
Inferior frontal gyrus (VLPFC)
Op Losses Ͼ No-Op Losses (no significant effects)
Op Wins Ͼ Op Losses
Postcentral gyrus
Superior frontal gyrus
Middle frontral gyrus
Note: No brain regions exhibited increased activity for the contrasts opposite those above. Voxelwise threshold is P Ͻ 0.001, uncorrected; cluster threshold ϭ
8 voxels; df ϭ 13. To test for Group ϫ Contrast interactions, we computed for each subject the mean percent signal change from baseline in each of the above
ROIs. We then computed difference scores for each ROI for each subject, subtracting the percent signal change scores for the 2 cells that generated the ROI. We
then made a between-group comparison of these difference scores for each ROI (2 rightmost columns). BA, Brodmann area; k, cluster size, Op, opportunity.
Greene and Paxton www.pnas.org/cgi/content/short/0900152106
6 of 8
Table S2. Regions exhibiting Group (Honest vs. Dishonest) ؋ Condition (Op vs. No Op) interactions
Trial type/region
Within Win trials
Superior frontal gyrus (DLPFC)
Superior frontal gyrus (DLPFC)
Superior frontal gyrus (DLPFC)
Within Loss trials
Middle frontal gyrus (DLPFC)
Superior frontal gyrus (DLPFC)
Middle frontal gyrus/superior frontal gyrus (DLPFC)
Anterior cingulate (ACC)
Anterior cingulate (ACC)
Superior frontal gyrus (SMA)
Inferior parietal lobe/supramarginal gyrus
Superior parietal lobe
Medial frontal gyrus (DMPFC)
Inferior frontal gyrus (VLPFC)
R/L/M
BA
k
Talairach
Coordinates
Max F(1, 26)
Uncorrected
threshold, P Ͻ
R
L
L
10
10
8
8
10
13
Ϫ32Ϫ47 27
35Ϫ56 18
20Ϫ38 54
10.33
6.56
7
0.01*
0.05
0.05
R
R
L
R
L
R
R
R
M
R
L
9
10
6/8
32
24/32
8
40
7
6/9
47
47
33
19
18
11
10
18
15
24
44
8
11
Ϫ41Ϫ26 36
Ϫ26Ϫ53 18
38Ϫ11 54
Ϫ5Ϫ38 18
8Ϫ32 21
Ϫ5Ϫ17 51
Ϫ50 53 36
Ϫ38 65 54
Ϫ2Ϫ41 36
Ϫ47Ϫ23Ϫ1
38Ϫ20Ϫ4
16.34
9.66
7.17
7.71
8.41
14.56
14.41
10.38
9.45
4.71
5.42
0.001*
0.005*
0.05
0.01*
0.01*
0.001*
0.001
0.005
0.005*
0.05
0.05
*Survives partial-volume correction (P Ͻ 0.05) performed over prefrontal cortex. Results are from whole-brain voxelwise analyses with a cluster threshold of 8
voxels.
Only effects consistent with a priori regions of interest are listed. For all effects, (Dishonest OpϪ Dishonest No Op) Ͼ (Honest OpϪ Honest No Op). See Table S1
for functional ROI-based interaction analyses. BA, Brodmann area; k, cluster size; Op, opportunity.
Greene and Paxton www.pnas.org/cgi/content/short/0900152106
7 of 8
Table S3. Reduced regression model predicting individual subjects’ percent Wins in the Op condition
Predictor
Intercept
L superior frontal gyrus (DLPFC)
medial frontal gyrus (DMPFC)
medial frontal gyrus (DMPFC)
L inferior frontal gyrus (VLPFC)
R inferior/superior parietal lobe
R inferior/superior parietal lobe
R inferior frontal gyrus (VLPFC)
Condition
Estimate
SE
t
P
OpWin
OpLoss
OpWin
OpWin
OpWin
OpLoss
OpWin
65.95
42.46
49.56
Ϫ55.57
Ϫ60.3
Ϫ24.7
14.7
21.72
2.19
9.73
11.53
14.1
16.39
8.68
7.57
11.97
30.16
4.36
4.3
Ϫ3.94
Ϫ3.68
Ϫ2.84
1.94
1.81
Ͻ0.0001
0.0002
0.0002
0.0005
0.001
0.008
0.06
0.08
Probability to leave ϭ 0.1. Op, opportunity. R2 ϭ 0.79, adjusted R2 ϭ 0.74, r ϭ 0.89, N ϭ 35, model df ϭ 7, P Ͻ 0.0001.
Greene and Paxton www.pnas.org/cgi/content/short/0900152106
8 of 8